INTRODUCTION
A polyhouse provides a protected microclimate essential for optimizing plant growth and maximizing crop yield. However, maintaining favorable microclimatic conditions heavily depends on effective ventilation and environmental management. This study investigates the microclimatic dynamics within a polyhouse by monitoring key environmental parameters—including inside and outside ambient temperature, relative humidity, solar radiation, and wind speed—under varying forced ventilation states (Fan ON vs. Fan OFF). Through multi-point automated data logging at continuous intervals, the collected data is analyzed to assess thermal gradients, heat dissipation, and the direct cause-and-effect relationship between active ventilation and internal microclimate stability. The findings aim to support data-driven climate control strategies for energy-efficient greenhouse management.
Concept-
1)Multi-point data collection.
2)Calculation of inside and outside temperature differnce with fan off and on conditions
DATE- 16/09/2026
DISCUSSION WITH DIXIT SIR-
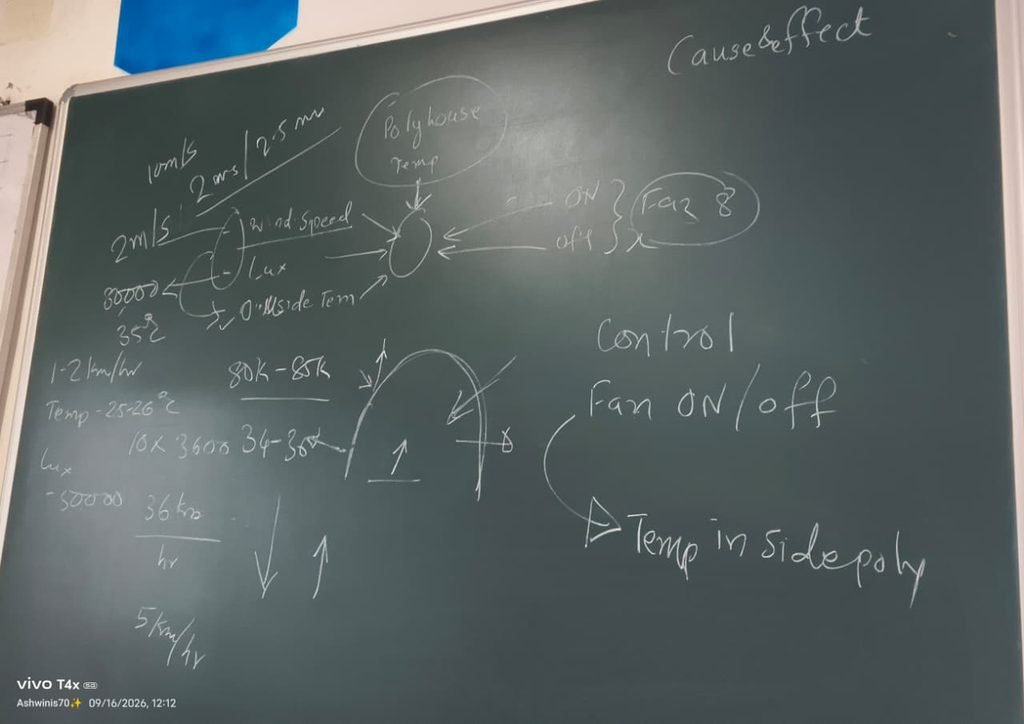
During the discussion, I understood how different environmental parameters such as temperature, humidity, solar radiation and wind speed affect the microclimate inside the polyhouse. I also understood the importance of comparing inside and outside conditions and monitoring the effect of fan operation using data logger readings.
After the discussion, we measured the inside and outside temperatures of the polyhouse and compared them with the data logger readings to check their accuracy. Since the readings matched, we collected the data from the data logger website and combined the readings into a single Excel sheet for further analysis.
Date- 17/09/2026
We collected data on inside and outside polyhouse temperature, solar radiation, and wind speed from the data logger website. The readings were recorded at one-minute intervals, with two readings per minute, and compiled into a single Excel sheet for further analysis.
DATE- 22/09/2026
DISCUSSION WITH Dixit sir on above format data collection- Siddharth and me
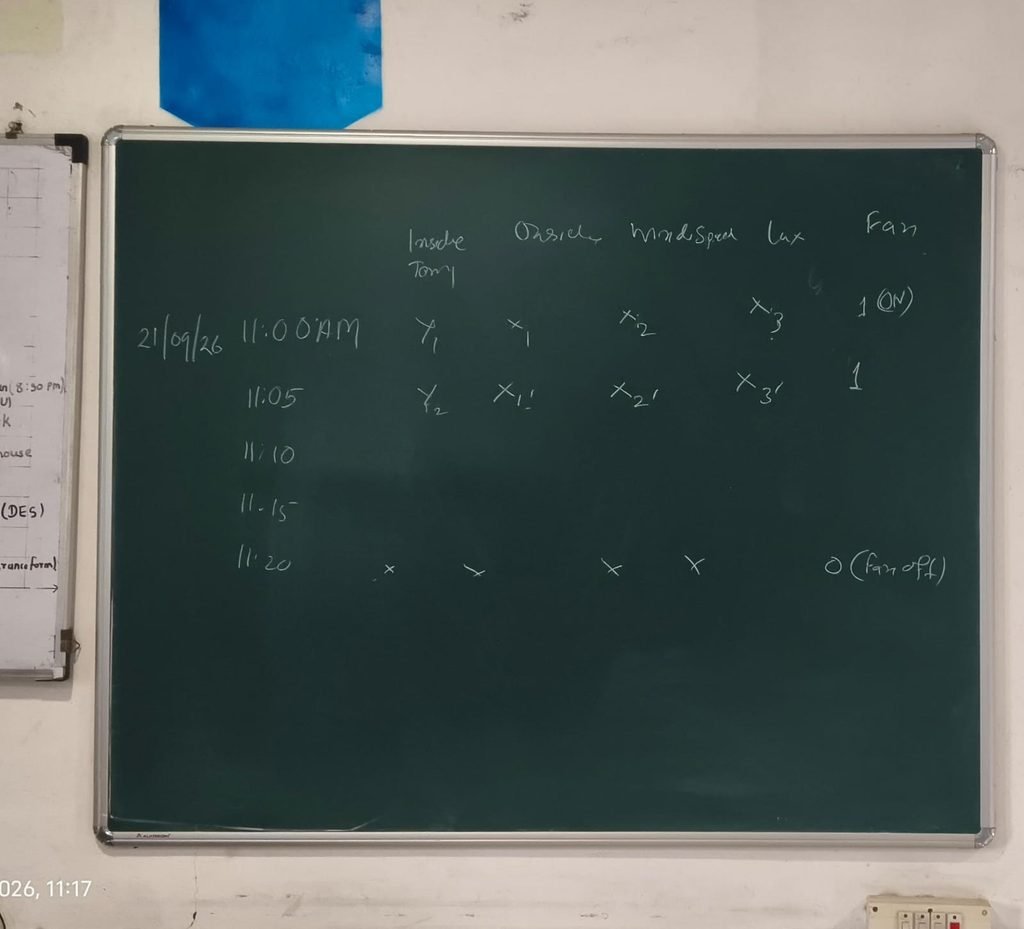
During the discussion, I understood the procedure for monitoring inside and outside temperatures, wind speed, and light intensity in the polyhouse. We discussed recording readings at 5-minute intervals and comparing the environmental parameters when the fan is ON and OFF to study their effect on the polyhouse microclimate.
Installation of timer for Automatic Fan on/off control –
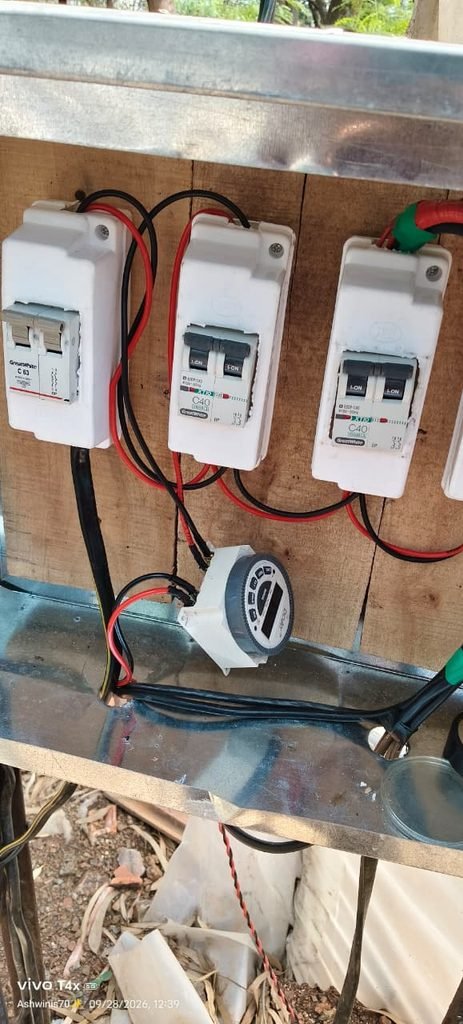
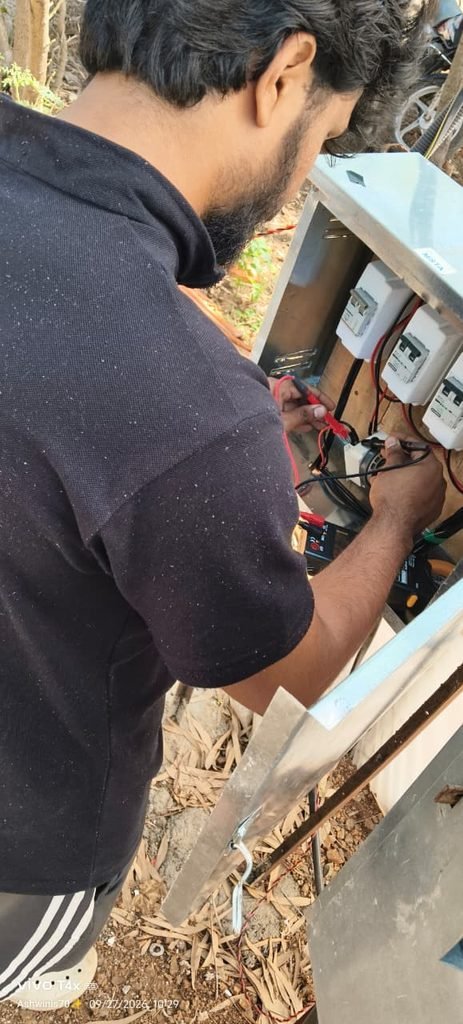
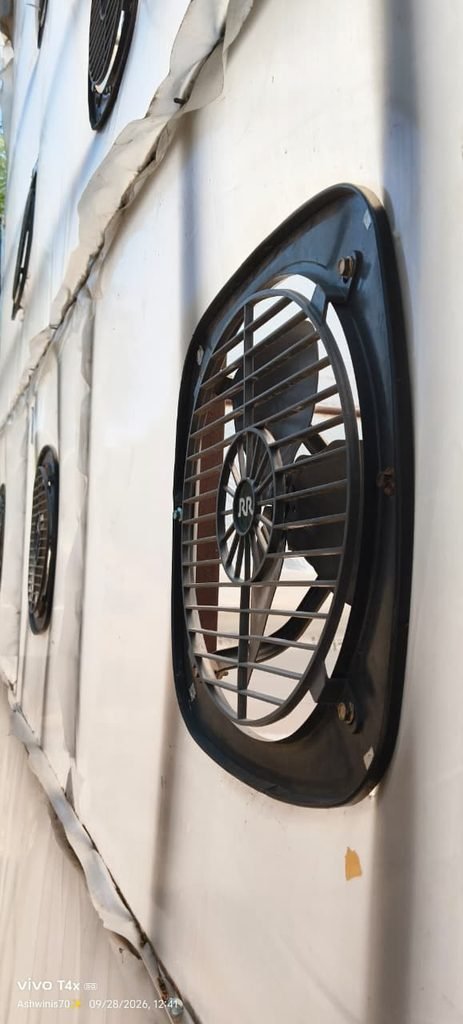
Installation timer for control the fan off and on as specific interval – help of siddharth.
2 hrs polyhouse data report edited with fan off/on status.
prompt Used for data excel sheet-
1. Indoor Data Collection
Three data loggers are installed inside the polyhouse at different locations:
- 2 m away from cooling pad
- Centre of polyhouse
- 2 m away from exhaust fan
Each logger records:
- Temperature
- Relative Humidity (RH)
The purpose of using three locations is to account for spatial variation inside the polyhouse, since temperature and RH are not exactly the same at every location.
2. Indoor Temperature and RH Averaging
For each time interval:
- Retrieve temperature from all three indoor loggers.
- Retrieve RH from all three indoor loggers.
- Align readings belonging to the same time interval.
- Calculate the average of the three locations.
This gives:
Average Indoor Temperature
Average Indoor RH
The resulting values represent the average indoor condition of the polyhouse rather than the condition at one particular location.
3. Outdoor Data Collection
One additional data logger is installed outside the polyhouse.
It records:
- Outdoor temperature
- Outdoor RH
The outdoor logger data is processed similarly to obtain:
- Average outdoor temperature
- Average outdoor RH
for each required time interval.
4. Weather Station Data
A weather station located outside the polyhouse provides:
- Solar radiation
- Wind speed
The weather station provides approximately one observation per minute.
These parameters are important because they influence the thermal and airflow conditions experienced by the polyhouse.
5. Time Synchronisation
This is an important step.
The data logger readings and weather-station readings need to be matched to the same time interval.
The workflow is therefore:
Raw logger data + weather station data
↓
Timestamp alignment
↓
One common time interval
For every minute, the final dataset should ideally contain:
| Parameter | Value |
|---|---|
| Indoor temperature | Average of 3 indoor loggers |
| Indoor RH | Average of 3 indoor loggers |
| Outdoor temperature | Outdoor logger value/average |
| Outdoor RH | Outdoor logger value/average |
| Solar radiation | Weather station |
| Wind speed | Weather station |
This becomes the master processed dataset.
6. Calculate ΔT
Once indoor and outdoor temperatures are aligned to the same time:
where:
- = average indoor temperature
- = outdoor temperature
This tells us how much warmer or cooler the polyhouse is relative to outside.
7. Calculate ΔRH
Similarly:
where:
- = average indoor RH
- = outdoor RH
This shows the difference in humidity between inside and outside.
8. Final Processed Dataset
After processing, one row represents one common time interval.
For example:
| Time | Indoor Temp | Indoor RH | Outdoor Temp | Outdoor RH | Solar Radiation | Wind Speed | ΔT | ΔRH |
|---|---|---|---|---|---|---|---|---|
| 12:01 | 38.2 | 42.1 | 31.5 | 58.2 | 825 | 2.4 | 6.7 | -16.1 |
| 12:02 | 38.4 | 41.8 | 31.6 | 57.9 | 831 | 2.6 | 6.8 | -16.1 |
| 12:03 | … | … | … | … | … | … | … | … |
This is the dataset from which the actual analysis should be performed.
9. Fan ON / Fan OFF Analysis
Once the master dataset is ready, add the operating condition:
Fan ON / Fan OFF
Then observations can be grouped according to the operating condition.
For example:
Fan OFF
→ Solar radiation
→ Wind speed
→ Indoor temperature
→ Outdoor temperature
→ ΔT
versus
Fan ON
→ Solar radiation
→ Wind speed
→ Indoor temperature
→ Outdoor temperature
→ ΔT
This allows the fan’s contribution to be studied.
10. Environmental Filtering
This is where your workflow becomes more useful.
Instead of comparing every Fan ON observation against every Fan OFF observation, filter observations according to similar environmental conditions.
For example:
Solar radiation range
Wind-speed range
↓
Select comparable observations
↓
Compare:
Fan OFF ΔT vs Fan ON ΔT
This reduces the influence of changing weather conditions on the comparison.
11. Final Analysis
From the processed dataset, the junior can eventually calculate:
- Fan OFF mean ΔT
- Fan ON mean ΔT
- ΔT reduction
- Fan OFF mean ΔRH
- Fan ON mean ΔRH
- Solar-radiation × wind-speed ranges
- Fan effectiveness under different environmental conditions
This can then become the basis for the proposed control strategy
DATE- 23/09/2026
Those using prompt for making two days data report as following-
24-26 day of data records.xlsx
DATE- 26/09/2026
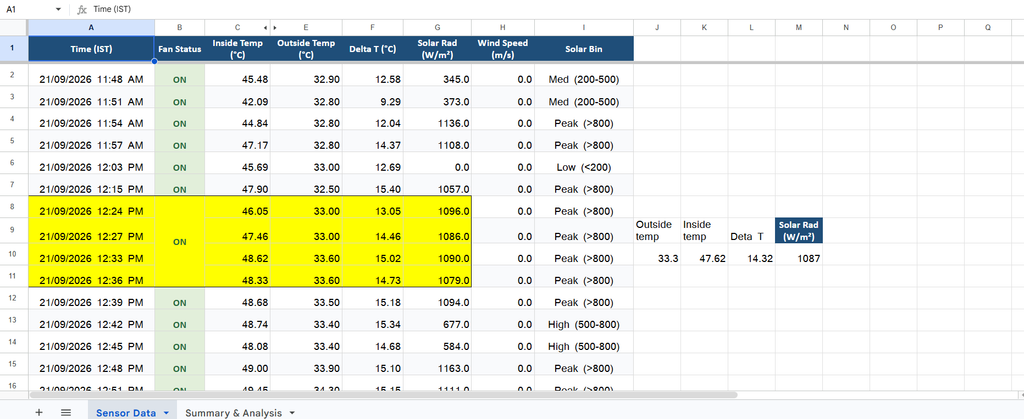
Discussion with Dixit sir on calculations data as per following –
1)Overall data presented as per excel sheet.
calculation of avg temperature 4 days and also calculation of solar radiation.
Dixit sir edited our Excel sheet by highlighting specific readings and adding a summary calculation. The summary includes inside and outside temperatures, temperature difference (Delta T), and solar radiation. We also calculated the average temperature for four days and analysed the solar radiation data.”
Challenges-
While collecting the readings, the wind speed sensor was continuously showing zero. Due to a possible sensor error, we could not obtain continuous wind speed readings.
DATE- 27/09 TO 04/10/2026
After challenges solved,
a prapared data sheet as
Calcalated data sheet-
as per following google link- those data included of 28 september to 4 octomber 2026
those are selective data per day-
Date 6/10/2026 to 10/10/2026
Optimizing Polyhouse Microclimate: A Data-Driven Analysis of Ventilation and Solar Radiation
In modern protected cultivation, managing the internal microclimate of a polyhouse is crucial for crop growth, yield, and energy conservation. Polyhouses naturally trap heat through the greenhouse effect, often leading to extreme thermal stress. To tackle this, forced ventilation (exhaust fans) is commonly deployed.
In this project, we conducted a continuous, data-driven study to monitor environmental parameters, analyze ventilation cycles, and understand how solar radiation directly influences internal temperatures. Here is a step-by-step breakdown of how we collected the data and carried out the statistical analysis.
Step 1: Automated Data Collection & Parameter Monitoring
Using high-precision IoT sensors installed inside and outside the polyhouse, environmental readings were recorded continuously at fixed intervals (every 1 to 3 minutes):
- Inside Temperature (°C): Thermal build-up inside the polyhouse canopy.
- Outside Ambient Temperature (°C): External baseline conditions.
- Temperature Difference ($\Delta T$ in °C): Thermal difference between inside and outside environments ($\text{Inside Temp} – \text{Outside Temp}$).
- Solar Radiation ($\text{W/m}^2$): Incident solar intensity driving heat accumulation.
- Inside Relative Humidity (RH %): Moisture retention and transpiration conditions.
- Wind Speed ($\text{m/s}$): Natural external convection impact.
- Exhaust Fan Status ($\text{ON} / \text{OFF}$): Operational cycles controlled either by timer logic (e.g., 30-minute alternate cycles) or temperature thresholds.
Step 2: Data Preprocessing & Interval Identification
Raw sensor data often requires structural cleaning and segmenting before extraction:
- Timestamp Normalization: Synchronized records into uniform
DD/MM/YYYY hh:mm AM/PMtimestamps. - Cycle Tracking (Interval Segmentation):
- Consecutive operational periods were grouped into unique sets (e.g., Set 1: Fan OFF, Set 2: Fan ON).
- Start time, end time, and total active duration were tagged for every operational set.
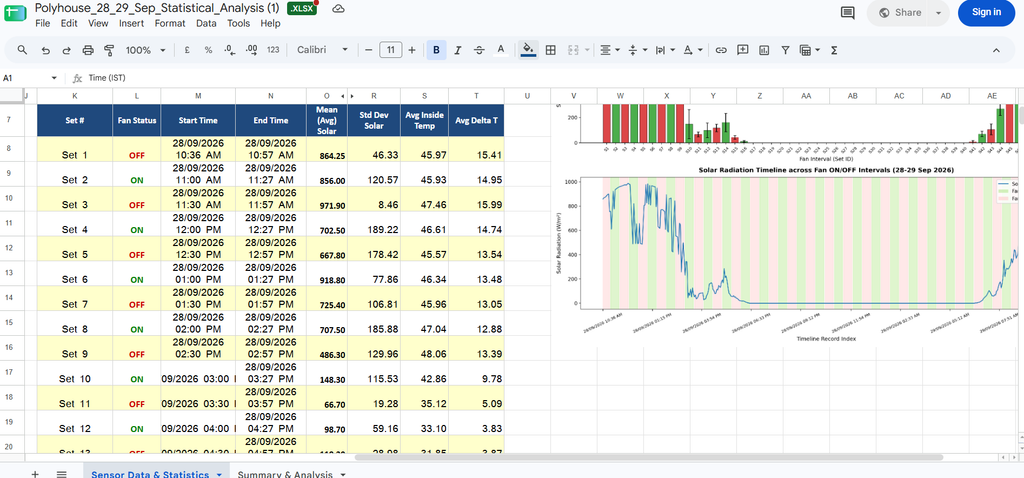
- Visual Tagging: Applied conditional formatting where Fan ON periods were highlighted in Green and Fan OFF periods in Red with Yellow background for rapid visual screening.
Step 3: Statistical Microclimate Calculations
For each continuous operational interval—as well as across the entire dataset—key descriptive statistics were calculated:
- Mean ($\text{Average}$): Evaluated the baseline exposure of solar radiation ($\text{W/m}^2$), inside temperature, outside temperature, and $\Delta T$.
- Standard Deviation ($\text{SD}$): Quantified solar fluctuations and thermal instability during each fan interval.
- Minimum and Maximum ($\text{Min} / \text{Max}$): Captured extreme peak solar irradiance ($\text{up to } \sim 980\text{–}988\text{ W/m}^2$) and night baseline levels.
- Solar Bin Categorization: Segmented into operational regimes such as Low ($<200\text{ W/m}^2$), Medium ($200\text{–}500\text{ W/m}^2$), High ($500\text{–}800\text{ W/m}^2$), and Peak ($>800\text{ W/m}^2$).
Step 4: Graphical Representation & Visual Insights
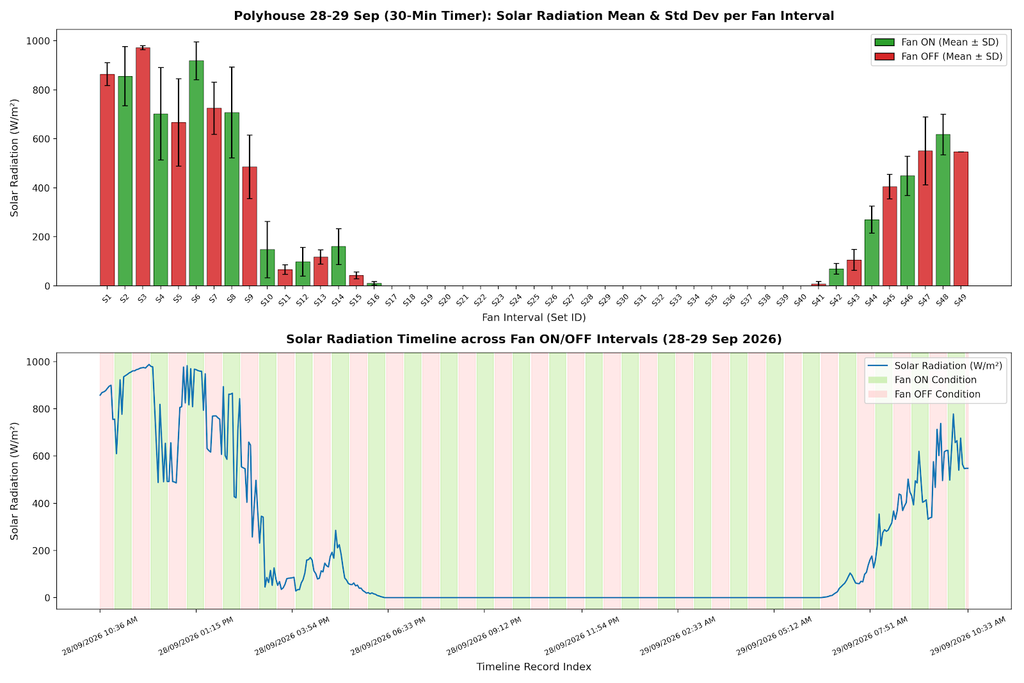
Two primary visualizations were constructed to clearly communicate the physical dynamics:
- Solar Radiation Bar Chart with Error Bars:
- Plotted interval-wise mean solar radiation with Standard Deviation error bars.
- Color-coded bars (Green for Fan ON, Red for Fan OFF) made it easy to compare irradiance levels across alternating fan cycles.
- Timeline Profile Graph with Environmental Shading:
- Plotted a continuous curve of solar radiation over time.
- Used soft green and pink translucent background bands to represent Fan ON and Fan OFF durations, showing diurnal solar peaks alongside fan engagement patterns.
Step 5: Key Findings & Agricultural Insights
- Solar Radiation Drives Thermal Gain: Peak indoor temperatures and $\Delta T$ ($>14\text{–}16^\circ\text{C}$) closely track solar irradiance peaks ($>800\text{ W/m}^2$).
- Cooling Dynamics: During peak daylight, fan activation visibly stabilizes internal temperatures compared to static OFF states.
- Data-Driven Automation: Replacing fixed-timer cycles with dynamic solar-radiation-responsive controls can save fan energy during cloudy periods while preventing heat shocks during peak sun.
follwing data are presented as statistical form-