Introduction
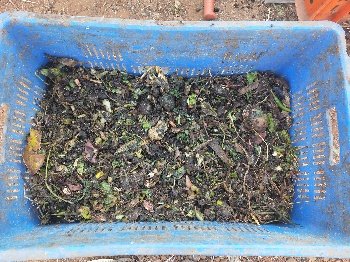
Now a day’s waste management is a crucial problem in society. In which wet waste is inevitable. When the food in trash goes to a landfill, it emits methane, a greenhouse gas that contributes to climate change. Composting is the best way to overcome this problem.
What is composting?
Composting is a natural biological process, carried out under controlled aerobic conditions (requires oxygen). In this process, various microorganisms, including bacteria and fungi, break down organic matter into simpler substances. The effectiveness of the composting process is dependent upon the environmental conditions present within the composting system i.e. oxygen, temperature, moisture, material disturbance, organic matter and the size and activity of microbial populations.
Composting is relatively simple to manage and can be carried out on a wide range of scales in almost any indoor or outdoor environment and in almost any geographic location. It has the potential to manage most of the organic material in the waste stream including restaurant waste, leaves and yard wastes, farm waste, animal manure, animal carcasses, paper products, sewage sludge, wood etc. and can be easily incorporated into any waste management plan.
The essential elements required by the composting microorganisms are carbon, nitrogen, oxygen and moisture. If any of these elements are lacking, or if they are not provided in the proper proportion, the microorganisms will not flourish and will not provide adequate heat. A composting process that operates at optimum performance will convert organic matter into stable compost that is odor and pathogen free, and a poor breeding substrate for flies and other insects. In addition, it will significantly reduce the volume and weight of organic waste as the composting process converts much of the biodegradable component to gaseous carbon dioxide.
The composting process is carried out by three classes of microbes –
• Psychrophiles – low temperature microbes(15- 20 ºC )
• Mesophiles – medium temperature microbes(20-45 ºC )
• Thermophiles – high temperature microbes(41-122 ºC )
Temperature
Temperature is directly proportional to the biological activity within
the composting system. As the metabolic rate of the microbes accelerates, the
temperature within the system increases. Conversely, as the metabolic rate of
the microbes decreases, the system temperature decreases. At a temperature of
155 degrees F, organic matter will decompose about twice as fast as at 130
degrees F. Temperatures above 155 degrees F may result in the
destruction of certain microbe populations. In this case temperature may rapidly
decline. Temperature will slowly rise again as the microbe population
regenerates.
Moisture content
Composting microorganisms thrive in moist conditions. For optimum performance, moisture content within the composting environment should be maintained at 45 percent. Too much water can cause the compost pile to go anaerobic and emit obnoxious odors. Too little will prevent the microorganisms from propagating.
Humidity
It is important to keep humidity around 60% during the early stages of the process, since the organisms responsible for decomposition of the materials require certain water content for its activity.
Benefits of Composting
- Enriches soil, helping retain moisture and suppress plant diseases and pests
- Reduces the need for chemical fertilizers.
- Encourages the production of beneficial bacteria and fungi that break down Organic matter to create humus, a rich nutrient filled material.
- Reduces methane emission from landfills and lowers your carbon foot print.
Problem statement
Compost pile are thoroughly depends on biological culture, water content and air humidity. As the compost pile dries up, microbiological growth slows down.
After mixing in mechanical system compost needs to be piled, we use crates to stack instead of pile for better aeration. To provide controlled atmospheric conditions (Temperature and Humidity) for the compost
Therefore the project aims to find out solution for optimized humidity and temperature requirements for BARC culture.
Objectives:
1. To design tray system of compost
2. To maintain the parameters like temperature, air humidity and moisture content of pile to prevent the drying of compost on one end and anaerobic growth at other end.
To fulfil the above objectives following trials were taken:
Considering above problem the first trial was taken :
Trial 1
1. The two plastic cPrates having dimensions of 50×30×30 cm were taken.
2.One crate was filled with 3 kg culture + 10 kg kitchen waste.

3. Another crate was filled with 7 kg culture + 7 kg waste (1: 1 ratio )
Observations:
| Date | Wt. of crate with 3 kg culture (kg) | Wt. of crate with 7 kg culture (kg) |
| 28/ 01 /2019 | 13.035 | 12.943 |
| 29/01/2019 | 12.296 | 11.366 |
| 30/01/2019 | 10.864 | 10.192 |
| 31/01/2019 | 9.834 | 9.332 |
| 01/02/2019 | 9.184 | 8.684 |
| 02/02/2019 | 8.682 | 8.148 |
| 03/02/2019 | 8.132 | 7.510 |
| 04/02/2019 | 7.314 | 6.496 |
| 05/02/2019 | 7.098 | 6.442 |
LOD Determination :
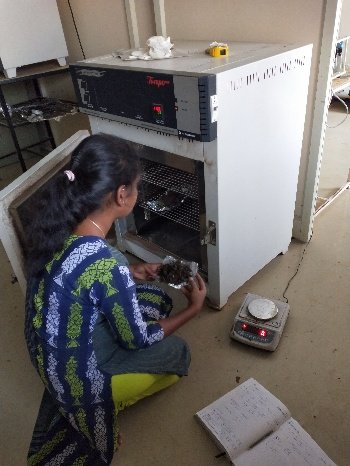
For determination of LOD of compost , compost was kept in oven at 110 ºC. Compost was dried until constant weight was not get .
| Date | Wt. of crate with 3 kg culture | Wt. of crate with 7 kg culture |
| 30/01/2019 | 64 % | 58% |
| 31/01/2019 | 67% | 51% |
| 01/02/2019 | 64.04% | 51.54% |
| 04/02/2019 | 52% | 60% |
| 06/02/2019 | 63.39% | 51.69% |
Results:
1.The reduction in crate with 3 kg culture is 45 %
2. The reduction in crate with 7 kg culture is 50 %
3. The LOD of crate with 3 kg culture is 63.39 %
4. The LOD of crate with 7 kg culture is 51 %
5. The reduction in weight and LOD of both crates were acceptable, but the surface of both crates were get dried.
To overcome this problem insulation was given to crate
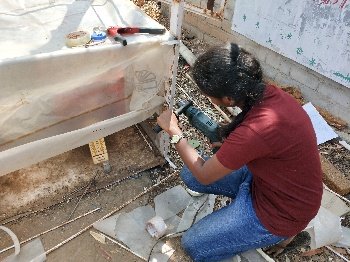
1. First of all the stand for keeping the crates was taken from scrap.
2. The modification in stand was done , the M.S. strips were welded at the bottom portion of stand to hold the weight of crates .

3. For insulation the stand was covered with polythene from the all sides.
4. For insulation the stand was covered with polythene from the all sides.
5. To prevent the heat loss Velcro strips were riveted on the two closing sides of stand.

Trial 2
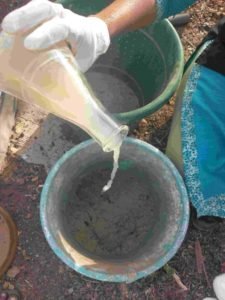
1. Two crates of 50 ×30×30 cm size were taken , filled with 7 Kg waste + 600 g bhusa+ 200 ml liquid broth (Date: 11/02/2019)
Observations (Reduction in weight of crates )
| Date | Weight of crate (O1), kg | Weight of crate (O2), kg |
| 11/02/2019 | 8.044 | 7.614 |
| 13/02/2019 | 6.708 | 6.158 |
| 15/02/2019 | 6.058 | 5.506 |
| 16/02/2019 | 5.522 | 5.03 |
| 19/02/2019 | 4.488 | 3.978 |
| 21/02/2019 | 3.632 | 3.104 |
Results :
i. Reduction in weight of crate (O1) was 44 %
ii. Reduction in weight of crate (O2) was 47 %
2. Two crates filled with (1.5 kg culture + 5 kg waste )
Observations :(Reduction in weight of crate )
| Date | Weight of green crate,(kg) | Weight of orange crate,(kg) |
| 11/02/2018 | 5.584 | 8.572 |
| 13/02/2018 | 4.542 | 7.01 |
| 15/02/2018 | 4.116 | 6.362 |
| 16/02/2018 | 3.798 | 5.996 |
Temperature and Relative Humidity Observations :
| Date | Time | Inside temperature | RH % | Outside temperature | RH % | ||
| D.B | W.B | D.B | W.B | ||||
| 12/02/2019 | 11:30 | 32 | 24 | 50 | 30 | 23 | 53 |
| 12:30 | 34 | 26 | 51 | 32 | 23 | 44 | |
| 1:30 | 36 | 26 | 43 | 33 | 24 | 45 | |
| 2:30 | 36 | 26 | 43 | 33 | 23 | 40 | |
| 3:30 | 34 | 25 | 46 | 34 | 23 | 37 | |
| 4:30 | 33 | 25 | 50 | 32 | 22 | 39 | |
| 5:30 | 30 | 24 | 59 | 30 | 21 | 42 |
| Date | Time | Inside temperature | RH % | Outside Temperature | RH % | ||
| Dry bulb | Wet Bulb | Dry bulb | Wet bulb | ||||
| 13/02/2019 | 11:30 | 34 | 23 | 37 | 33 | 22 | 35 |
| 12:30 | 34 | 25 | 46 | 32 | 22 | 39 | |
| 1:30 | 35 | 27 | 52 | 34 | 23 | 49 | |
| 2:30 | 33 | 23 | 40 | 35 | 23 | 33 | |
| 3:30 | 32 | 25 | 55 | 33 | 21 | 31 | |
| 4:30 | 31 | 25 | 60 | 31 | 19 | 28 | |
| 5:30 | 29 | 24 | 65 | 30 | 19 | 32 |
| Date | Time | Inside temperature | RH % | Outside Temperature | RH % | ||
| D.B | W.B | D.B | W.B | ||||
| 14/02/2019 | 11:30 | 34 | 25 | 46 | 31 | 20 | 33 |
| 12:30 | 38 | 24 | 28 | 32 | 20 | 29 | |
| 1:30 | 36 | 26 | 43 | 33 | 21 | 31 | |
| 2:30 | 36 | 30 | 63 | 33 | 21 | 31 | |
| 3:30 | 34 | 27 | 57 | 32 | 20 | 29 | |
| 4:30 | 33 | 26 | 56 | 33 | 20 | 26 | |
| 5:30 | 32 | 26 | 61 | 30 | 19 | 32 |
| Date | Time | Inside temperature | RH % | Outside Temperature | RH % | ||
| D.B | W.B | D.B | W.B | ||||
| 15/02/2019 | 11:30 | 34 | 29 | 68 | 31 | 20 | 33 |
| 12:30 | 37 | 28 | 49 | 31 | 20 | 33 | |
| 1:30 | 35 | 26 | 47 | 32 | 19 | 25 | |
| 2:30 | 33 | 24 | 45 | 32 | 19 | 25 | |
| 3:30 | 32 | 24 | 50 | 32 | 19 | 25 | |
| 4:30 | 29 | 22 | 52 | 30 | 18 | 27 | |
| 5:30 | 27 | 21 | 57 | 28 | 17 | 29 |
| Date | Time | Inside temperature | RH % | Outside Temperature | RH % | ||
| D.B | W.B | D.B | W.B | ||||
| 16/02/2019 | 11:30 | 35 | 26 | 47 | 31 | 19 | 28 |
| 12:30 | 35 | 25 | 42 | 33 | 18 | 18 | |
| 1:30 | 33 | 25 | 50 | 32 | 18 | 20 | |
| 2:30 | 32 | 23 | 44 | 32 | 18 | 20 | |
| 3:30 | 29 | 20 | 41 | 32 | 17 | 16 | |
| 4:30 | 27 | 20 | 50 | 30 | 16 | 17 | |
| 5:30 | 25 | 19 | 55 | 28 | 16 | 23 |
| Date | Time | Inside temperature | RH % | Outside Temperature | RH % | ||
| D.B | W.B | D.B | W.B | ||||
| 17/02/2019 | 11:30 | 34 | 28 | 62 | 29 | 18 | 30 |
| 12:30 | 37 | 28 | 49 | 29 | 17 | 11 | |
| 1:30 | 34 | 26 | 51 | 32 | 20 | 29 | |
| 2:30 | 34 | 25 | 46 | 32 | 18 | 20 | |
| 3:30 | 31 | 24 | 54 | 32 | 19 | 25 | |
| 4:30 | 30 | 23 | 53 | 30 | 17 | 22 | |
| 5:30 | 29 | 22 | 52 | 29 | 17 | 25 |
| Date | Time | Inside temperature | RH % | Outside Temperature | RH % | ||
| D.B | W.B | D.B | W.B | ||||
| 19/02/2019 | 11:30 | 37 | 29 | 54 | 34 | 21 | 28 |
| 12:30 | 38 | 28 | 45 | 35 | 21 | 25 | |
| 1:30 | 38 | 26 | 36 | 36 | 21 | 22 | |
| 2:30 | 36 | 27 | 48 | 36 | 21 | 22 | |
| 3:30 | 34 | 25 | 46 | 35 | 20 | 21 | |
| 4:30 | 33 | 24 | 45 | 35 | 20 | 21 | |
| 5:30 | 31 | 18 | 23 | 33 | 19 | 22 |
| Date | Time | Inside temperature | RH % | Outside Temperature | RH % | ||
| D.B | W.B | D.B | W.B | ||||
| 20/02/2019 | 11:30 | 40 | 30 | 47 | 34 | 22 | 32 |
| 12:30 | 43 | 31 | 41 | 35 | 23 | 33 | |
| 1:30 | 39 | 23 | 22 | 37 | 23 | 27 | |
| 2:30 | 37 | 25 | 35 | 37 | 22 | 23 | |
| 3:30 | 36 | 26 | 43 | 37 | 22 | 23 | |
| 4:30 | 34 | 24 | 17 | 35 | 22 | 29 | |
| 5:30 | 32 | 24 | 50 | 33 | 21 | 31 |


Results:
- Reduction in weight of crate green crate was 32%
- Reduction in weight of crate orange crate was 30%
- The kitchen waste was cut in chaff cutter, because of large size it did not compost well.
Conclusions:
- We closed the system to maintain the temperature and humidity, but due to insulation water vapour got locked, amount of CO2 increases.
- Due to rise in temperature bacterial growth stops and reduction of crate got reduced.
We conclude that the culture which was used is act to mesophillic stage
Trial 3
- One crate was kept inside the insulation ( 10 kg culture+ 3 kg waste + 1 kg bhusa )
- Another crate was kept outside the insulation ( 10 kg culture+ 3 kg waste + 1 kg bhusa )
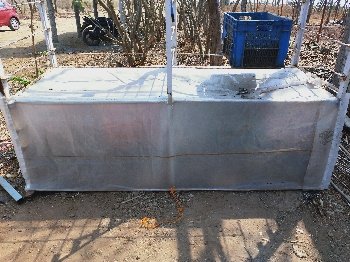
Observations(Reduction in weight of crates )
| Date | Weight of green crate , Kg(Inside) | Weight of blue crate, Kg (Outside) |
| 17/02/2019 | 13.634 | 13.322 |
| 19/02/2019 | 10.052 | 11.056 |
| 20/02/2019 | 8.602 | 10.122 |
| 21/02/2019 | 7.846 | 8.6 |
| 24/02/2019 | 5.356 | 7.744 |
Results :
1.Reduction in weight of inside crate (60 %)
2. Reduction in weight of outside crate (41 %)
3. On 4th day when inside temperature reached upto 43 ºC leachate came from inside tray.
4. Reduction in outside crate is more as compared to inside tray.
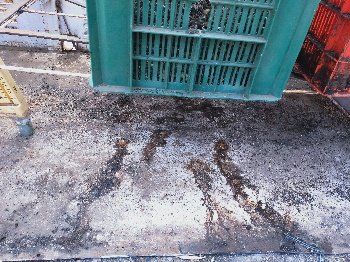
Conclusion:
- Higher temperature resulted change in bacterial culture leading to leachate from crate.
- The foul smell clearly indicated anaerobic culture.
- We conclude that not aeration is necessary, but also there is need to prevent the evaporation loss. So the next trial was taken.
Trial 4

- 3 crates were filled with 2.5 kg culture +5 kg waste (23/02/2019)
- Top crate was covered with green shade net to prevent evaporation.
- Another crate was filled with 2.5 kg waste + 1.2 kg culture (26/02/2018)
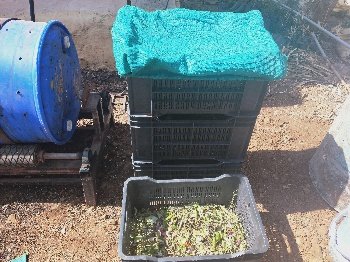
Observations:
| Date | Weight of crate (W1),Kg | Weight of crate (W2),Kg | Weight of crate (W3),Kg |
| 23/02/2019 | 7.562 | 7.622 | 7.596 |
| 2/03/2019 | 2.959 | 3.536 | 3.586 |
Results:
- Reduction in weight of crate of W1 is 60 %
- Reduction in weight of crate of W2 is 53 %
- Reduction in weight of crate of W3 is 52 %
- Reduction in weight of crate which one at the top was more as compared to other two crates which were at the bottom.
- The compost in all three crates till dried due to evaporation even first crate covering with green shade net.
Conclusion :
- It was conclude that compost get dried due to direct contact of sunlight
- Green shade net is not enough protection to prevent the evaporation.
- We had dome which has sprinklers installed where we had higher RH and temperature, so we conclude to take the next trial in dome.

The next trial was taken to prevent the evaporation .
Trial: 5
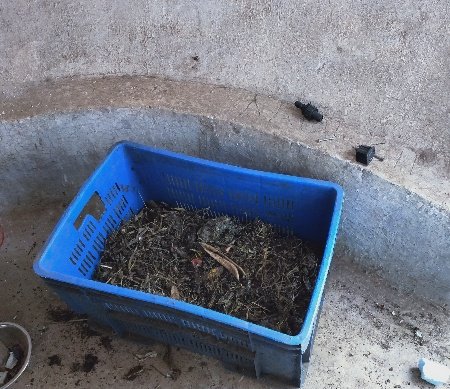
- First the tray was kept in dome to avoid the direct contact with sunlight to overcome the problem of evaporation .
- The tray was filled with 6 kg waste + 3 kg culture.
Temperature observations :
| Date | Time | Dry bulb temp. ( ºC ) | Wet bulb temp. ( ºC ) | Relative Humidity (%) |
| 06/03/2019 | 10:30 | 22 | 17 | 59 |
| 11:30 | 23 | 18 | 60 | |
| 12:30 | 24 | 18 | 53 | |
| 2:30 | 24 | 18 | 53 | |
| 3:30 | 29 | 21 | 46 | |
| 4:30 | 29 | 21 | 46 | |
| 5:30 | 27 | 20 | 50 |
| Date | Time | Dry bulb temp. ( ºC ) | Wet bulb temp. ( ºC ) | Relative Humidity (%) |
| 08/03/2019 | 11:30 | 25 | 18 | 48 |
| 1:30 | 29 | 21 | 46 | |
| 2:30 | 30 | 22 | 48 | |
| 3:30 | 31 | 23 | 49 | |
| 5:30 | 30 | 22 | 48 |
| Date | Time | Dry bulb temp. ( ºC ) | Wet bulb temp. ( ºC ) | Relative Humidity (%) |
| 09/03/2019 | 10:30 | 25 | 18 | 48 |
| 11:30 | 27 | 19 | 44 | |
| 12:30 | 29 | 20 | 41 | |
| 1:30 | 31 | 22 | 43 | |
| 2:30 | 32 | 23 | 44 | |
| 3:30 | 33 | 24 | 45 | |
| 5:30 | 32 | 23 | 43 |
| Date | Time | Dry bulb temp ( ºC ) | Wet bulb temp( ºC ) | Relative Humidity(%) |
| 12/03/2019 | 10:30 | 26 | 18 | 43 |
| 11:30 | 27 | 19 | 44 | |
| 1:30 | 29 | 21 | 46 | |
| 2:30 | 33 | 26 | 56 | |
| 5:30 | 32 | 22 | 39 |
Observations(Reduction in weight of crate )
| Date | Weight of crate (Kg) |
| 05/03/2019 | 9.184 |
| 06/03/2019 | 8.112 |
| 10/03/2019 | 4.874 |
| 12/03/2019 | 4.156 |
Results
- Reduction in weight of crate was 54 %
- Maximum temp inside dome reached up to 33 ºC and humidity was 60 %
- Fungus was detected on 3rd day in compost.
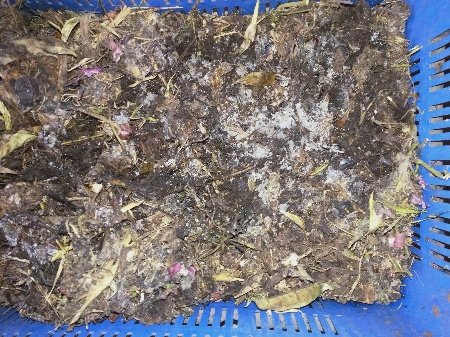
Conclusion :
- There was another reason for better decomposing is lower particle size of garbage in this trial as compared to trial 4
- Temperature and relative humidity is maintained inside the dome, but dome needs a special structure and we thought of a system which can be built with common available material.
Trial 6:
To maintain the humidity and temperature the tray system was covered with gunny bags to protect from sunlight .
1. To maintain the humidity and temperature the tray system was covered with gunny bags to protect from sunlight.
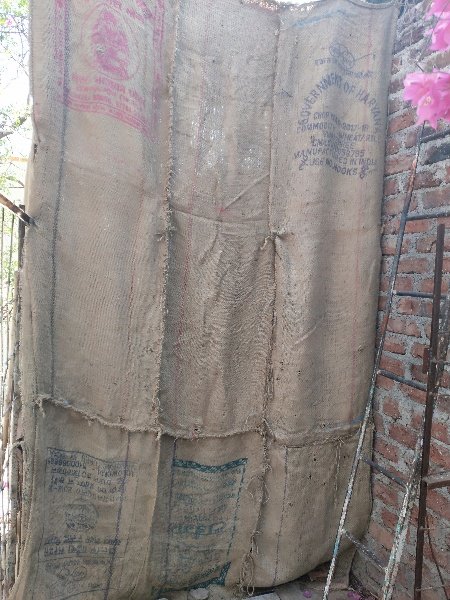
2. The rack was kept inside the gunny bag cover and two trays were kept inside the cover.
3. Two crates were filled with (7 kg waste + 3.5 kg culture)

To maintain the temperature and humidity inside the covering , gunny bags wetted with water from outside by using knapsack sprayer
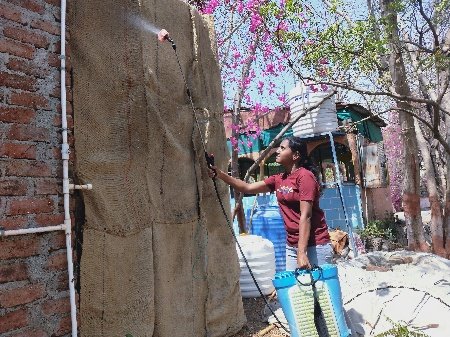
To minimize the efforts with knapsack sprayer sprinkler system was given inside the gunny bag cover.
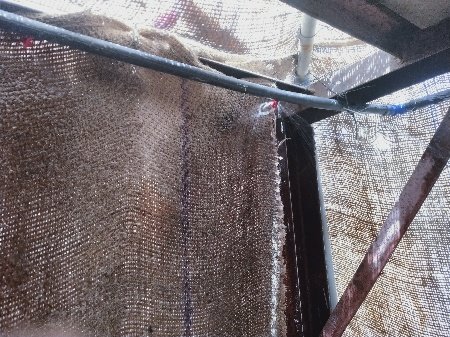
Temperature observations:
| Date | Time | Inside Temp. ºC | Inside RH % | Outside Temp. ºC | Outside RH % |
| 25/03/2019 | 11.30 | 36 | 39 | 37 | 39 |
| 12:30 | 39 | 33 | 39 | 33 | |
| 4:30 | 36 | 34 | 36 | 34 |
| Date | Time | Inside Temp. ºC | Inside RH % | Outside Temp. ºC | Outside RH % |
| 26/03/2019 | 10:30 | 33 | 35 | 35 | 25 |
| 11:30 | 25 | 61 | 36 | 30 | |
| 1:30 | 38 | 24 | 40 | 23 | |
| 2:30 | 27 | 77 | 41 | 21 | |
| 4:30 | 32 | 39 | 38 | 25 | |
| 5:30 | 35 | 33 | 36 | 26 |
| Date | Time | Inside Temp. ºC | Inside RH % | Outside Temp. ºC | Outside RH % |
| 27/03/2019 | 10:30 | 34 | 32 | 34 | 32 |
| 11:30 | 26 | 56 | 39 | 26 | |
| 1:30 | 30 | 59 | 42 | 26 | |
| 2:30 | 40 | 23 | 42 | 19 | |
| 3:30 | 23 | 91 | 40 | 20 | |
| 5:30 | 35 | 25 | 38 | 21 |


Observations (Reduction in weight of crate)
| Date | Weight of crate (w1),kg | Weight of crate (w2),kg |
| 24/03/2019 | 10.48 | 10.77 |
| 27/03/2019 | 8.052 | 8.254 |
| 29/03/2019 | 7.142 | 7.412 |
| 31/03/2019 | 6.962 | 6.784 |
Results:
1. Reduction in weight of crate (w1) was 33.56 %
2. Reduction in weight of crate (w2) was 37.01 %

3. Reduction in weight of crate is less as compared to previous trial, but obtained compost was good in condition.
4. At the bottom of tray water was remaining in compost and compost was sticky.
5.To remove the water from compost , it sprade in thin layer .
| Weight of compost before spreading ,kg | Weight of compost after spreading, kg |
| 12 | 4.04 |
After 3 days reduction in weight of compost was 66%
Trial 7
- The next trial was taken in same system
2. Two crates were filled with 10 kg culture + 5 kg waste.

3. Gunny bags were wetted by spraying water.
Temperature and Relative humidity observations:
| Date | Time | Inside Temp. ºC | Inside RH % | Outside Temp. ºC | Outside RH % |
| 02/04/2019 | 10:30 | 34 | 34 | 34 | 27 |
| 11:30 | 27 | 27 | 27 | 23 | |
| 12:30 | 33 | 33 | 33 | 25 | |
| 2:30 | 40 | 40 | 40 | 18 | |
| 3:30 | 30 | 30 | 30 | 22 | |
| 4:30 | 38 | 38 | 38 | 20 |
| Date | Time | Inside Temp. ºC | Inside RH % | Outside Temp. ºC | Outside RH % |
| 04/04/2019 | 10:30 | 35 | 47 | 39 | 22 |
| 11:30 | 37 | 35 | 39 | 26 | |
| 12:30 | 38 | 28 | 37 | 27 | |
| 2:30 | 40 | 23 | 39 | 22 | |
| 3:30 | 41 | 25 | 37 | 27 | |
| 5:30 | 36 | 30 | 36 | 30 |
| Date | Time | Inside Temp. ºC | Inside RH % | Outside Temp. ºC | Outside RH % |
| 05/04/2019 | 10:30 | 34 | 34 | 41 | 25 |
| 11:30 | 35 | 35 | 33 | 26 | |
| 12:30 | 29 | 29 | 46 | 27 | |
| 2:30 | 39 | 39 | 30 | 22 | |
| 3:30 | 39 | 39 | 26 | 27 | |
| 4:30 | 34 | 34 | 37 | 30 |


Observations (Reduction in weight of crates)
| Date | Weight of crate (w1),kg | Weight of crate (w2), kg |
| 31/03/2019 | 14.760 | 15.150 |
| 04/04/2019 | 11.046 | 11.826 |
| 09/04/2019 | 8.044 | 7.910 |
Result:
1. Reduction in weight of crate (w1) was 45 %
2. Reduction in weight of crate (w2) was 47 %

Conclusion:
- From trial 6 and 7 we learned that, mixing of compost on 3 or 5th day is necessary
- Mixing is a laborious process hence easier option of reverting of crates was thought.
- Existing crate could not revert; it has five sides hence we decided to fabricate new crates.
For that following calculations were done


Trial 8
Methodology for sphere
1. First the segment was design in solid works software
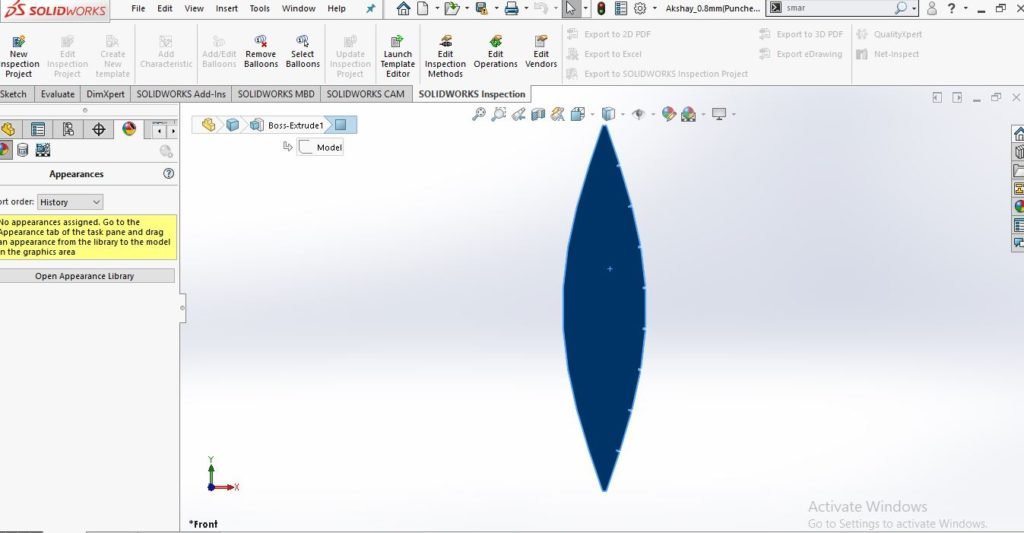
2. Then 10 segments were cut with the help of plasma cutter
3. These segments were joint by riveting to each other
4. The lead for sphere made from GI sheet and attached to the sphere with hinges

5. Sphere was painted to avoid corrosion
6. Sphere was filled with 9 kg waste +4.5 kg culture
Conclusion:
1. For minimum surface area sphere has maximum volume but it is not feasible for reverting.
2. Fabrication of sphere is also difficult.


