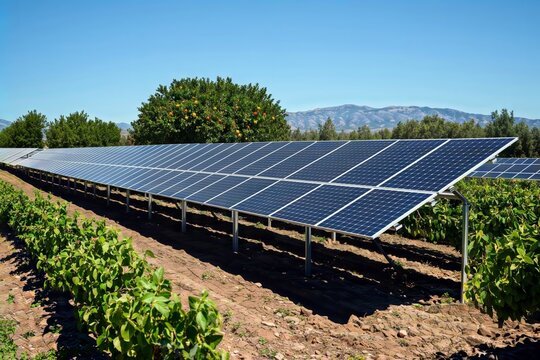
Agrivoltaics is the practice of using the same land for both farming and solar power generation. It’s also known as dual-use solar or agrisolar.
Benefits
1. Diversified income: Farmers can earn money from both agriculture and solar power.
2. Reduced carbon footprint: Solar power reduces reliance on fossil fuels.
3. Energy resilience: Solar power provides an alternative. energy source.
4. Ecological benefits: Solar panels can help cool crops and reduce water evaporation.
5. Reduced land use competition: Solar panels can be integrated into existing agricultural practices.
Types of agrivoltaic systems
1. Elevated: Solar panels are placed above vegetation.
2. Inter-row: Vegetation is grown between rows of solar panels.
Applications
Crop cultivation, Livestock grazing, Aquaculture, Greenhouses, and Tea plantations.
Examples
• China has had over 500 agrivoltaic projects since 2011
. In India, start-ups like SunSeed Pvt. Ltd. are working on agrivoltaics projects.
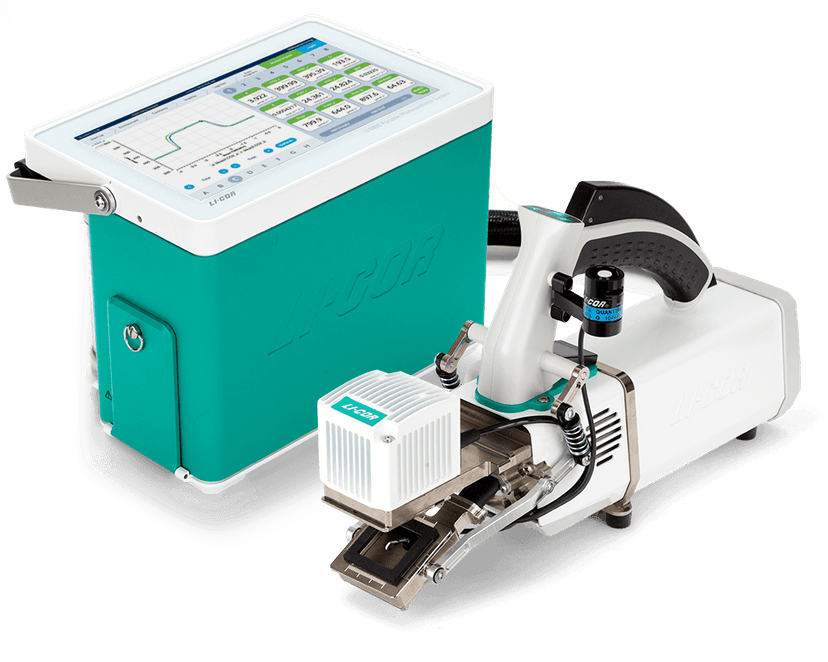
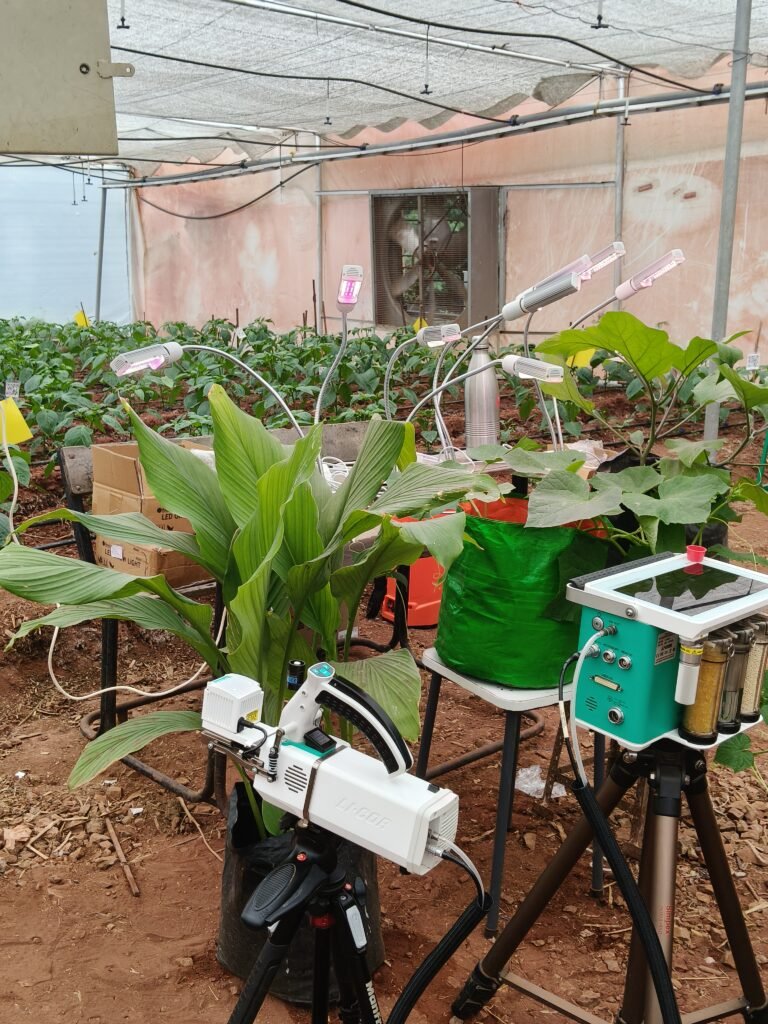
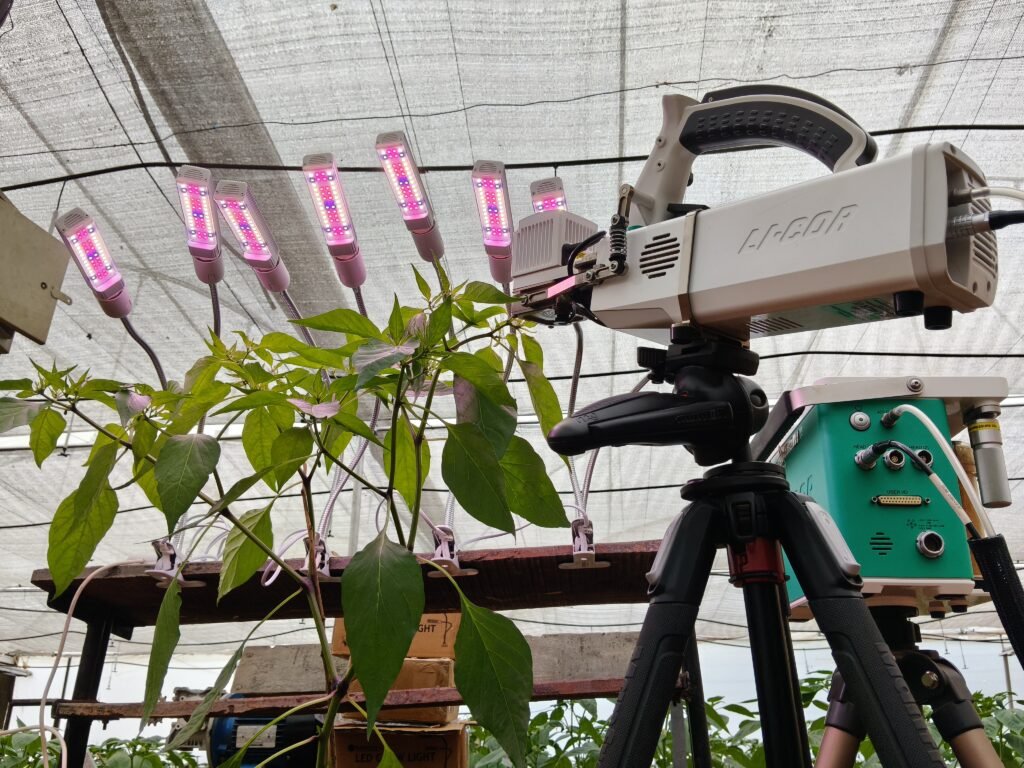
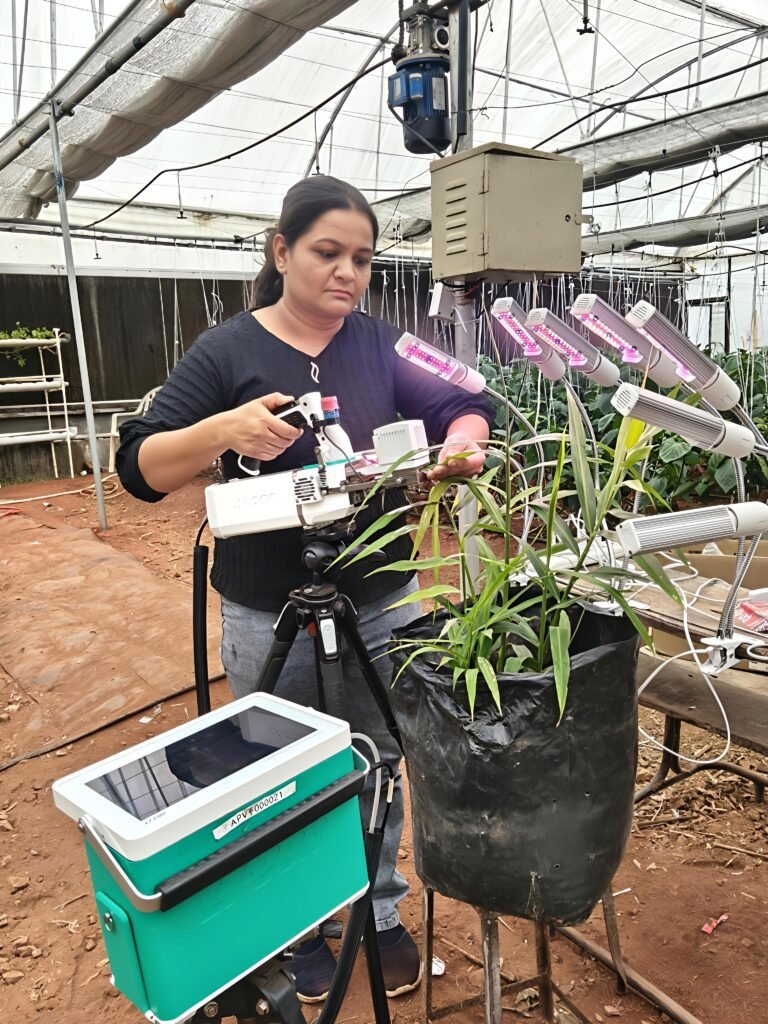
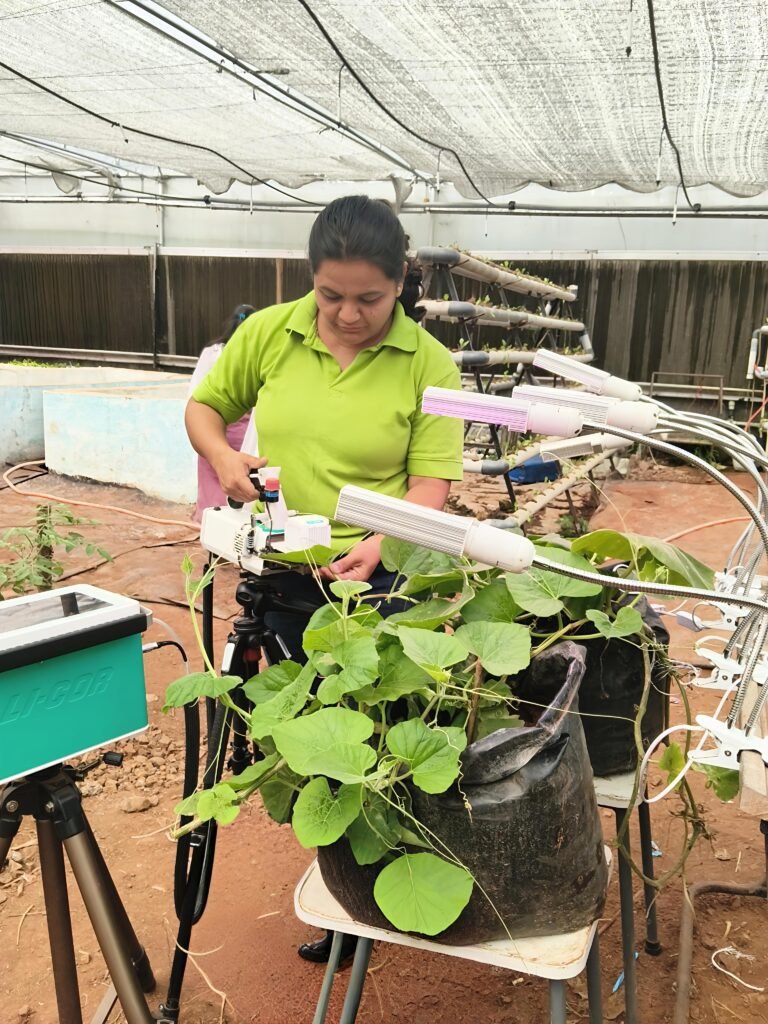
Introduction To LI-COR 6800 Portable Photosynthesis System
INTRODUCTION:
•The LI-COR 6800 is a instrument used to measure gas exchange in plants.
• It is a Infrared Gas Analyzers (IRGA)which give accurate measure of CO2 and H2O conc. in leaf gas exchange.
• The LI-COR 6800 provides complete, real-time information about both the light reactions and the carbon reaction of Photosynthesis.
• The instrument measures uptake of carbon dioxide (CO2) and release of water vapor (H2O) by the leaf with high precision infrared gas analyzers.
The gas exchange system
• The LI-6800 is an open gas exchange system, which means that the measurements of photosynthesis and transpiration are based on the differences in CO2 and H2O in an air stream that is entering and exiting the leaf.
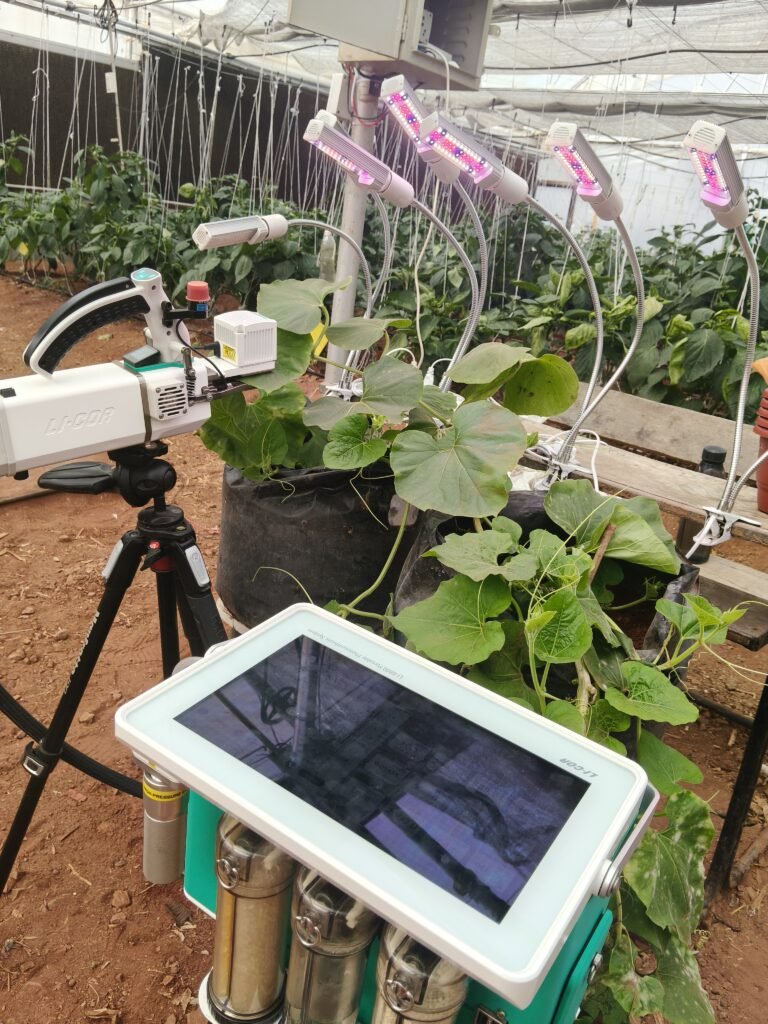
1.CONSOLE:
The console provides the operating system, interface, air conditioning, and data logging.1.power button 2.head and fluorometer cable connectors 3.air supply to head connector 4.power cable connector.

The back of the console has :

1. Auxiliary Air Inlet
2. Air Inlet and filter cover
3. USB ports
4. Ethernet port
5. CO2 cartridge Holder
6. Desiccant H2O(The desiccant column holds Sorbead® . The desiccant removes water vapor from the air)
7. Humidifier H2O scrub
8. Soda Lime CO2 scrub
9. USB Host Port
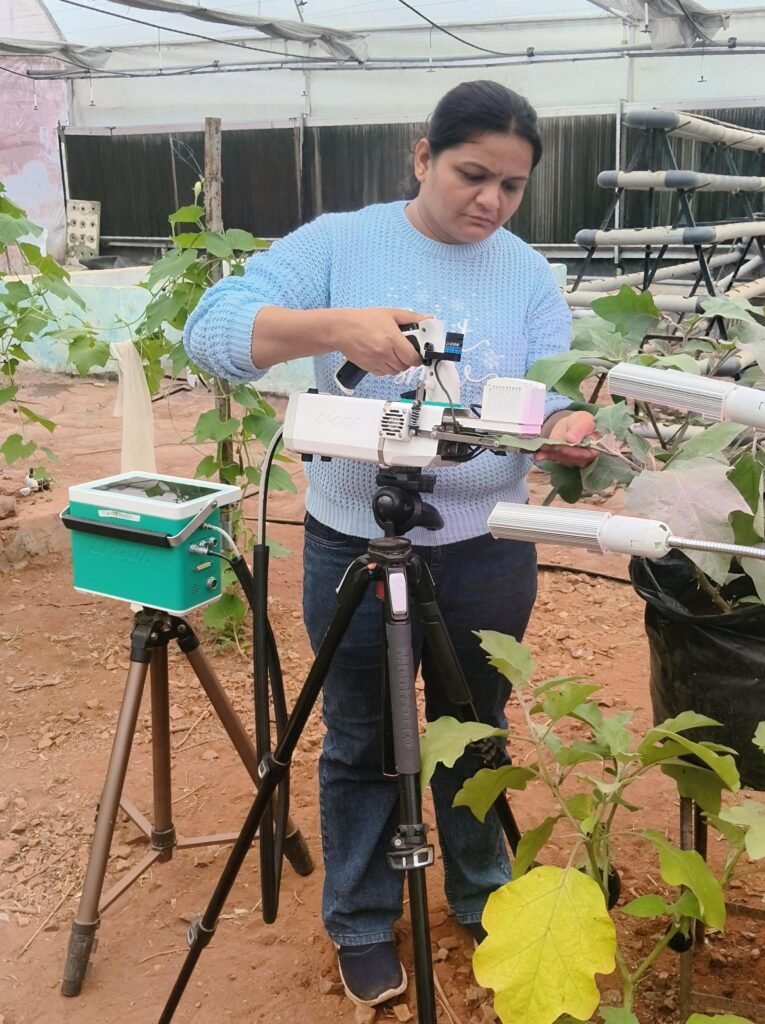
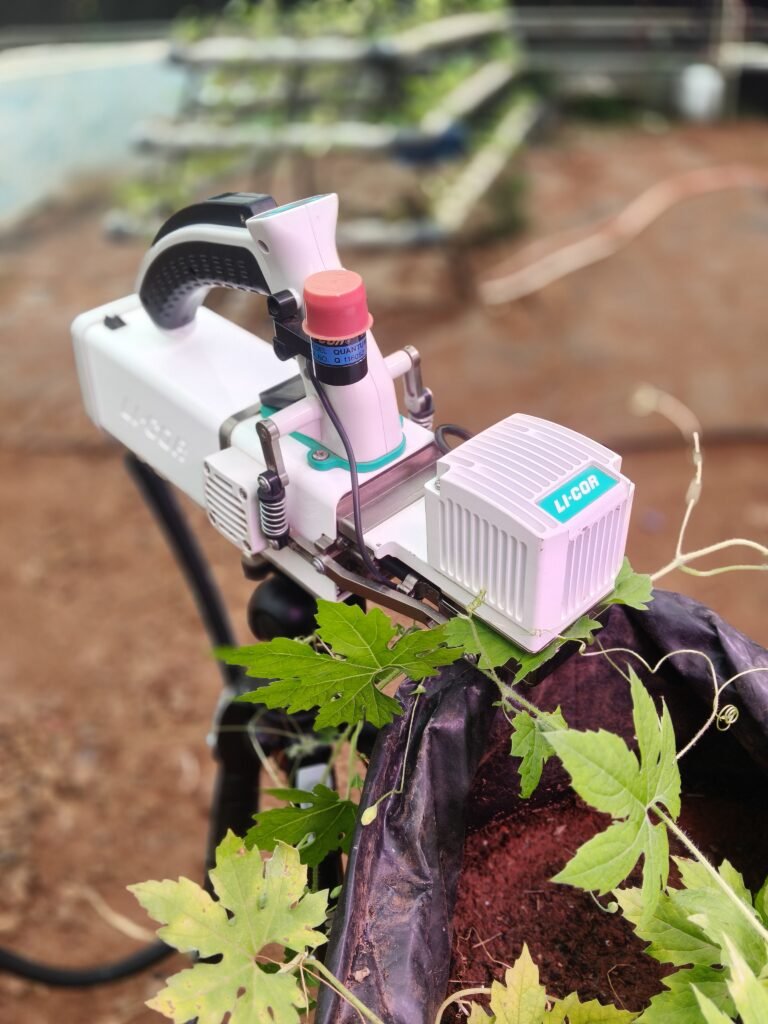
Sensor head
LI-6800 The sensor head includes the sample and reference gas analyzers, flow meters, a spring-loaded latching mechanism, a Peltier thermoelectric cooler, and a system ofvalves. A leaf chamber and optional light source connect to the head. The chambers feature independently-articulated hinges to help form a good seal around unevenly-shaped leaves.

Chambers also have three positions
1. Open: The lower chamber is all the way open, ready to accept a leaf.
2. Parked: The first stop on the way to closed. Squeeze the handle until it clicks,then release. This is to adjust the position of a leaf before clamping down on it.Store and ship the head with the chamber in this position.
3. Closed: This is the position for making measurements. Squeeze the handle firmly and then release it. The chamber will close, compressing the gaskets.
To measure photosynthesis using the LI-COR 6800
IRGA, you need to provide five key environmental parameters that affect gas exchange measurements.
1. CO₂ Concentration (ppm)
• Specifies the level of carbon dioxide available for photosynthesis.
• Common setting: 400 ppm (ambient) or controlled levels (e.g., 200–1000 ppm for response curves).
2. Light Intensity (µmol m⁻² s⁻¹)
• Determines the amount of light reaching the leaf.
• Common setting: 1000–2000 µmol m⁻² s⁻¹ for saturating photosynthesis or lower for light response curves.
3. Leaf Temperature (°C)
• Maintains the desired leaf temperature for accurate physiological responses.
• Common setting: 25°C (standard) but adjustable based on environmental studies.
4. Relative Humidity (%) or Vapor Pressure Deficit (VPD)
• Controls stomatal behavior and transpiration.• Common setting: 50–70% RH or VPD of 1–2 kPa for normal conditions.
5. Flow Rate (mol s⁻¹)
• Regulates the airflow through the leaf chamber to ensure proper gas exchange.
What data we get from machineFrom photosynthesis machine we get three curves as follows:
1. ACI curve (photosynthesis vs conc. CO2 in leaf)
2. AQI curve (photosynthesis vs light)
3. VPD (vapour pressure deficit) OR stomatal conductance
What those curves indicates ?
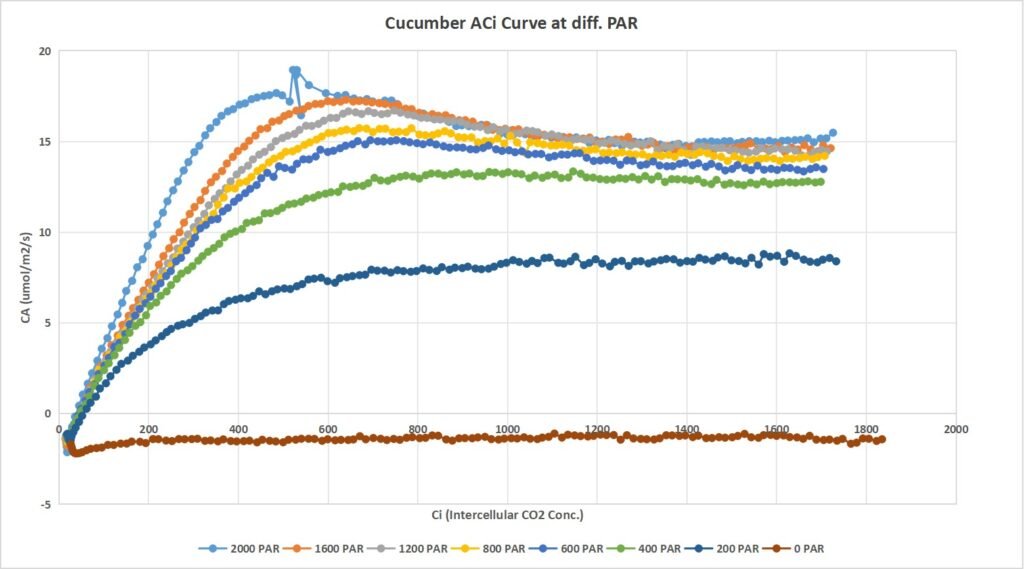
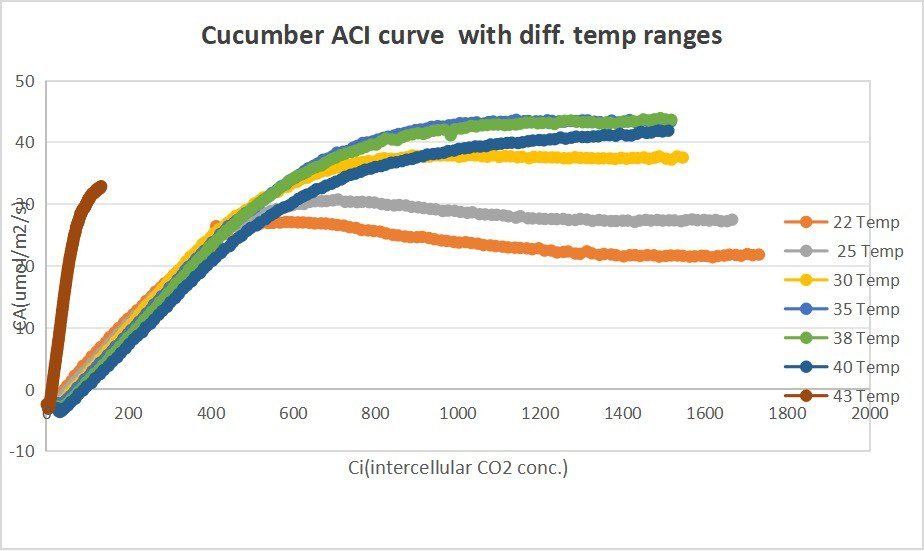
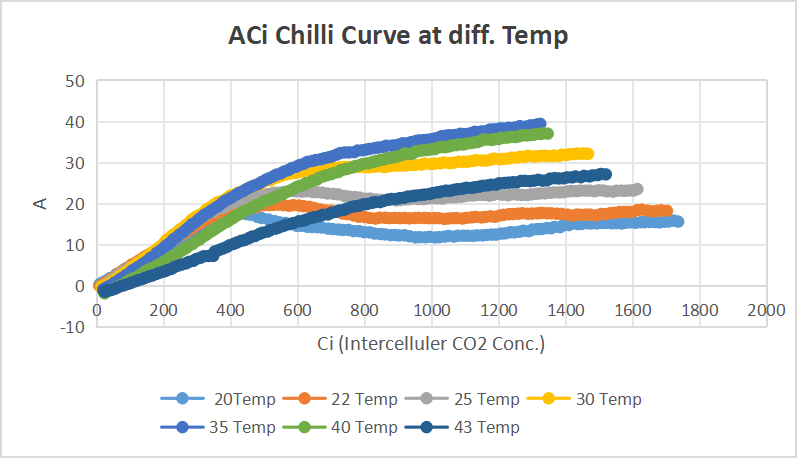
1. ACI curve
The A-Ci curve represents the relationship between net photosynthesis (A, µmol CO₂ m⁻² s⁻¹) and intercellular CO₂ concentration (Ci, ppm).
What It Shows:
• This curve demonstrates how net photosynthesis (A) changes as the internal leaf CO₂ concentration (Ci) increases.
• At low Ci values, photosynthesis is limited by Rubisco activity (enzyme-limited phase).
• As Ci increases, photosynthesis also increases until it reaches a saturation point. Beyond this point, additional CO₂ does not significantly boost photosynthesis.
• The saturation phase indicates that the regeneration of RuBP (Ribulose-1,5-bisphosphate) becomes the limiting factor instead of Rubisco.Key points :
• A steep initial increase at low Ci suggests that Rubisco is efficiently fixing CO₂.
• The plateau at higher Ci values shows that photosynthesis becomes limited by other factors (e.g., RuBP regeneration or electron transport rate).
• This curve helps estimate (maximum carboxylation rate) and (maximum electron transport rate), which are crucial for photosynthetic efficiency.
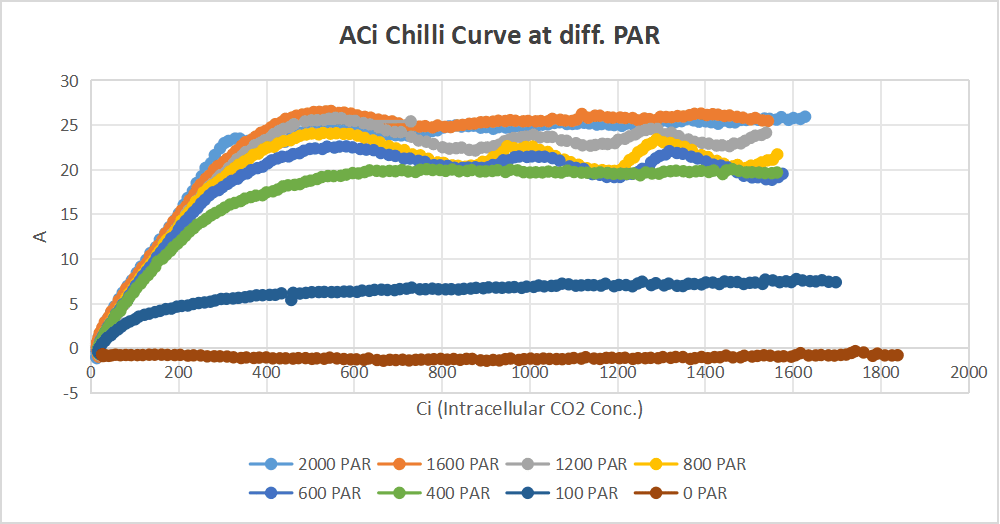
2. AQI Curve
The A-Ci curve represents the relationship between photosynthesis verses light
What It Shows
• This graph illustrates how photosynthesis (A) responds to varying light intensities (PAR, Photosynthetically Active Radiation).
• At low PAR, photosynthesis increases linearly because the process is light-limited (light is the main energy source for carbon fixation).
• As PAR increases, photosynthesis starts to slow down because other factors (such as CO₂ availability or enzyme capacity) become limiting.
• Eventually, photosynthesis reaches a maximum rate (Amax), meaning additional light does not increase photosynthesis further.
Key points:
• The Light Compensation Point (LCP) is where photosynthesis equals respiration, meaning net CO₂ uptake is zero.
• The Light Saturation Point (LSP) is where adding more light no longer increases photosynthesis.
• This curve helps determine the efficiency of light use (quantum yield, Φ) and the light saturation level of a plant
3. VPD OR Stomatal conductanceWhat It Shows:
What It Shows:
• This graph explains how stomatal conductance (gs) changes in response to increasing Vapor Pressure Deficit (VPD).
• VPD represents the difference between leaf water vapor pressure and air water vapor pressure higher VPD means drier air.
• As VPD increases, gs decreases, meaning the plant closes stomata to prevent excessive water loss.
• Lower gs reduces CO₂ uptake, which can limit photosynthesis at high VPD levels.
Why we are doing this ?
• We are using LI-COR 6800 Photosynthesis system to collect ACI, AQI and VPD readings.
• These measurements are crucial for understanding how plants respond to varying CO2 concentrations, light intensities, and vapor pressure deficits. By analyzing these parameters, we can gain insights to plant behavior and photosynthetic performance under different environmental conditions.
Specifically:
• ACI data will inform the optimal CO2 concentration for the plant allowing to adjust CO2 supplementation accordingly.
• By analyzing AQ data the light saturation point can be determined where photosynthesis reaches its maximum rate. It informs photosynthetic efficiency i.e how effectively plant uses light energy.
• VPD data will guide the optimization of the poly-house humidity and temperature control system, ensuring that the plant experiences optimal water stress and transpiration conditions.
Using HELIOS Software plant model will be created by inputting plant architecture measurements and photosynthesis data. This model will unable to simulate or predict how plant will behave in terms of photosynthesis, allowing us to optimize growing conditions and improve crop productivity.
Outcomes
This project aims to provide insights for optimizing agri-voltaic system design .
Key outcomes includes:
1. Optimal solar panel height:
Determining the ideal height for solar panels to maximize energy production while minimizing shading effects on crops.
2. Crop spacing : Identifying the optimal spacing between crops to ensure adequate sunlight penetration, promote healthy growth.
3. Crop selection and layout: Informing the selection of suitable crop species and layouts to maximize interaction between agriculture and photovoltaic energy production.
25 February – 28 February 2025
1. On 25 Feb I visited Vigyan Ashram campus to meet Mr. Ranjeet sir he explained the project regarding agrivoltaic.
2. This project allotted to Tejaswini with her I join this project further,
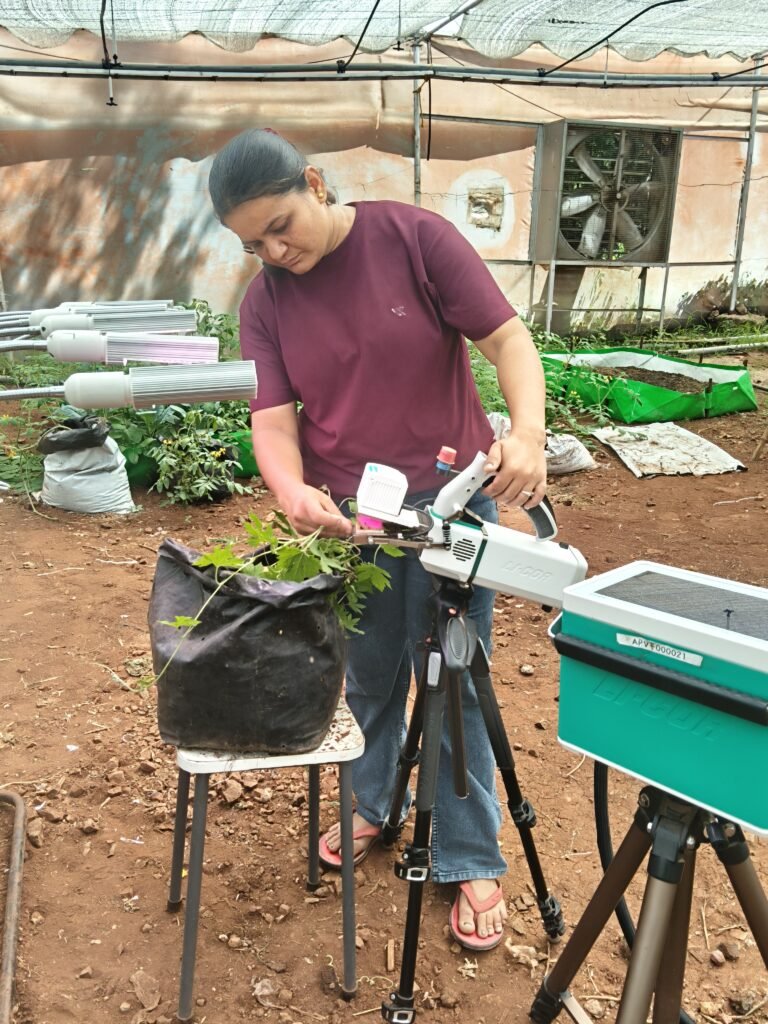
3. On 26 Feb Tejaswini explained and give me training of operating the LI -COR 6800 Photosynthesis instrument.
4. Tejaswini give me training how to handle instrument.
How to measure leaf area. Console setting,log setup,environment parameters.)

1 March – 3 March 2025
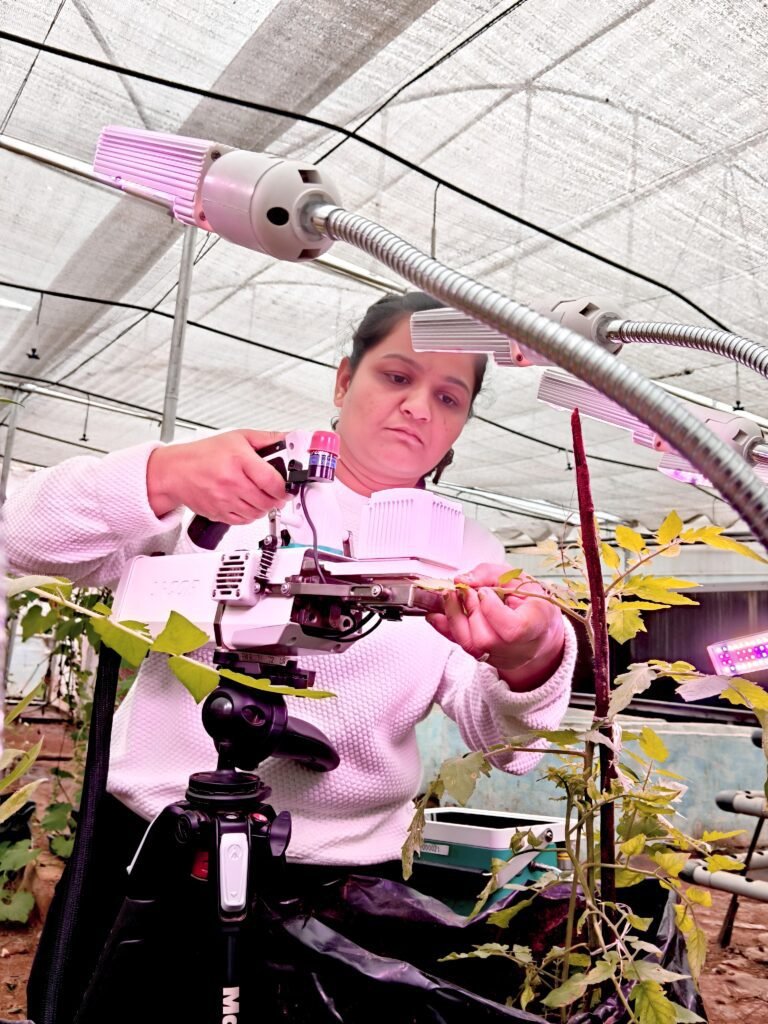
- With Tejaswini we started photosynthetic rate measurements of ACi,AQi and VPD curve.
- Recently Tejaswini completed strawberry, cucumber, turmeric, fenugreek Rose.
- Total 30 curve collect from single crop.

5 March 2025
On 5 March, first meeting with Nimish sir visited to our campus to discuss about project and tell next work on project .
In meeting Nimish sir discussed with us fundamental of these project IRGA Machine (photosynthesis rate data ),Plant Architecture (3D organizationof a plant body) and HELIOS Software (which create 3D plant model).
6 March -12 March 2025
We started Chrysanthemum reading.
On 12 March we finished Rosa rubiginosa .

16 March
• To regenerate Sorbead(Orange CHAMELEON® )
The desiccant column holds Sorbead® Orange CHAMELEON® .The desiccant removes water vapor from the air.
Place in an oven. Sorbead: 60 to 120 minutes at 120 °C (248 °F).
• Sorbead can be regenerated. Sorbead Orange CHAMELEON is orange when dry and colorless when it. needs to be regen-erated.
1. Preheat the oven.
2. Spread a single layer of the granules in a shallow pan and heat for an hour. Less heat for a longer time will not work, nor will more heat for less time.
3. Seal in a glass container while still hot.
4. After the dry color is restored (orange for Sorbead), place the hot regenerated material into a glass container and close the lid while it is still hot.
5. Do not place hot beads into a plastic jar. Store the regenerated desiccant in a sealed glass jar. Avoid plastic containers.
Note: The color of the indicating If it turns black, you’ve overheated it. Sorbead beads maybreak over time but the performance is not affected.

21 March
Plant architecture
Plant architecture refers to the three-dimensional organization of a plant’s body, encompassing branching patterns, leaf and flower organ morphology, and overall plant stature.
Key Aspects of Plant Architecture:
• Three-Dimensional Structure:
Plant architecture considers the arrangement of all plant parts in space, including roots, stems, leaves, and flowers.
• Branching Patterns:
The way a plant branches (e.g., upright, spreading, or indeterminate) is a crucial architectural feature.
• Leaf and Flower Morphology:
The size, shape, arrangement, and orientation of leaves and flower organs play a vital role in overall plant architecture.
• Plant Stature:
The height and overall size of the plant, as well as its root system, are also important architectural features.
• Agronomic Importance:
Plant architecture directly influences a plant’s ability to compete for resources (light, water, nutrients), its susceptibility to environmental stresses.
Plant Architecture Table:
| Sr. No. | Crop Name | Observation No.1 Date | Observation No. 2 Date | Observation No.3 Date |
| 1 | Chilli | 24/3/2025 | 8/4/2025 | 23/4/2025 |
| 2 | Marigold | 21/3/2025 | 4/4/2025 | 19/4/2025 |
| 3 | Tomato | 21/3/2025 | 4/4/2025 | 19/4/2025 |
| 4 | Cucumber | 14/3/2025 | 31/3/2025 | 14/4/2025 |
| 5 | Brinjal | 9/4/2025 | 23/4/2025 | 8/05/2025 |
Spreadsheet of plant Architecture
1.On 21 March we take plant architecture measurements of Marigold, Tomato
2.We measure plant growth parameter such as Height,Width,internode radius initial, internode radius final,insertion angle tip, vegetative bud break time,Leaf length, petioles per internode,etc.

23 March – 26 March
Photosynthesis rate measurements of Chrysanthemum was completed.
On 25 March, I start photosynthetic rate measurements of Senna plant.
28 March – 30 March
On 28 March , Brinjal plant data collection started.
senna plants data collection completed.

31 March
On 31 March 2nd observation of plant Architecture measurements of cucumber completed.
In 2nd Obs. Flower bud break probability was 100 %.

4 April -6 April
2 nd Observation of plant Architecture measurements of Tomato ,chilli and Marigold.
In 2nd Obs. Flower bud break probability of tomato and marigold was 100 %.

Trellising operation :
Trellising of tomato and marigold plant with wire and rope to provide support and keeps fruit and foliage off the ground.
Trellising can increase fruit yield and size , reduce fruit rot.

7 April – 11 April
We took 4 days experiments on cucumber plants :
Day 1 : we took humidity curves of AQI curve at different humilities on same leaf.
Humidity – 45% , 60% , 70% .
Day 2 : Afternoon :
On day 2 we took AQI curve on same leaf ,instead of different leaf at various Temp to find out if there is
a definite temperature trend if leaf is kept same .
Evening :
we took curve at night after sunset – To see how much photosynthesis can be forced after sunset if light
is provided.
Day 3 :
AQI curve at different time on same leaf
Time : 9 am , 11 am , 2.15 pm , 3.15 pm , 4.15 pm .
Temperature : 30 degree (9 am , 11 am )
35 degree ( 2.15 pm , 3.15 pm , 4.15 pm )
To see diurnal variation in photosynthesis response.
Day 4 : Afternoon :
different leaf but same temperature (35 degree)
Time : 12.15 pm, 1.15 pm,2.15 pm
To see photosynthesis rate variation in different leaves of same plant.
Evening :
Evening AQI curve , on different leaves
Temp. 35 ,Humidity 50% ,light 1800
Time : 4.15pm .5.15pm, 6.15pm
12 April :
On VA Data Collection group Nimish sir tell next work schedule:Let’s take capsicum as next target for our curves. We haven’t done capsicum yet?
So, I start Capsicum Data Collection on 14 April.

14 April :
On 14 April I took plant Architecture measurements of cucumber Obs.No. 3
plantation date 6/3/2025
| Sr.No. | Cucumber |
| Observation No.1 (14/3/2025) | In first observation vegetative growth are observed. |
| Observation No.2 (31/3/2025) | In second observation elongation rate increase and flower bud break probability 100%. |
| Observation No.3 (14/4/2025) | In third observation I don’t saw any changes in elongation rate and fruits set probability was 100%. (P1)26 cucumber,(P2) 9 Cucumber,(P3) 10 Cucumber. |

15 April :
On April 15, Mr. Kulkarni sir conducted our review. During the session, he checked the blog and asked for detailed information about the project aim, which stage it is currently at, and its final conclusion. He also inquired whether we had encountered any difficulties during the project and offered some suggestions.
Suggestion: I had uploaded the Plant Architecture Excel file link in the blog please set its access management to “viewer only.
”Overall, the review went very well.
16 April -19 April
On 16th April, the data collection for brinjal photosynthesis rate measurement was completed.
Ravi sir had mentioned that retake the 3 AQI curves for turmeric photosynthesis vs light and the 3 curves for cucumber leaf stomatal conductance — those retake curve have been completed.
3rd Plant architecture observations of tomato have been completed.
Plant Architecture observation of Tomato:
| Observation No. | Tomato (plantation Date 6/3/2025) |
| Observation No.1 21/3/2025 | In first observation of tomato vegetative growth are observed. The tomato plant was 45 days old. |
| Observation No.2 04/04/2025 | In second observation elongation rate increase and flower bud break probability 100%. The tomato plant was 59 days old. |
| Observation No.3 19/4/2025 | The tomato plant was 74 days old. In third observation I don’t saw any changes in elongation rate and fruits set probability was 100%.(P3) 3 Tomato are you observed. |
Plant Architecture observation of Marigold:
| Observation No. | Marigold Plantation Date (6/3/2025) |
| Observation No.1 21/3/2025 | In first observation of tomato vegetative growth are observed. The marigold plant was 45 days old. |
| Observation No.2 04/04/2025 | In second observation elongation rate increase and flower bud break probability 100%. The marigold plant was 59 days old. |
| Observation No.3 19/4/2025 | The marigold plant was 74 days old.In third observation I don’t saw any changes in elongation rate and flower set probability was 100%.(P1) 12 flowers,(P2) 11 flower,(P3)12 flowers are you observed. |

22 April – 23 April
On April 22 and 23, we had meetings with Nimish Sir and Ravi Sir. In the meetings, we discussed and decided the following :”
Ravi Bharti Sir: For new plants, we’ll still be talking measurements at 3 different temperatures.
But the way we decide that temperature will be different,
Step 1- We’ll first create temperature respons from the leaf – using Settings from Generic Response.
Step 2- Find the three temperatures using the temperature response curve, one from the center, and two from one side each.
Nimish sir:
Crops requested – Color Capsicum, Chilli , Rosemary, Chives. To replant Fenugreek as curves are expected to have issues, but standby on that.
In plant Architecture we completed Tomato, Cucumber Marigold,Chilli.so next plant Architecture measurements of capsicum plant .
25 April – 26 April
Tempresponse curve and Diurnal reading of turmeric


objective : understanding how its behavior varies throughout the day.
Step 1: Temperature response curves were obtained at two different photosynthetically active radiation (PAR) levels—900 µmol m⁻² s⁻¹ and 450 µmol m⁻² s⁻¹.
Step 2: AQ curve at temperature of 30°C and 50% relative humidity.
These readings were taken at intervals of 1 to 1.5 hours until 6:00 PM.
28 April – 6May
Plant Architecture Measurement of Capsicum.


On Friday, Nimish sir and the team had a call with Prof. Bailey, who is guiding us on curve data collection. He suggested some changes to our current data collection method. We’ll be discussing these changes today. The team is also reviewing the documents he shared, and the new approach is expected to provide better temperature response stability.

Doc.link of LI-COR Revised Protocol Derived from Prof.Bailey:
https://drive.google.com/file/d/1U2OYHh2qO8Gcc-SmxRZl3FjKtTQHTTAb/view?usp=drivesdk
PROCEDURE FOR PHOTOSYNTHETIC RESPONSE DATA COLLECTION VIA LICOR 6800
Objective:
The objective of this sampling procedure is to Efficiently sample photosynthesis within the space of CO2, light, and temperature combinations. Derived from Prof. Bailey R0 and R1 documents detailing the procedure.
The main changes in this protocol are as under –
1) Diurnal AQ curves to find daily variation of plant response, to see if plant has a strong circadian rhythm. This allows us to set instrument testing times, to be taken on 1 leaf.
2) Temperature response to gauge optimum temperature curves at 3 light conditions, to be taken on 1 leaf.
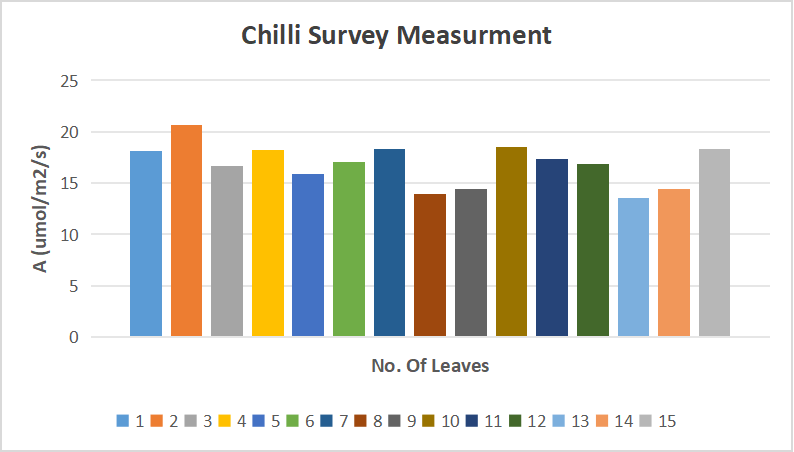
3) Survey measurements on 15-25 leaves to find leaf to leaf variability, on multiple leaves.
4) ACi curves taken at set light,temperature combinations on 2 leaves.
7 May -16 May
Capsicum
Diurnal reading of Capsicum.
Objective: Understanding how its behavior varies throughout the day.
Diurnal Response: refers to observations taken at different times throughout the day (diurnally) to track how tomato plants respond to daily environmental changes.
Circadian rhythms control leaf movements, flower opening, stomatal opening, and timing of photosynthesis.
Step 1 :AQ curve(Photosynthesis vs Light Intensity) at temperature of 30°C ,50% relative humidity and Light Intensity 1800 PAR.

Diurnal Response Observation:
| Time | Plant Observation |
| 6:00 am | Light begins; photosynthesis starts |
| 9:00 am | Stomatal fully open for Gas Exchange |
| 12:00 pm | peak photosynthesis,Sugar production |
| 3:00 pm | Gradual slowing of photosynthesis |
| 6:00 pm | light fades; Stomata begins to close |
| 9:00 pm | Photosynthesis Stop, respiration continues |
| 12:00 am | Energy from stored Sugars used |
| 3:00 am | Resting, preparation for morning cycle |
Step 2: Temperature response curves were obtained at three different photosynthetically active radiation (PAR) levels— 1800µmol m⁻² s⁻¹ ,900 µmol m⁻² s⁻¹ and 450 µmol m⁻² s⁻¹.

Step 3 : Survey measurements on 15-25 sunlit and Sunshaded leaves.
Objective :To find leaf to leaf variability, on multiple leaves.


Step 4: ACi curves taken at set light,temperature combinations on 2 leaves.
The following ACi curves should be taken – (PAR, TEMP)
Leaf 1: Measurements on Leaf 1 represents Light response : (2000, 25) , (1600, 25) (1200, 25) (600, 25) (200, 25) ( 0, 25)

Leaf 2:Measurements on Leaf 2 represents Temperature response :(2000, Tmin) , (2000, Tmax), (2000, Topt) , (2000, 25)

Table showing diurnal plant activity in terms of photosynthesis:
| Time of day | Light Intensity | Photosynthesis rate | Stomatal opening | Transpiration | CO2 uptake |
| Early Morning 6-8 am | low | Incresing | starting to open | Low | Increasing |
| Mid Morning 8-10 am | modreate | Moderately high | opening | Modreate | high |
| Noon 10 am-2 pm | High | peak | fully opened | High | peak |
| Afternoon 2-4pm | High to moderate | Decresing | slightly closing | Modreate | Decresing |
| Evening 4-6 pm | low | low | closing | low | low |
| Night 6 pm-6 am | none | none | closed | minimal | none |
17 May – 22 May
Cucumber
Diurnal reading of Cucumber
objective: understanding how its behavior varies throughout the day.
Step 1: AQ curve at temperature of 30°C and 50% relative humidity.
Time : 11:15 am- 5:15 pm

Step 2: Temperature response curves were obtained at three different photosynthetically active radiation (PAR) levels— 1800µmol m⁻² s⁻¹ ,900 µmol m⁻² s⁻¹ and 450 µmol m⁻² s⁻¹.

Step 3 : Survey measurements on 5-5 sunlit and Sunshaded leaves.
Objective :To find leaf to leaf variability, on multiple leaves.


Step 4: ACi curves taken at set light,temperature combinations on 2 leaves.
The following ACi curves should be taken – (PAR, TEMP)
Leaf 1: Measurements on Leaf 1 represents Light response : (2000, 25) , (1600, 25) (1200, 25) (600, 25) (200, 25) ( 0, 25)
Leaf 2:Measurements on Leaf 2 represents Temperature response :(2000, Tmin) , (2000, Tmax), (2000, Topt) , (2000, 25)

25 May – 7 June
Tomato
Diurnal reading of Tomato.
objective: understanding how its behavior varies throughout the day.
Step 1: AQ curve at temperature of 30°C and 50% relative humidity.
These readings were taken at intervals of 1 to 1.5 hours until 5:00 PM.

Step 2 :Temperature response curves were obtained at Three different photosynthetically active radiation (PAR) levels— 1800µmol m⁻² s⁻¹ ,900 µmol m⁻² s⁻¹ and 450 µmol m⁻² s⁻¹.

Step 3 : Survey measurements on 5-5 sunlit and Sunshaded leaves.
Objective :To find leaf to leaf variability, on multiple leaves.

Step 4: ACi curves taken at set light,temperature combinations on 2 leaves.
The following ACi curves should be taken – (PAR, TEMP)
Leaf 1: Measurements on Leaf 1 represents Light response : (2000, 25) , (1600, 25) (1200, 25) (600, 25) (200, 25) ( 0, 25)

Leaf 2:Measurements on Leaf 2 represents Temperature response :(2000, Tmin) , (2000, Tmax), (2000, Topt) , (2000, 25)

8 June – 17 June
Turmaric
Diurnal reading of Turmeric.
objective: understanding how its behavior varies throughout the day.
Step 1: AQ curve at temperature of 30°C and 50% relative humidity.
These readings were taken at intervals of 1 to 1.5 hours until 5:00 PM.

Step 2 :Temperature response curves were obtained at Three different photosynthetically active radiation (PAR) levels— 1800µmol m⁻² s⁻¹ ,900 µmol m⁻² s⁻¹ and 450 µmol m⁻² s⁻¹.

Step 3 : Survey measurements on 6-6 sunlit and Sunshaded leaves.
Objective :To find leaf to leaf variability, on multiple leaves.


Step 4: ACi curves taken at set light,temperature combinations on 2 leaves.
The following ACi curves should be taken – (PAR, TEMP)
Leaf 1: Measurements on Leaf 1 represents Light response : (2000, 25) , (1600, 25) (1200, 25) (600, 25) (200, 25) ( 0, 25)

Leaf 2:Measurements on Leaf 2 represents Temperature response :(2000, Tmin) , (2000, Tmax), (2000, Topt) , (2000, 25)

19 June
On 19th June, Ravi Sir came to the VA campus .
we were taking the A–Ci curve at different light responses, but our photosynthesis curve at 0 PAR was not coming out correctly. This curve is very important for us as it is required for the Farquhar, von Caemmerer, and Berry (FvCB) biological model. So, he came to help solve the problem and also took LI-COR readings himself. However, even Ravi Bharti Sir couldn’t get the expected curve at 0 PAR. So, we asked Prof. Bailey for help to solve this issue.
Doc.link related FvCB:
https://drive.google.com/drive/folders/1A2y-aIJlyTT0FC1ZADNF_KcR9l7rowC1
23 June – 28 June
First phase:
In the first phase, we have satisfactorily completed the photosynthesis data collection for the following plants:Turmeric,Rose,Strawberry,Brinjal,Cucumber, Chrysanthemum,Fenugreek,Senna,Capsicum,Tomato.
Second phase:
In the second phase, the following plants were required for photosynthesis data collection, and they have been planted in the polyhouse:
1. Cucumber – Akamsha F1
2. Capsicum – Indus 11
3. Ginger –
4. Garlic –
5. Chilly – SVHA0786 Hybrid Hot Pepper
6. Bottle Gourd – Harnish 4001
7. Bitter Gourd – F1 Green Emerald
8.Brinjal – SBJH17709
9.Carrot – Shepy
10. Onion –
11.Snake gourd(padwal)
12. Cherry Tomato – Nagmoti (F1 Hybrid Tomato)
2 July – 9 July
From the first phase, we had to take some retake data because some of the curves for the Senna plant were not coming out as expected. So, it was necessary to retake them.
senna plant
Step 1 :Temperature response curves were obtained at Three different photosynthetically active radiation (PAR) levels— 1800µmol m⁻² s⁻¹ ,900 µmol m⁻² s⁻¹ and 450 µmol m⁻² s⁻¹.

Diurnal reading of Senna
Objective: understanding how its behavior varies throughout the day.
Step 2: AQ curve at temperature of 30°C and 50% relative humidity.
These readings were taken at intervals of 1 to 1.5 hours until 5:00 PM.
Step 3 : Survey measurements on 6-6 sunlit and Sunshaded leaves.

Objective :To find leaf to leaf variability, on multiple leaves.
Step 4: ACi curves taken at set light,temperature combinations on 2 leaves.
The following ACi curves should be taken – (PAR, TEMP)
Leaf 1: Measurements on Leaf 1 represents Light response : (2000, 25) , (1600, 25) (1200, 25) (600, 25) (200, 25) ( 0, 25)

Leaf 2:Measurements on Leaf 2 represents Temperature response :(2000, Tmin) , (2000, Tmax), (2000, Topt) , (2000, 25).

11 July- 18 July
Chilli
Diurnal reading of chilli.
objective: understanding how its behavior varies throughout the day.
Step 1: AQ curve at temperature at 30°C and 50% relative humidity.
AQ Curve at temperature at 25°C and 50%Humidity.
Step 2 :Temperature response curves were obtained at Three different photosynthetically active radiation (PAR) levels— 1800µmol m⁻² s⁻¹ ,900 µmol m⁻² s⁻¹ and 450 µmol m⁻² s⁻¹.
Step 3 : Survey measurements on 15-15sunlit and Sunshaded leaves.
Objective :To find leaf to leaf variability, on multiple leaves.
Step 4: ACi curves taken at set light,temperature combinations on 2 leaves.
The following ACi curves should be taken – (PAR, TEMP)
Leaf 1: Measurements on Leaf 1 represents Light response : (2000, 25) , (1600, 25) (1200, 25) (800,25) (600, 25),(400,25) (200, 25) (100,25) ( 0, 25)
Leaf 2:Measurements on Leaf 2 represents Temperature response :(2000, Tmin) , (2000, Tmax), (2000, Topt) , (2000, 25).

25 July
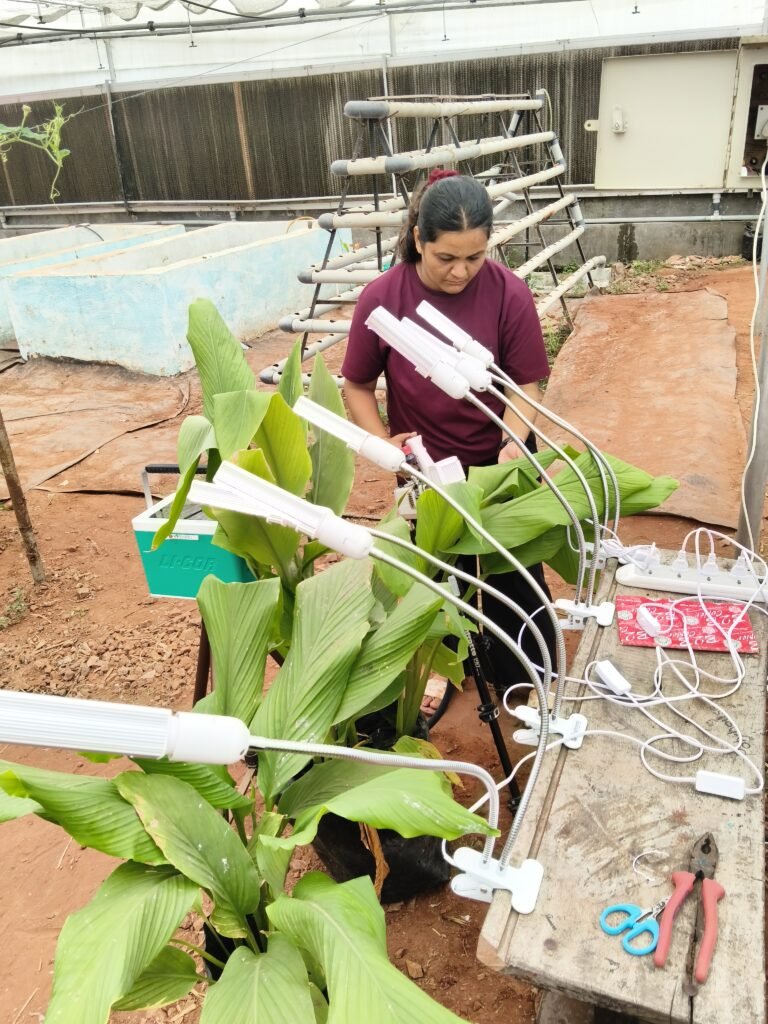
Ravi Sir visited the campus on 25th July for the plant grow light experiment.
We want to set up these lights near the plants temporarily so that we can move them around as needed.
The reason is that some plants, like senna, are not showing proper behavior due to very low light during the monsoon.
Before taking the readings, we plan to provide these plants with extra light in the areas where low light is affecting them the most.

29-30 July
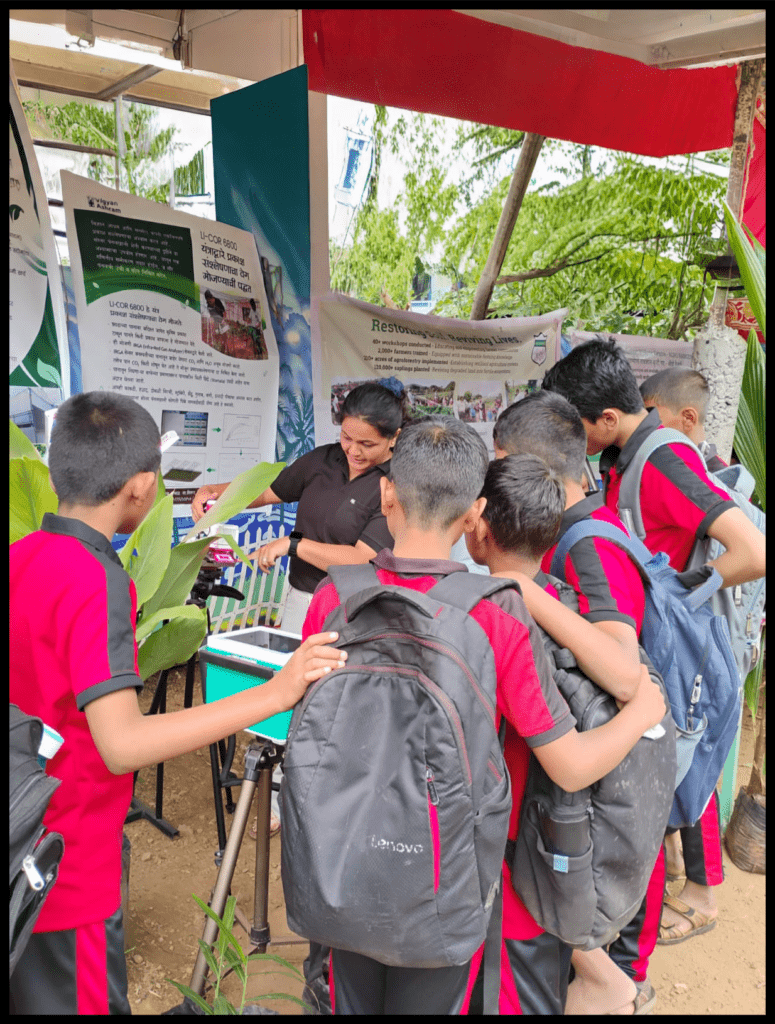
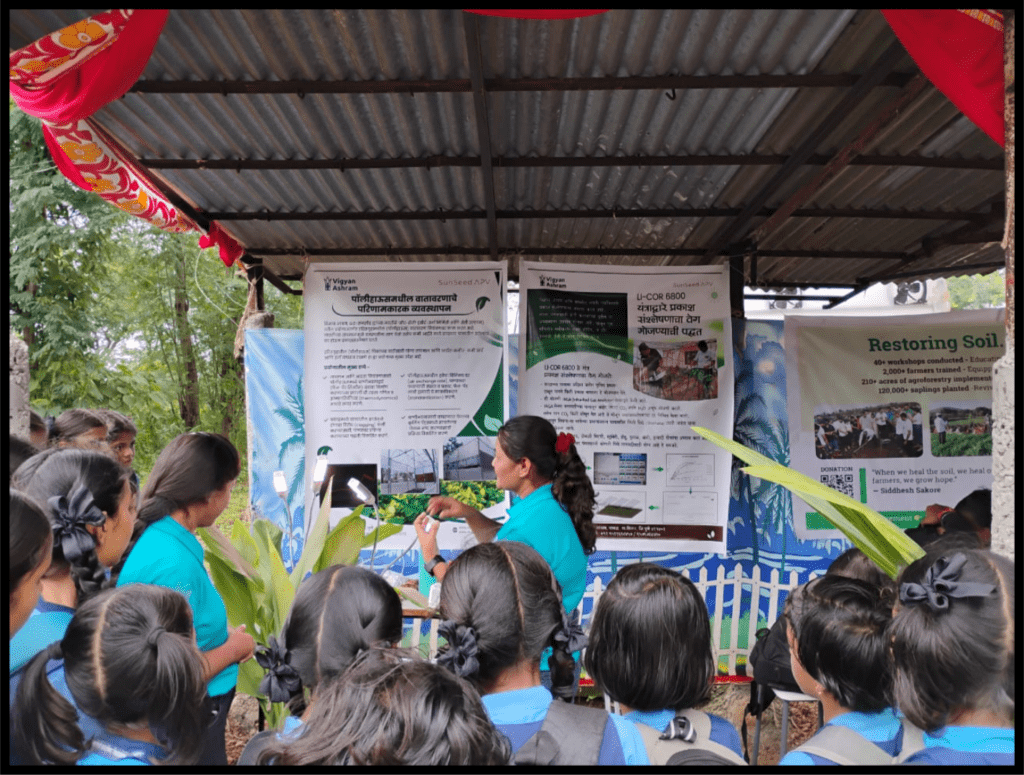
A two-day open house exhibition was organized at Vigyan Ashram on 29–30 July, where I prepared a poster, video, and PPT. I actively participated in the event, It was a great learning experience for me.
2 August
We transferred the plants from the polyhouse to the open field. Due to low light conditions in the polyhouse during monsoon, we decided to keep the plants outside in a less shaded area and pause LI-COR measurements for a week. For the actual measurements, we will use grow lights and bring the plants back inside the polyhouse to protect them from rain.
12-13 August
Ravi Sir and Nimish Sir visited the campus, and the software protocol (light and temperature sweeps) was transferred into the LI-COR system for automated measurements. This provides a faster method of measurement.
By using the new programs (BP Builder) ACi_Temperature_Sweep.py and ACi_Light_Sweep.py, we collected data for cucumber, turmeric.
17 August – 24 August
Data Collection Of Chilli .
Variety: SVHA0786 Hybrid Hot Pepper
1.ACi_Temperature_Sweep.py
2.ACi_Light_Sweep.py
3.Survey measurements on chilli leaves.
3 – 12 Sept
Photosynthesis Measurement of Brinjal
Variety : SBJH1770
Step 1: 1.ACi_Temperature_Sweep.py
2.ACi_Light_Sweep.py
Step 2: Diurnal reading of brinjal.
objective: Understanding how its behavior varies throughout the day.
AQ curve at temperature at 25°C and 50% relative humidity.
Step 3 : Survey measurements on 15-15 sunlit and Sunshaded leaves.
Objective :To find leaf to leaf variability, on multiple leaves.
Step 4: VPD Graph
14 September – 24 September
Photosynthesis Measurement Ginger plant
Diurnal reading of Ginger
objective: understanding how its behavior varies throughout the day.
Step 1: AQ curve at temperature at 30°C and 50% relative humidity.
AQ Curve at temperature at 25°C and 50% Humidity.
Step 2 : Temperature response curves were obtained at Three different photosynthetically active radiation (PAR) levels— 1800µmol m⁻² s⁻¹ ,900 µmol m⁻² s⁻¹ and 450 µmol m⁻² s⁻¹.
Step 3 : Survey measurements on 15 leaves.
Objective :To find leaf to leaf variability, on multiple leaves.
Step 4: ACi curves taken at set light, temperature combinations on 2 leaves.
The following ACi curves should be taken – (PAR, TEMP)
1.ACi_Temperature_Sweep.py
Leaf 1: Measurements on Leaf 1 represents Light response : (2000, 25) , (1600, 25) (1200, 25) (800,25) (600, 25),(400,25) (200, 25) (100,25) ( 0, 25)
2.ACi_Light_Sweep.py
Leaf 2:Measurements on Leaf 2 represents Temperature response :(2000, Tmin) , (2000, Tmax), (2000, Topt) , (2000, 25) .
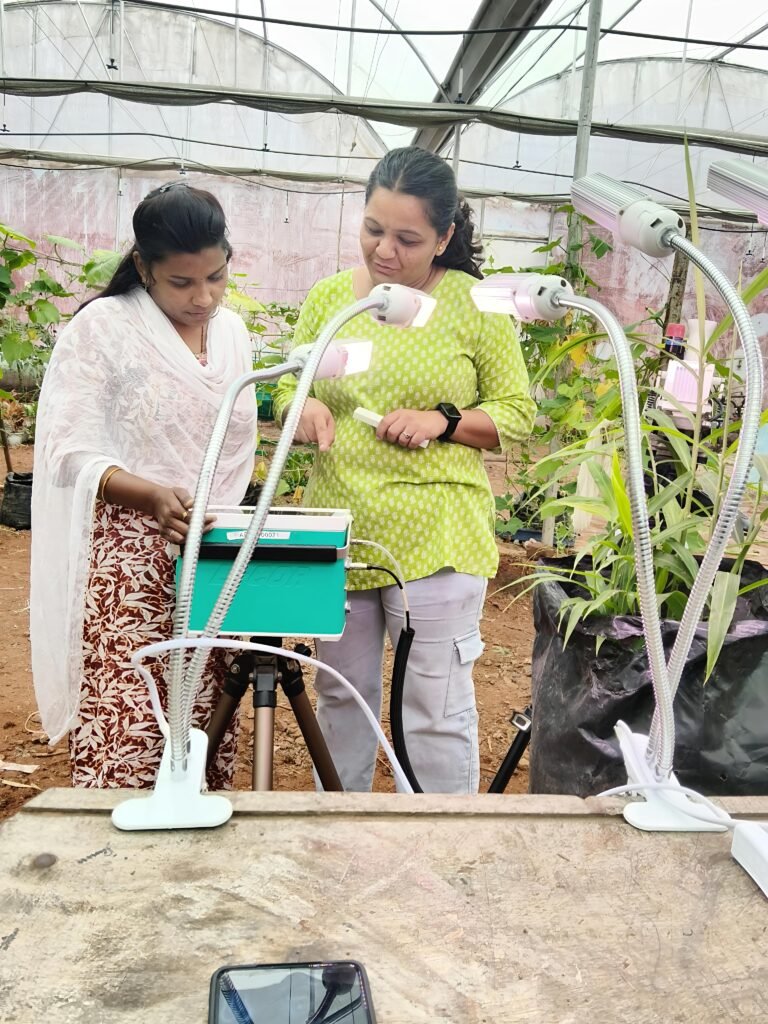
I am training Jyostna to use the LI-COR machine for collecting photosynthesis readings from plants. Before allowing her to handle the machine, I provided thorough training on the basics of its operation. After two days of hands-on practice, I introduced her to the scientific principles behind the machine.
27 September 2025 – 3 Oct 2025
Photosynthesis Measurement Cherry Tomato
Variety : Nagmoti
Step 1: ACi curves taken at set light, temperature combinations on 2 leaves.
The following ACi curves should be taken – (PAR, TEMP)
1.ACi_Temperature_Sweep.py
Leaf 1: Measurements on Leaf 1 represents Light response : (2000, 25) , (1600, 25) (1200, 25) (800,25) (600, 25),(400,25) (200, 25) (100,25) ( 0, 25)
2.ACi_Light_Sweep.py
Leaf 2:Measurements on Leaf 2 represents Temperature response :(2000, 20) , (2000, 22.5), (2000, 25) , (2000, 30) , (2000, 35) , (2000, 38) , (2000, 40) , (2000, 43).
Step 2 : Survey measurements on 20 leaves.
Objective :To find leaf to leaf variability, on multiple leaves .
8 Oct 2025
Had a short discussion with Ravi sir about the LI-COR photosynthesis reading. After cherry tomato, we decided on the next two plants — 1) Bottle gourd and 2) Bitter gourd. So, I started taking readings for bottle gourd.
10 – 18 Oct 2025
Photosynthesis Measurement of Bottle Gourd
Variety : Harnish 4001
The following ACi curves should be taken – (PAR, TEMP)
Step 1 : 1.ACi_Temperature_Sweep.py
Leaf 1: Measurements on Leaf 1 represents Light response : (2000, 25) , (1600, 25) (1200, 25) (800,25) (600, 25),(400,25) (200, 25) (100,25) ( 0, 25)
2.ACi_Light_Sweep.py
Leaf 2:Measurements on Leaf 2 represents Temperature response :(2000, 20) , (2000, 22.5), (2000, 25) , (2000, 30) , (2000, 35) , (2000, 38) , (2000, 40) , (2000, 43).
Step 2 : Survey measurements on 15 leaves.
Objective :To find leaf to leaf variability, on multiple leaves .
Step 3 : Diurnal reading of Bottle Gourd
objective: understanding how its behavior varies throughout the day.
Step 3: AQ curve at temperature at 30°C and 50% relative humidity.
AQ Curve at temperature at 25°C and 50% Humidity.
Step 4 : Temperature response curves were obtained at Three different photosynthetically active radiation (PAR) levels— 1800µmol m⁻² s⁻¹ ,900 µmol m⁻² s⁻¹ and 450 µmol m⁻² s⁻¹.
24 Oct 2025
The photosynthesis training started on 10th November. The training was conducted under the guidance of Nimish Sir (Sunseed APV) and Dr. Ramakant Sir (Head of R&D Department, Sahyadri Farms, Nashik), who holds a Ph.D. in Pathology. During the training, I started teaching Aditya Potinde how to operate the machine.
The following ACi curves should be taken – (PAR, TEMP)
Step 1 : 1.ACi_Temperature_Sweep.py
Leaf 1: Measurements on Leaf 1 represents Light response : (2000, 25) , (1600, 25) (1200, 25) (800,25) (600, 25),(400,25) (200, 25) (100,25) ( 0, 25)
2.ACi_Light_Sweep.py
eaf 2:Measurements on Leaf 2 represents Temperature response :(2000, 20) , (2000, 22.5), (2000, 25) , (2000, 30) , (2000, 35) , (2000, 38) , (2000, 40) , (2000, 43).
Step 2 : Survey measurements on 15 leaves.
Objective :To find leaf to leaf variability, on multiple leaves .
Step 3 : Diurnal reading of Bitter Gourd
objective: understanding how its behavior varies throughout the day.
Step 3: AQ curve at temperature at 30°C and 50% relative humidity.
AQ Curve at temperature at 25°C and 50% Humidity.
Step 4 : Temperature response curves were obtained at Three different photosynthetically active radiation (PAR) levels— 1800µmol m⁻² s⁻¹ ,900 µmol m⁻² s⁻¹ and 450 µmol m⁻² s⁻¹.
31 Oct – 1Nov 2025
On 31st October, Ravi Sir visited the campus to take rapid ACI curves of three plants. Among them, Sir and I took the readings for cherry tomato. On 1st November, I took the rapid ACI readings for bottle gourd.
7 Nov 2025
A conference call was held on 7th November with Nimish Sir, Ranjeet Sir, and me. During the discussion, it was decided that the LI-COR machine will be shifted to Sahyadri Farms, Nashik, on Sunday, 9th November. I will be conducting a four-day training session on the LI-COR machine from Monday to Thursday. The machine will remain in Nashik for a few months for grape readings. During this training, I will complete one reading cycle of grapes and then return .
10 Nov 2025 – 13 Nov 2025
The photosynthesis training started on 10th November. The training was conducted under the guidance of Nimish Sir (Sunseed APV) and Dr. Ramakant Sir (Head of R&D Department, Sahyadri Farms, Nashik), who holds a Ph.D. in Pathology. During the training, I started teaching Aditya Potinde how to operate the machine.
Photosynthesis Measurement of Grapes
Variety : ARD 36
Day 1 :: (10 Nov 2025 )
I am training Aditya to use the LI-COR machine for collecting photosynthesis readings of plants. Before allowing him to operate the machine, I provided thorough training on its basic operation. After two days of hands-on practice, I introduced him to the scientific principles behind the machine.
On the first day, we took diurnal readings (AQ curve at 12 pm, 2 pm, and 5 pm) and temperature response readings (AT curve at 1800, 900, and 450 PAR).
objective: understanding how its behavior varies throughout the day and At to find optimum temp range for grapes.
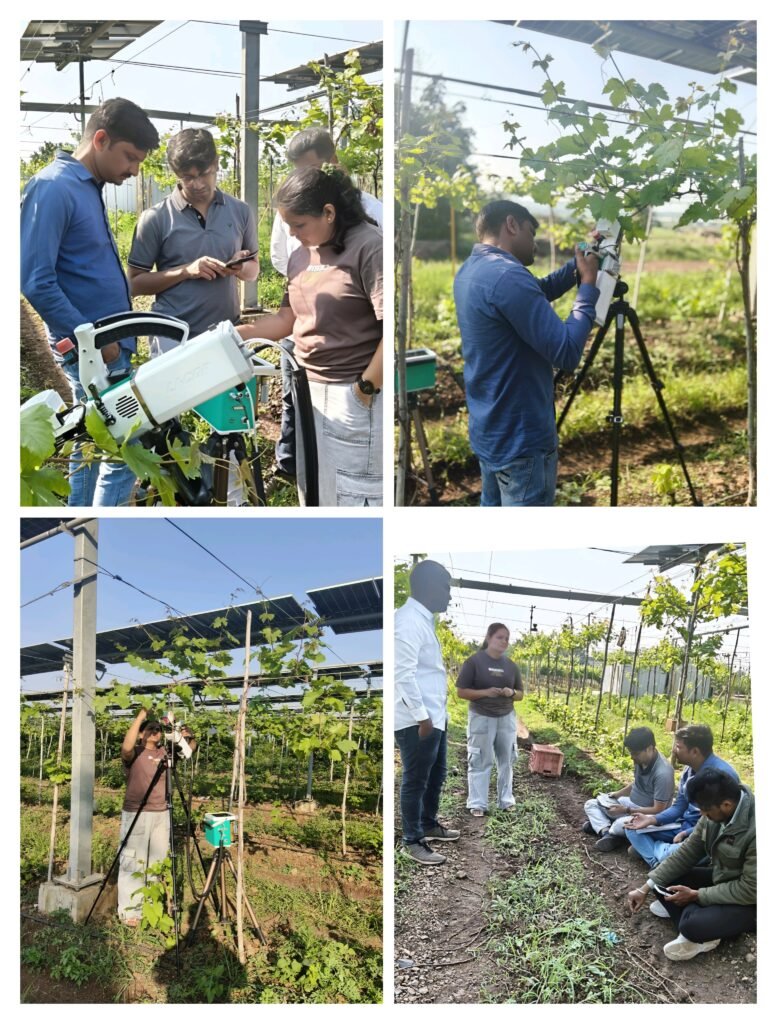
Day 2 :: (11 Nov 2025 ) On the second day, we took A–Ci readings at different light and temperature levels and also took spot (survey measurement) readings.
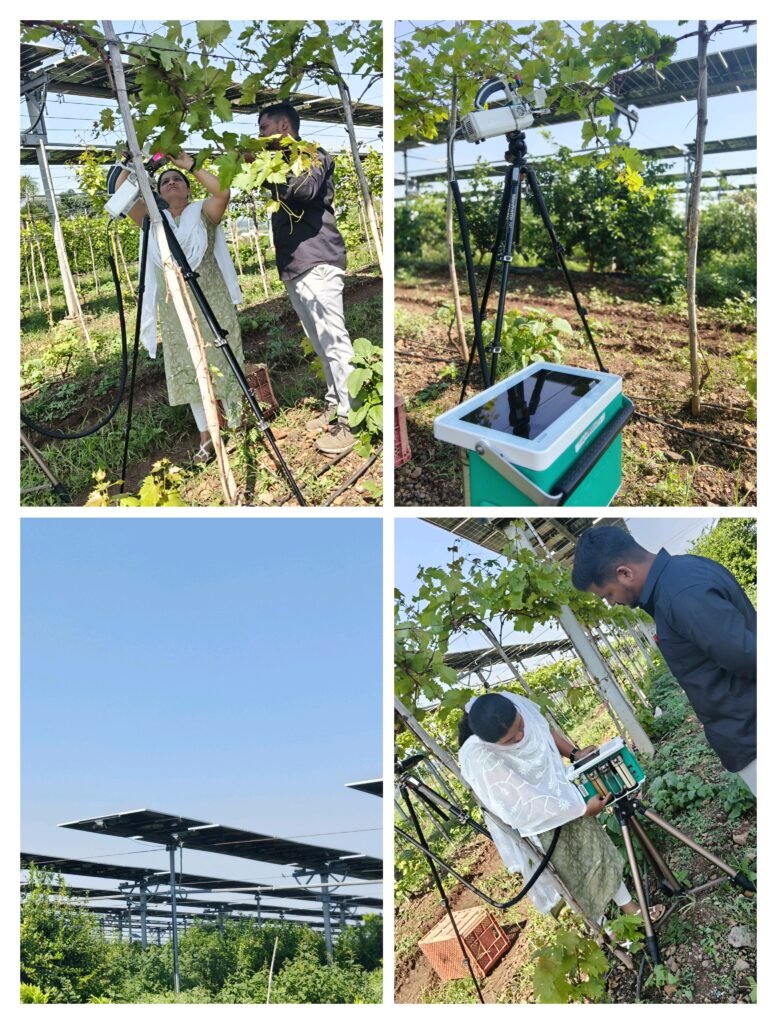
Day 3 :: (11 Nov 2025 ) On the third day, we took the VPD curve at different humidity and temperature levels to observe the stomatal conductance behavior.
Day 4 :: (12 Nov 2025 )
On the 4 th day, we took the VPD curve at the same humidity and temperature but at different light levels to observe the stomatal conductance behavior according to light intensity conditions.
Training Note: Photosynthesis Dynamics in Grapevines
Topic: Understanding the “Hard Reality” and “Challenge” of Photosynthesis in Grapes
Speaker: Mr. Oscar Salgado – International Grape Expert.
Source Explanation to me : Dr. Ramakant Sir
Reference: Somkuwar et al. (2013), Department of Horticulture, National Research Centre for Grapes (NRCG), Pune, India.
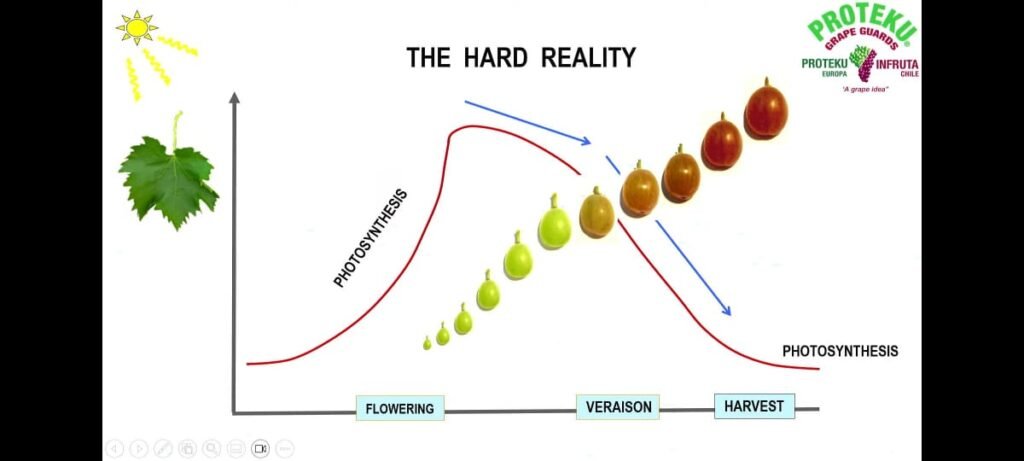
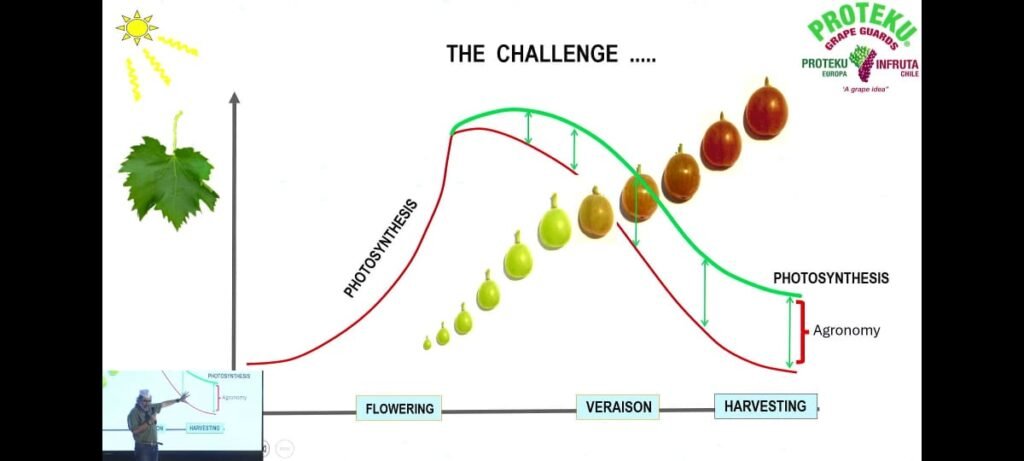
1. The Hard Reality Photosynthesis in grapevines increases gradually after flowering, reaches its maximum during early berry growth, and then declines sharply after veraison (when berries begin to change color). As berries ripen, leaf efficiency decreases due to ageing of leaves, reduced chlorophyll activity, and environmental stress. Consequently, at harvest, photosynthetic activity is much lower than during the active growth phase.
Key takeaway : Energy production through photosynthesis naturally declines during berry ripening, which can limit fruit development and quality.
2. The Challenge The challenge for viticulturists is to maintain higher photosynthetic activity even during later growth stages . The green curve (in the diagram) represents sustained photosynthesis achieved through good agronomic practices such as: Proper canopy management (avoiding leaf burn and maintaining green leaves)Balanced nutrition and fertilization Adequate irrigation and humidity management Protection from heat and radiation stress The red curve shows the natural decline without such management .The gap between green and red curves is the agronomic advantage, showing how proper vineyard care can sustain productivity.
Key takeaway : Agronomy plays a crucial role in extending the active life of leaves to maintain photosynthesis and improve grape quality.
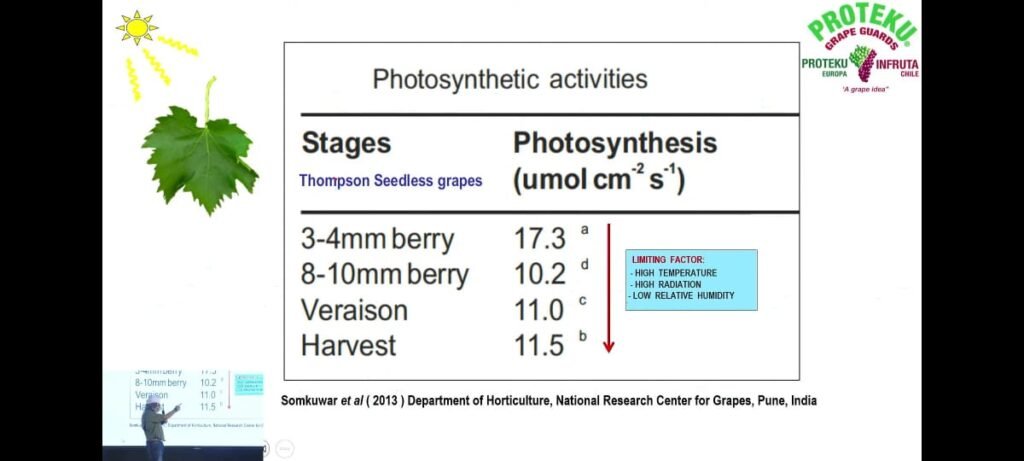
3. Photosynthetic Activities at Different Stages :
| Growth Stage | Photosynthesis Rate (µmol cm⁻² s⁻¹) | Observation |
| 3–4 mm berry | 17.3 | Highest activity during early berry growth |
| 8–10 mm berry | 10.2 | Decline starts as berries enlarge |
| Veraison | 11.0 | Slight recovery but still lower than early stage |
| Harvest | 11.5 | Moderate activity maintained till harvest |
Limiting Factors:
High temperature
High radiation intensity
Low relative humidity
Key takeaway : Environmental conditions significantly affect photosynthetic efficiency. Managing heat and moisture helps sustain photosynthesis longer
4. Overall Summary Mr. Oscar Salgado emphasized that : “The success of grape production lies in how long we can keep the leaves green and functional after veraison. Sustaining photosynthesis through smart agronomy ensures better sugar accumulation, berry size, and overall fruit quality.”
This is to inform you that the LI-COR 6800 Portable Photosynthesis System, provided through Sunseed APV, Parbhani Company, has been utilized at Vigyan Ashram for the past 10 months under the Agrivoltaics Project for photosynthesis data collection.
After completing four days of training on the LI-COR 6800 system, the machine has been functioning effectively and has contributed significantly to our ongoing research work. As the current phase of data collection at Vigyan Ashram is now completed, the LI-COR 6800 machine is being officially handed over to Sahyadri Farms, Nashik — to Aditya and Dr. Ramakant Sir — for their further research under the same project framework. The machine has been temporarily shifted to Nashik for approximately two months.
