Purpose:
The purpose of surveying of farm land is to construct farm pond near at one point of land. The construction of farm pond is required to store rain water for the further use which is used in different ways.
Farm Pond: Farm ponds are small tank or reservoir like constructions, are constructed for the purpose of storing the surface water. Farm pond is a dug out structure with definite shape and size for collecting surface runoff flowing from the farm area. The farm ponds are the water harvesting structures, solve general purposes of farm needs such as supply of water for irrigation, cattle feed, fish production, etc.
General description of study area:
Present work is conducted near the Dhamari village, Tal. Shirur, Dist: Pune. From Pabal village the location of study area is about 6 km and from Pune city is about 53 km.
22/02/2022 To 02/03/2022b
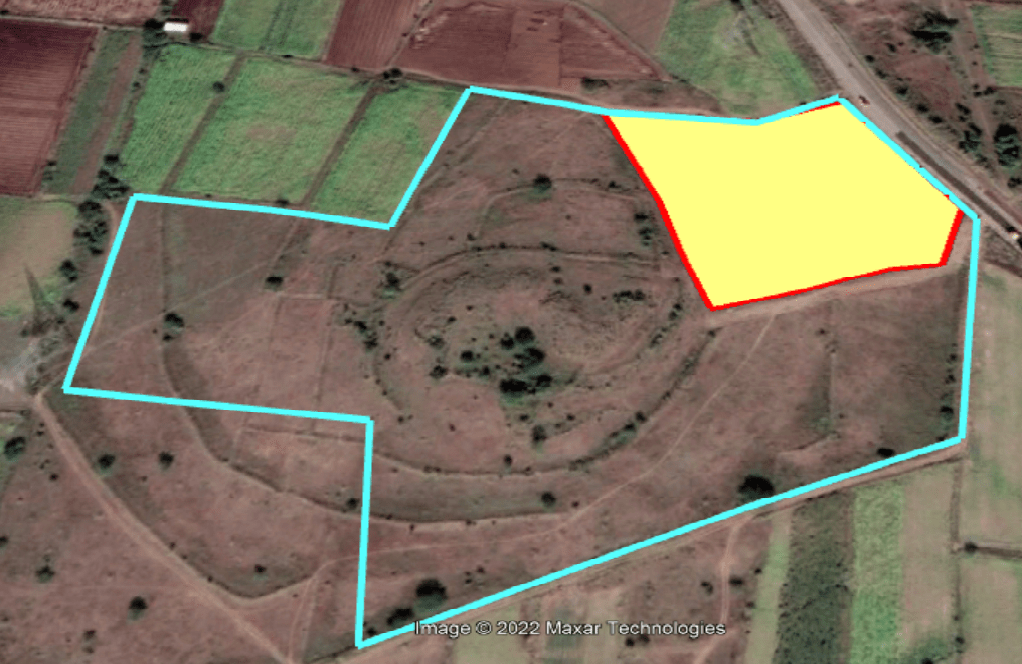
Location of study area:
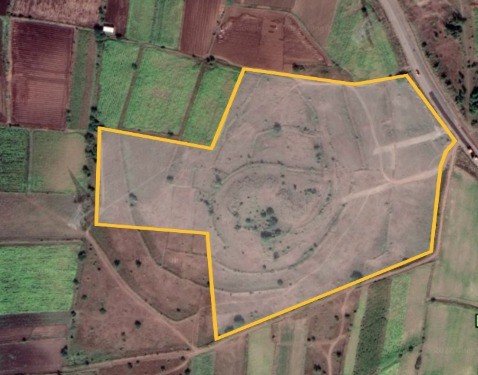
Total area = 57,677.81 m2
= 14.25 Acres
Total distance = 1.11 km
= 3,657.65 ft..
Average rainfall = 500 – 600 mm
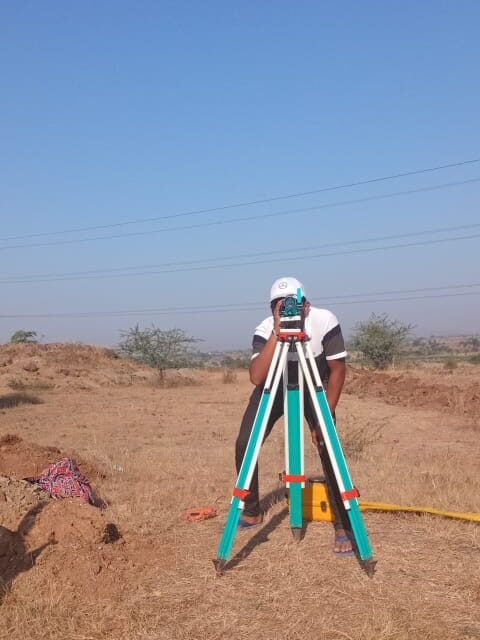
Instruments used for surveying:
- Dumpy level
- Tripod stand
- Leveling Staff
- Measuring tape
- Hydro marker or Leveling tube
Objectives:
- To surveying of farm land of Mr. Siddhesh Sakore at dhamari, Shirur.
- To determine slope of land by using hydro marker for the construction of farm pond.
- Plotting of contour lines of land area by using ArcGIS and Quik grid software.
- To suggest an estimated cost for a construction of farm pond
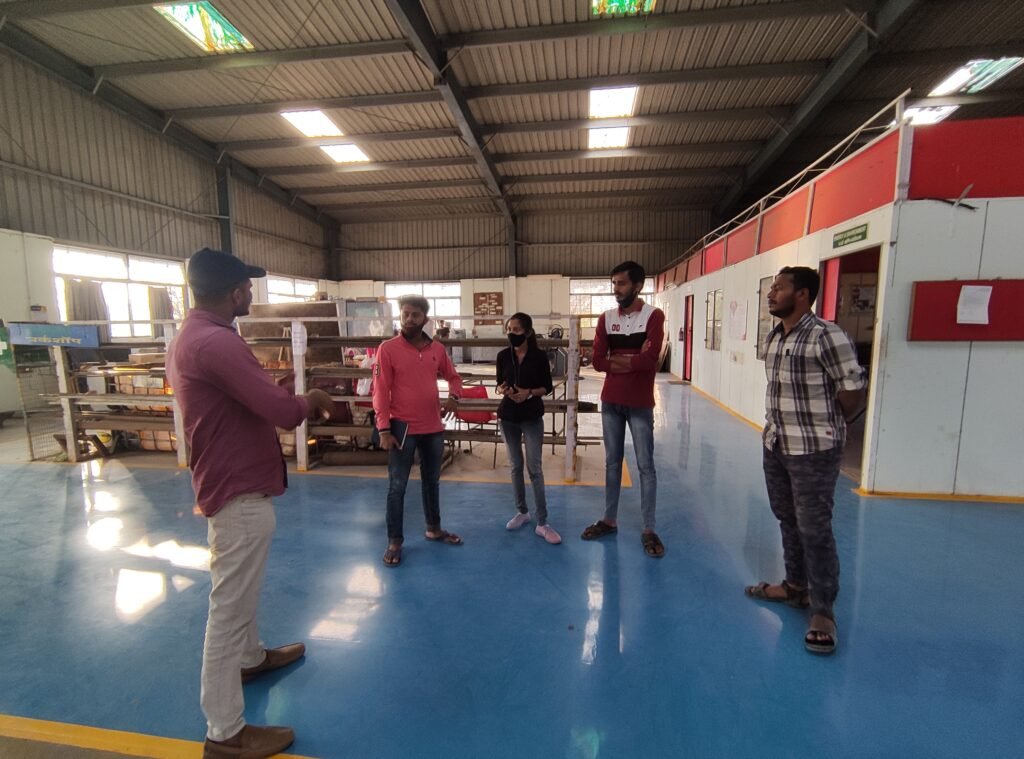
Team for surveying and calculation purpose:
1. Pratik Jadhav
2. Ajay Patil
3. Gayatri Pakhale
4. Parvati Hange
5. Asavari Sabale
6. Arpita Jagtap
7. Pradnya Devkule
Procedure for surveying of land:
- At first, the adjustment of dumpy level is done by taking different points on land for measurement of accurate readings on level.
- Fix the dumpy level on the tripod stand in the middle of land which we have to take readings further.
- Adjust longitudinal bubble by using foot screws until the position of bubble comes in the middle of tube. After that rotate the dumpy in 360o to check from all direction that bubble is in middle.
- Mark the points on the distance of 12 m by using measuring tape for reading purpose. Then we take 5 points in the interval of 12 m in the vertical and horizontal surface of the land.
- Take each readings on dumpy level by putting leveling staff on the points which we are marked using marking powder.
Land Slope:
Calculation of the slope of land is a important parameter for constructing farm pond. By calculating land slope we get the direction of flow of water at a particular point. Land slope is usually calculate by using hydro marker or leveling tube.
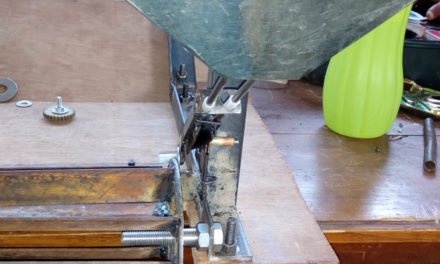
Hydro Marker:
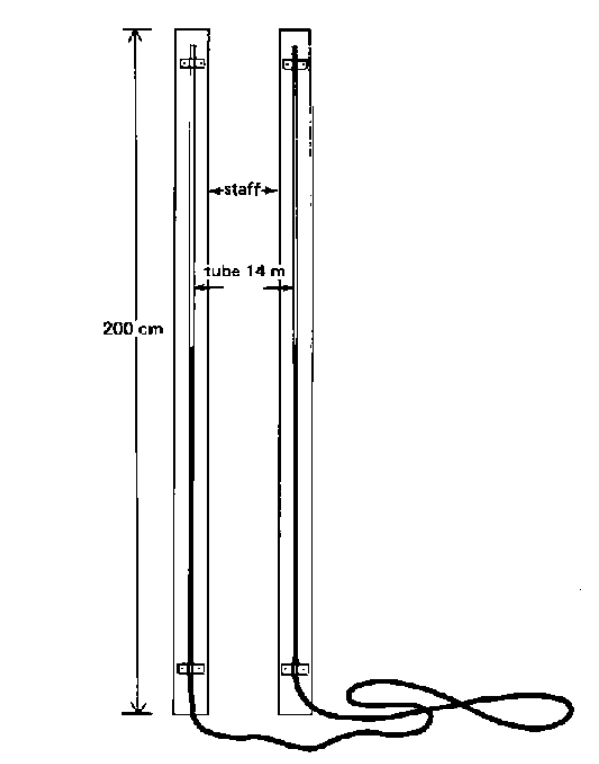
Hydro marker is the instrument use for calculation of slope of farm land. by using hydro marker it is easy to calculate the actual slope of land. Hydro marker is based on the communicating vessels principle.
Communicating vessels principle: Communicating vessels or vases are a set of containers containing a homogeneous fluid and connected sufficiently far below the top of the liquid; when the liquid settles, it balances out to the same level in all of the containers regardless of the shape and volume of the containers. If additional liquid is added to one vessel, the liquid will again find a new equal level in all the connected vessels.
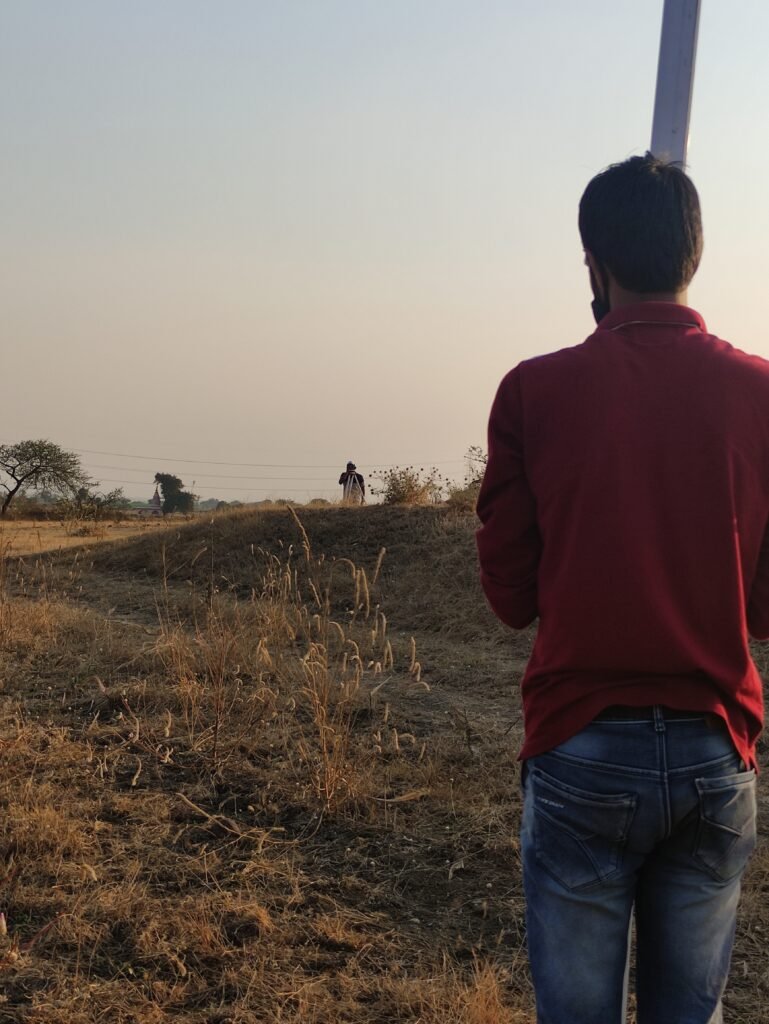
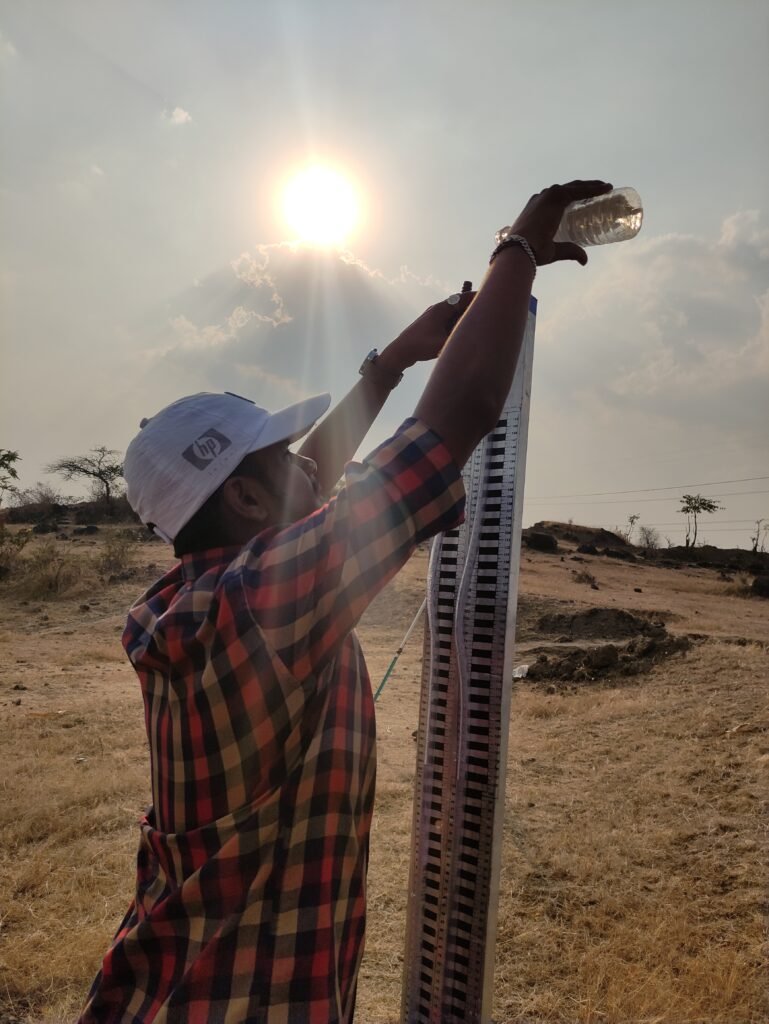
Procedure for measuring land slope:
- firstly, take hydro marker, feel the one side of it with water to remove all the air bubbles from it. Then remove some amount of water for leveling the tube.
- Level the water mark in tube up to it comes to 100 or near by it. Check the level by putting hydro marker side to side.
- After marking is complete put one tube at one point and other at in front of first tube. When placing is done in accurate manner we take vertical and horizontal readings of land.
- Because there is unequal land surface readings are taken in two rows in the interval of five points each.

Calculations for land slope:
Formula:
Slope = Vertical distance/ Horizontal Distance * 100
1st Row:
Table No.1: Land slope readings of 1st row
| Sr. No. | vertical Distance (cm) | Horizontal Distance (m) |
| 1. | 55 | 11.10 |
| 2. | 63 | 11 |
| 3. | 23 | 11 |
| 4. | 59 | 11.10 |
| 5. | 69 | 10.95 |
| 6. | 62 | 10.90 |
| Total= | 331 | 66.05 |
Slope = 3.31/ 66.05 = 5.0 %
2nd Row:
Table No.2: Land slope readings of 2nd row
| Sr. No. | vertical Distance (cm) | Horizontal Distance (m) |
| 1 | 95 | 10.90 |
| 2. | 87 | 10.80 |
| 3. | 47 | 10.90 |
| 4. | 74 | 11.20 |
| 5. | 69 | 10.80 |
| Total= | 372 | 54.5 |
Slope = 3.72/ 54.5 = 6.82 %
3rd Row:
Table No.3: Land slope readings of 3rd row
| Sr. No. | vertical Distance (cm) | Horizontal Distance (m) |
| 1 | 21 | 11 |
| 2. | 102 | 11.10 |
| 3. | 70.5 | 11.10 |
| 4. | 34 | 11 |
| 5. | 98 | 11 |
| Total= | 325.5 | 55.2 |
Slope: 3.25/55.2 = 5.88 %
4th Row:
Table No.4: Land slope readings of 4th row
| Sr. No. | vertical Distance (cm) | Horizontal Distance (m) |
| 1 | 34 | 11.10 |
| 2. | 69 | 10.90 |
| 3. | 74.5 | 11.10 |
| 4. | 23 | 11.10 |
| 5. | 101 | 11.20 |
| Total= | 301.5 | 55.4 |
Slope: 3.01/ 55.4 = 5.43 %
From the above given 4 tables the calculated slope values for 1st, 2nd, 3rd and 4th are 5%, 6.82%, 5.88 % and 5.43% respectively. On the basis of this slope values we should consider that this values are suitable for construction of farm pond.
11/03/2022 To 16/03/2022
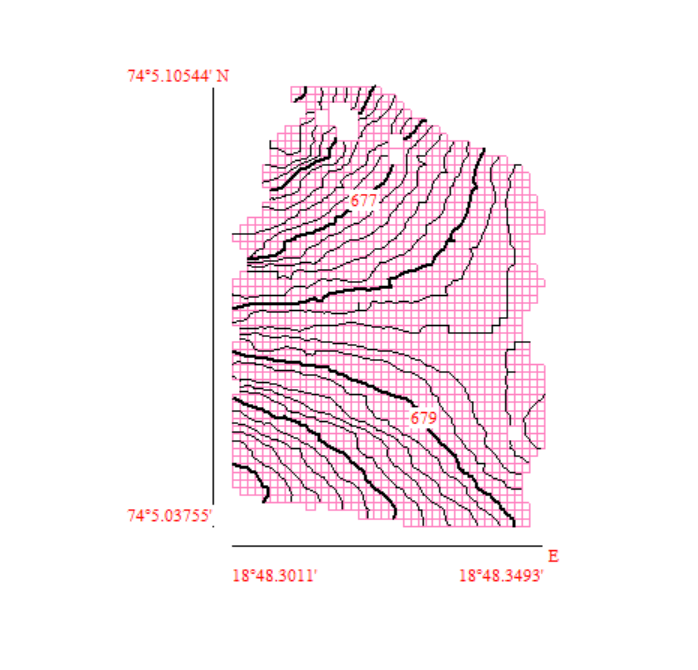
Calculation for contour lines :
contour: An imaginary line on the ground surface joining the points of equal elevation is called as contour.
contour interval: Contour interval is the vertical distance between the two consecutive contour lines.
Formula:
Contour Interval (C.I.) = Highest RL – Lowest RL / Number of contours
Methods of contouring:
A. Direct:
B. Indirect
For the plotting of contour lines we used square method.
Calculations:
Contour Interval = Highest RL – Lowest RL / Number of contours
= 100 – 96.7 / 8
C.I. = 0.40 m.
For the calculation of plotting of contour lines on graph following formula is used:
Arithmetic Interpolation Method: Distance/ Difference of RL point 8 * (Required contour – RL of point)
By using formula we calculate the contour line points on graph on which we can determined contour Point.


17/03/2022 To 31/03/2022
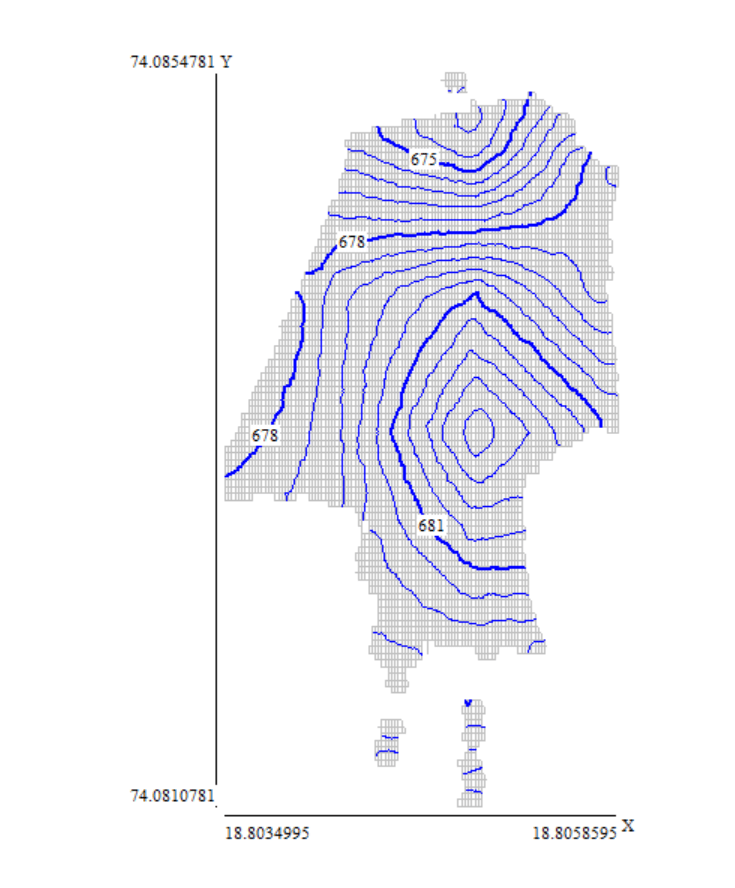
Quik Grid Software:
Quik Grid is a program which is read in a set of scattered data points (x, y, z) which represents a surface. the program will generate a grid from this data and then display the surface as a contour map or as a 3d representation. It is suited in situations where it is desired to have a quick look at as set of data points.

02/04/2022
Percolation losses of soil: Percolation is the downward movement of water within soil. The rate of percolation is affected by soil characteristics.
Why percolation data is important from agricultural lands?
Agriculture can affect the quantity and quality of water in streams and waterbodies. Percolation can contribute to groundwater recharge. Water percolates through the unsaturated zone, a soil zone close to the surface. Eventually some of this water may reach the water table, where the ground is saturated with water to form groundwater aquifers.
The main purpose to calculate the percolation data is to know that how much water is percolate into the particular area of land for selecting the proper dimensions of farm pond to harvesting of rainwater.
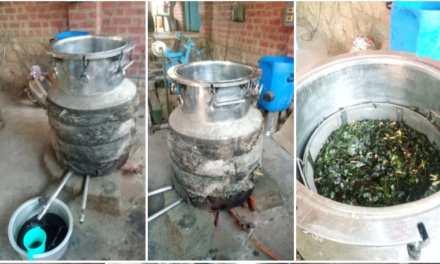
Calculation of Percolation data by using bottle experiment:
Table No. 5 Percolation data of different soil
| Soil type | Black soil | Red soil |
| Soil taken (kg) | 1.5 | 1.5 |
| Water (ml) | 1000 | 1000 |
| Water percolate (ml) | 530 | 340 |
| Water absorbed (ml) | 470 | 760 |
| Time taken to percolate 1st drop | 35 seconds | 10 minute |
| Total time | 10 minutes | – |
Percolation losses experiment of Siddhesh sir land:
Table No. 6 Percolation data of actual land soil
| Soil | 1st Sample | 2nd sample |
| Soil Taken (Kg) | 1.5 | 1.5 |
| Water (ml) | 1000 | 1000 |
| water percolate (ml) | 620 | 560 |
| Water absorbed (ml) | 380 | 440 |
Note: According to above percolation data it is not enough to give appropriate dimensions of farm pond. There is lack of percolation data research papers or any data which is available online.
So on the basis of catchment area I give the size of farm pond for this land, is as follows:
07/04/2022
Catchment area of land:
Catchment area may be defined as the area from which the surface runoff is derived. Also known as watershed area.
Calculation of catchment area:
Total catchment area = 1 Hectare = 2.5 Acres
1 Acre = 4046 m2
2.5 Acres = 10117 m2
Average rainfall = 500 mm = 0.5 m
Total Volume = 10117 * 0.5 = 5058.5 m3
Total amount of water = 5058.5 * 1000 = 5058500 liters/Acre
From the given catchment area an average of 50,58,500 litres of water should be collect on land.
As from value we can suggest 30 * 30* 4.5 m of farm pond stored about 45,00,000 litres water.
06/05/2022
Description about mapping views of land:


From given mapping details the result is that the land area is comes in Yellow region so in that region there are possibilities of water conservation structures like nala bund, check dams, recharge well. percolation tanks and farm ponds. So from this we can suggest particular design of farm pond.
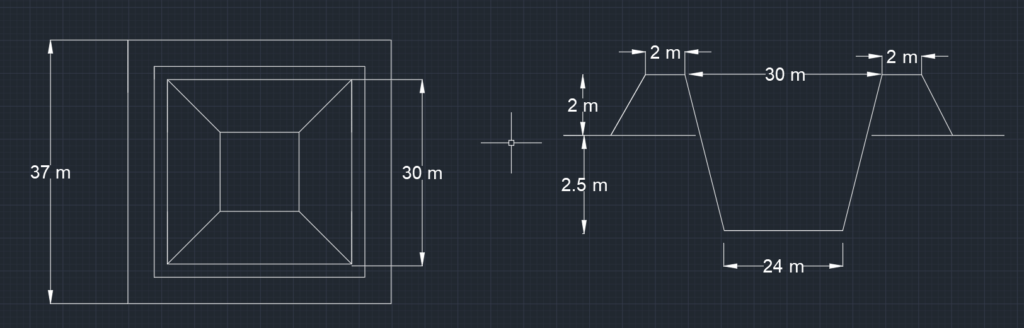
Dimensions of farm pond:
Table No. 7: Specifications of farm pond
| Sr. No. | Particulars | Dimensions |
| 1. | Pond shape | Square |
| 2. | Length at top surface level | 37 m |
| 3. | Width at top surface level | 37 m |
| 4. | Length at mid length | 27 m |
| 5. | Width of middle length | 27 m |
| 6. | Length at bottom level | 24 m |
| 7. | Width of bottom level | 24 m |
| 8. | Top surface area | 1369 Sq. m |
| 9. | Mid depth area | 729 sq. m |
| 10. | Bottom surface area | 576 sq. m |
| 11. | Total depth of pond | 4.5 m |
| 12. | Slope proposed | 1:1 |
Cost estimation of farm pond:
Volume of earth work below ground level =

A: – Top surface area, Sq. m
B: – Mid depth area, Sq. m
C: – Bottom surface area, Sq. m
D: – Depth of pond

= 2949.75 m3
1. Rate of excavation for hard strata is 55 Rs per cubic meter
Cost of earth work below the ground level = Total volume of earth work below the ground level × 55 Rs
= 2949.75 × 55 = Rs. 1, 62,236
2. Rate of HDPE lining of farm pond is 2000 cubic meter and rate of pepper per cubic is 95 Rs
Total cost of HDPE lining = 2000 × 95
= Rs. 1, 90,000
Total Cost of farm pond = Cost of earth work below the ground level + cost of HDPE lining
= 1, 62,223 + 1, 90,000
= Rs. 3, 52,223
Total Cost of farm pond is Rs. 3, 52,223.
Result:
- By using dumpy level surveying of land and contour lines of area were calculated.
- The average slope of land is about 5% to 6% which is calculated by hydro marker.
- Mapping of land and calculation of contour lines is also done by using Quik grid software which gives accurate data of land.
- Contour lines gives direction of flow of water of land for construction of farm pond.
- Rough cost estimation of farm pond is about Rs. 3,52,223.
Conclusion:
- In drought areas, harvesting of rain water is important. Therefore, the construction of farm pond is very useful for farmers to harvest rainwater which can be used in dry days.
- Online software methods of mapping can save lot of time of human being as compared to traditional methods of surveying.
- By mapping, we can get appropriate catchment area of farm and runoff flow, so farmers can construct farm pond according to their land area, slope of land and need of water.
Concluding notes:

