Objective:
How to do data logging using ESP8266 wifi module, DHT22 temperature, and humidity sensor and Arduino UNO board.
You can use it at home, at the office, or anywhere there is an internet connection, for indoor or outdoor data logging. Ιn this project I had used the DHT-22 sensor to take temperature (C) and humidity (%) values every 15 seconds. For the internet connection, I had used the ESP8266 WiFi (serial) module because it’s small, cheap and easy to use, and for data logging, I had used the open data platform for the Internet of Things “ThingSpeak” (www.thingspeak.com).
You can also make monthly or yearly average charts and see how your climate change affects your area!
Procedure:
Step 1: What I had used?
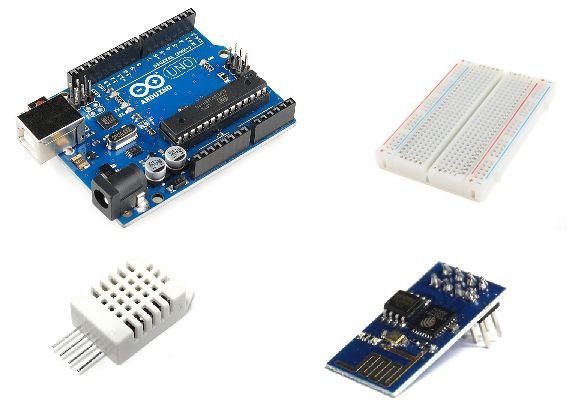
For this project I used following things:
- Arduino uno board (or any other Arduino board) (link)
- Small breadboard (or an breadboard shield) (link)
- DHT-22 sensor (link)
- ESP8266 WiFi serial module (link)
…and off course some breadboard wires.
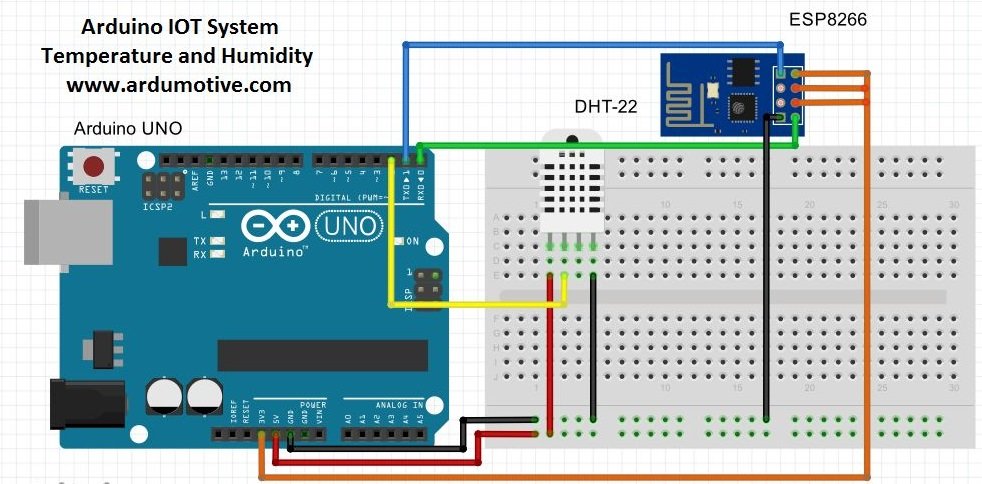
Step 2. The Circuit

Connections:
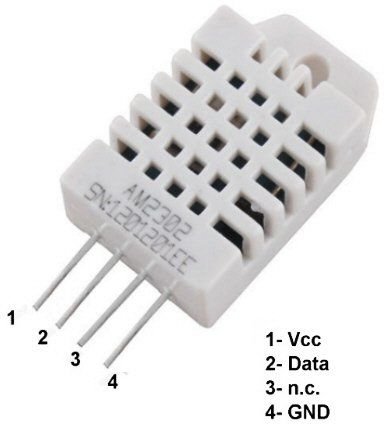
DHT-22
- DHT-22 Vcc to Arduino 5V
- DHT-22 Data to Arduino pin 2
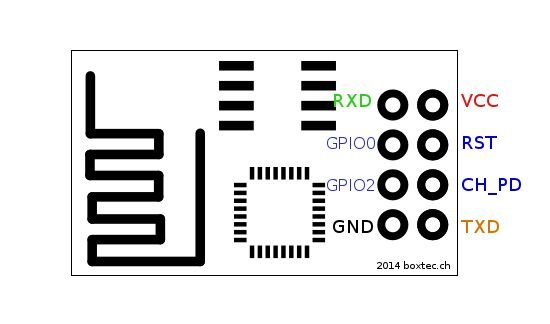
ESP8266
- Vcc, RST, and CH_PD to Arduino 3.3V
- RXD to Arduino pin 1 (TX)
- TXD to Arduino pin 0 (RX)
Step 3: Create Thingspeak account:

Visited www.thingspeak.com and clicked on the “Get Started” button to make a free account.
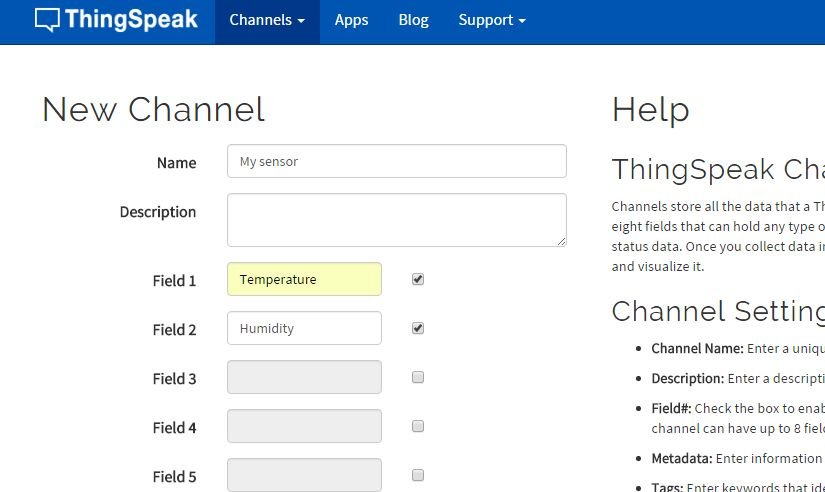
After creating an account I had clicked on the “New Channel” (second image above). Gave it a name and selected two fields. If you want you can fill more info about your channel, e.g. Latitude and Longitude of your sensor. If you want to share sensor info with your friends (and more..) click on the “Make Public?” checkbox option. Finally, click on the “Save Channel” button. And channel created.
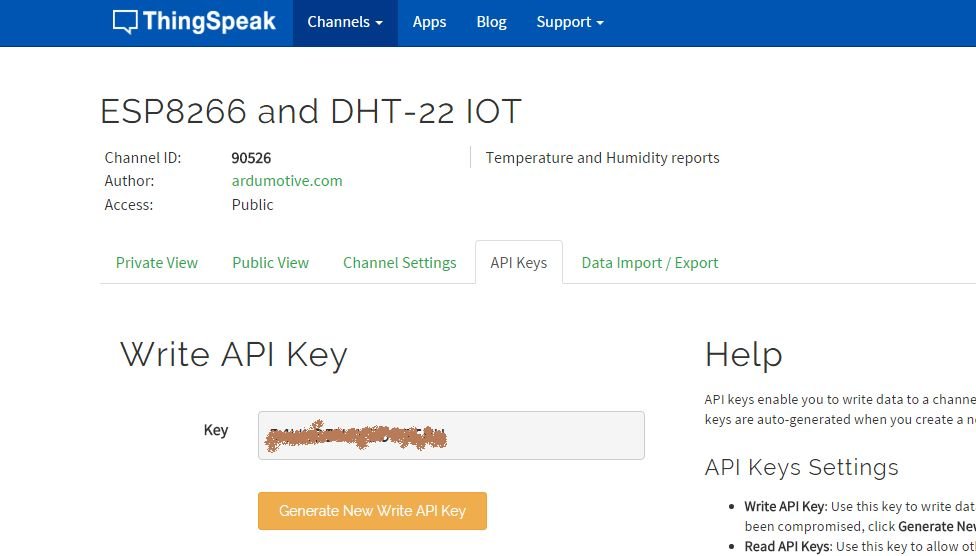
After that, I had clicked on the new channel and selected the API keys tab (third image above). Copied “Write API Key”, pasted it in code.
Step 4: The code
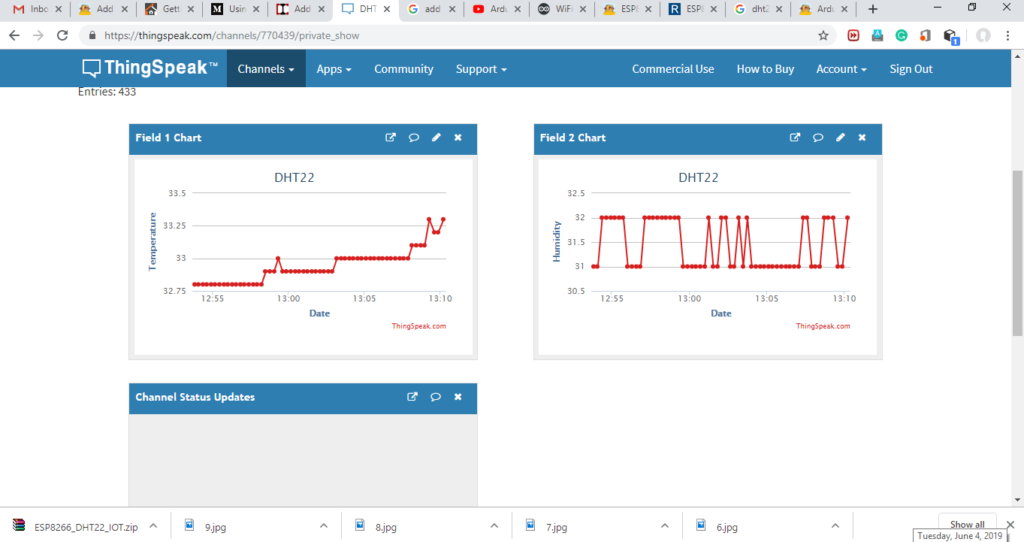
Step 5: Data Logger
Conclusion:
It made it.
Next Plan:
- Adding a real clock circuit to control the time of data sending with accuracy
- Adding a rechargeable battery and one small solar panel
- Adding more charts for monthly and yearly average values


