
Aim :
To map micro and small businesses in rural areas and explore potential renewable energy use cases through field survey .
Objectives
a) Map existing micro and small enterprises and business models in villages.
b) Conduct field interaction with stakeholders and local entrepreneurs.
c) Explore current energy use and related challenges and the impact those challenges have on business.
d) Identify potential uses for renewable energy among rural enterprises.
Introduction
As part of my internship under IIT-TUM SEED, at Vigyan Ashram , Pabal , I am studying renewable energy usage and business opportunities in nearby rural areas. Through field visits and conversations with villagers, farmers, and MSMEs, I am trying to understand how renewable energy can address local energy challenges sustainably.
Background
For this project, the first step was literature review , different reports by CEEW (Council on Energy, Environment and Water) , WRI (world resource institute) report , SIDBI (Small Industries Development Bank of India) report, etc. were studied for to know about renewable energy application in rural area, some of the major conclusions found through this reports were as follows :
- Electrification and productive use among micro- and small-enterprises in rural North India – ScienceDirect
- Through survey of 2004 households it was found that even with full grid electrification at the village level, about one-third of MSEs have no access to grid power due to financial capacity and affordability concerns (setu plez)
Overview of the primary electricity sources across all sampled MSEs. Table (a) groups MSEs by the type of electrification into those using the grid only, off-grid only and those using both or none. Table (b) describes all sources of electrification reported by the MSEs, the proportions here sum to over 100% as MSEs can rely on multiple sources indicated by Table (a).
| (a) Electrification groups | ||
|---|---|---|
| Electricity source group | Total firms | Proportion |
| Grid | 876 | 44% |
| Grid + Off-grid | 431 | 22% |
| Off-grid | 437 | 22% |
| None | 260 | 13% |
| (b) All sources of electricity | ||
| Sources used | Total firms | Proportion |
| Grid | 1307 | 66% |
| Minigrid | 176 | 8% |
| SolarHomeSystem | 234 | 12% |
| Generator | 107 | 6% |
| SolarLantern | 87 | 4% |
| Battery | 338 | 16% |
| None | 260 | 12% |
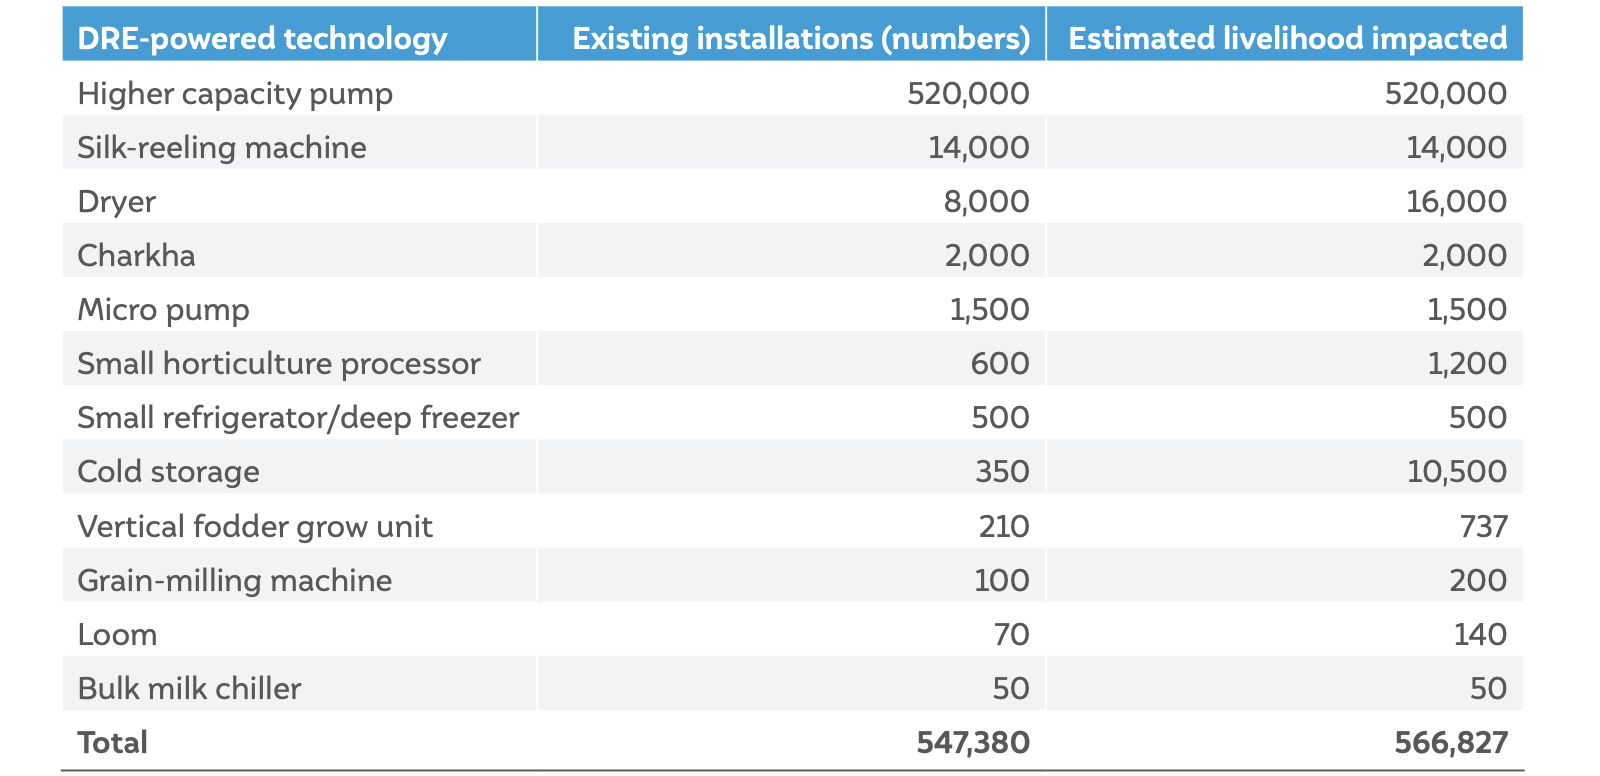
The report concluded that the technologies for earning a living in rural areas, known as Decentralized renewable energy (DRE) livelihood technologies, are a great chance for India’s rural economy to grow. If the government, banks, and businesses work together to support these technologies, they can help a lot of people in rural areas have better lives. (CEEW)
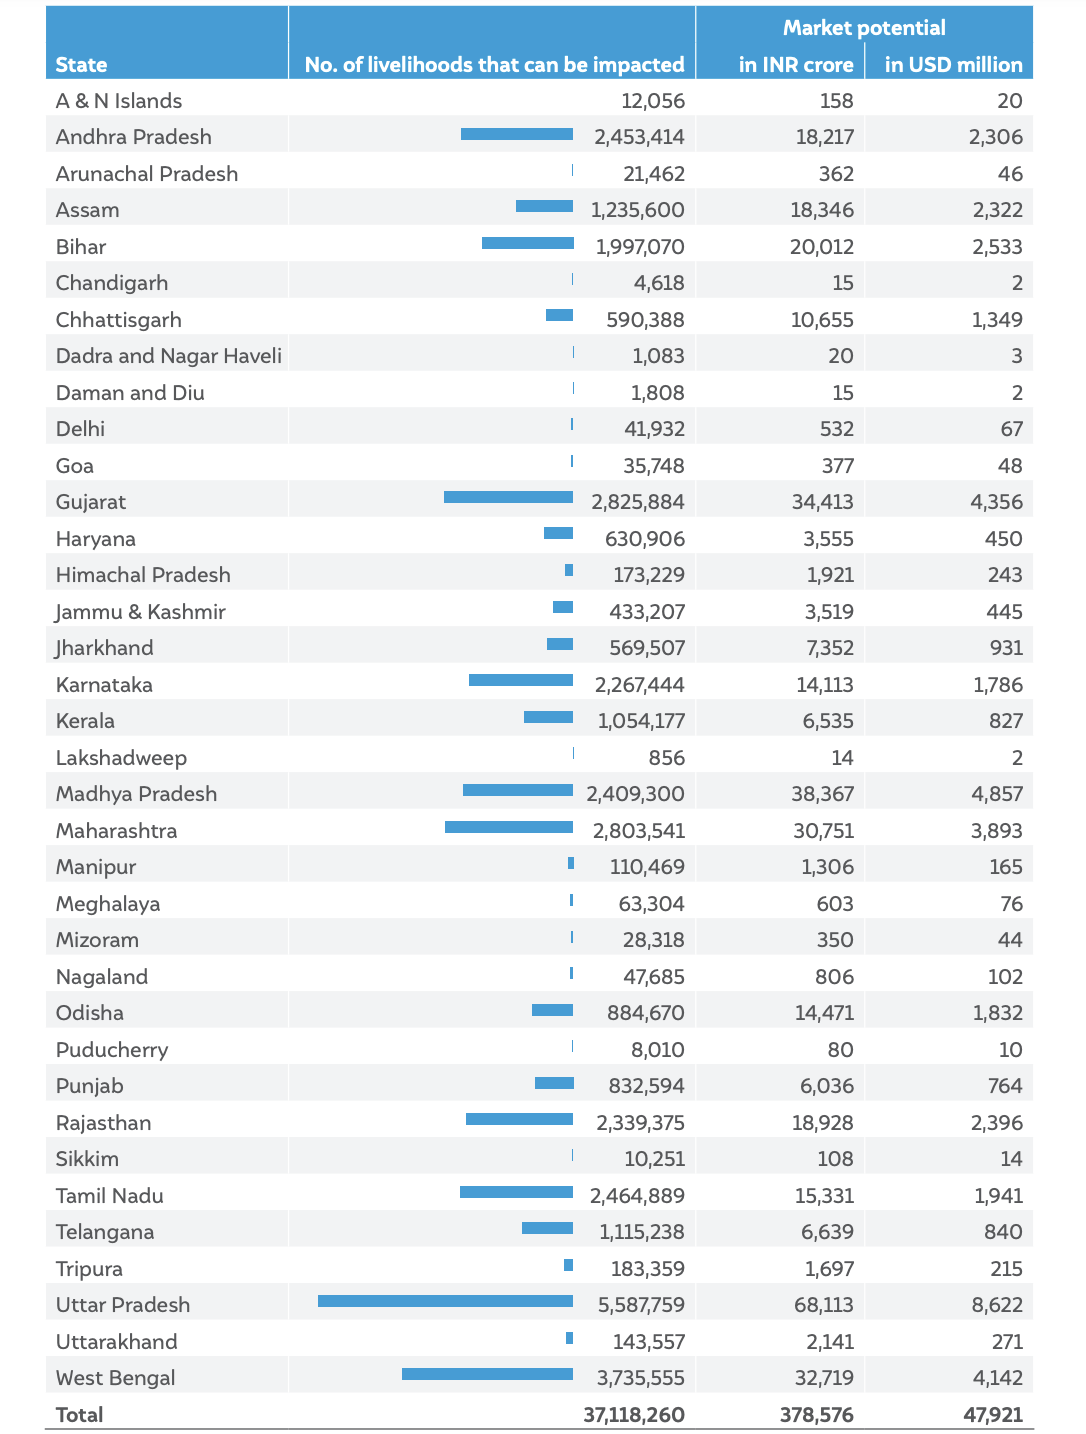
Merely 12 market-ready DRE technologies such as solar pumps, solar dryers, solar-powered silk reeling machines and biomass-powered cold solar storages can impact 37 million livelihoods in India, generating revenue worth ~USD 50 billion for enterprises manufacturing DRE-based livelihood technologies.
With the highest population, Uttar Pradesh stands at the top of the list, where DRE technologies have the greatest impact opportunity potential. West Bengal, Bihar, Gujarat, Maharashtra, Madhya Pradesh, and Karnataka follow the list.
3.Understanding the IEA’s 2025 Outlook for India | WRI India
WRI India concludes that india’s energy transition is accelerating but is also at risk of being derailed due institutional constraints which are infrastructure gaps and financial strain on the distribution. (WRI report )
“India’s energy transition is mediated by multiple institutions. Renewable integration depends on state electricity regulators and utility governance. Industrial decarbonization relies on national standards, investment signals, robust markets and sector-specific technology choices. Essential services such as healthcare and rural livelihoods depend on reliable local supply shaped by infrastructure and administrative capacity. Critical minerals and circularity add further institutional requirements as clean energy systems scale. This plurality creates room for innovation, but it also means that the transition will not unfold along a single pathway. Political choices around tariffs, subsidies and public finance will shape what states can realistically deliver.”
4. Part-I.pdf
The FY2025 data from SIDBI suggests that the major issue revolves around the final mile connection to micro-enterprises, a problem highlighted by MSE-GIFT subvention underutilization (only 560 out of 1,958 eligible loans have accessed subvention).
“SIDBI is the implementing agency for MSE Green Investment and Financing for Transformation (MSE GIFT) and MSE Scheme for Promotion and Investment in Circular Economy (MSE-SPICE) of Mo MSME. The schemes encourage sustainable, eco-friendly practices and renewable energy use in Micro and Small Enterprises (MSEs) by offering interest subventions or subsidies, for
investing in green technologies. During the FY2025, out of the total green loan extended,1958 green loans have been covered under MSE-GIFT Scheme of Ministry of MSME (being implemented by SIDBI) for providing Interest Subvention (IS), out of which 560+ MSMEs have since availed the Interest Subvention”
5. Adoption of decentralized renewable energy solutions by MSMEs : barriers and opportunities in India
Despite growing DRE adoption by Indian MSMEs, the process is still inconsistent. Although there is an average level of awareness, the structural constraints such as finance availability and regulatory environment inhibit the vast majority from taking action. (IJEEP)
Distribution of MSMEs (quantitative phase)
Category Subcategory Number of MSMEs
Total sample size–390
State-wise Distribution
Maharashtra 80
Gujarat 75
Tamil Nadu 80
Karnataka 75
West Bengal 80
Subtotal 390
Sector-wise Distribution
Manufacturing 120
Textiles 90
Food Processing 75
Chemicals 60
Services 45
Subtotal 390
Source: Based on data collected and prepared by Author
3: Adoption of DRE
Category Frequency Percent Valid
Percentage
Cumulative
Percentage
Yes 199 51.03 51.03 51.03
No 191 48.97 48.97 100
Source: Based on data collected & prepared by Author
4: Chi-square test: Awareness versus adoption
Awareness Adopted Not Adopted Total
Yes 143 111 254
No 44 92 136
Total 187 203 390
Source: Based on data collected and prepared by Author. *Chi-square Value=11.53,
df=1, P<0.01
interpretation: “The chi-square test results (see Table 4) reveal a statistically significant association between MSME owners’ awareness of decentralized renewable energy (DRE) technologies and their actual adoption decisions, χ²(1, N = 390) = 14.62, p <.001. The P-value is less than the 0.01 significance level, indicating that the association between awareness and adoption is statistically significant. MSMEs that are aware of renewable energy solutions are more likely to adopt them compared to those that are not aware. This confirms the importance of targeted information dissemination campaigns in increasing DRE penetration. Furthermore, the Cramér’s V for this 2 × 2 table was calculated at 0.172, which suggests a moderate association between awareness and adoption”
After the literature review what variables should be studied, categorization of MSME’s, study area and selecting villages for the project was done, followed by preparing the questionnaire. pilot interviews were taken to understand how villagers respond, what questions should be added or removed, the questionnaire was modified accordingly next day and again interviews were conducted with the iterated questions. Link for the google form: https://docs.google.com/forms/d/e/1FAIpQLSedBE23Ee0d9224C4gnqPlew7sJz9olpgMXGPp5ufOXXmmi6w/viewform
Field work progress :
16–18 May: Field Survey and Interviews in Loni
The respondents were generally cooperative and willing to participate in the survey. A total of 15 enterprises were interviewed, and the majority of respondents provided similar perspectives regarding their energy consumption patterns and renewable energy adoption.
The area was predominantly characterized by micro and small-scale enterprises, resulting in relatively low overall electricity consumption. Among the 15 respondents, only two enterprises had adopted solar energy systems. The survey findings indicate that the primary barriers to renewable energy adoption were the high initial installation costs and the absence of subsidies for commercial users.
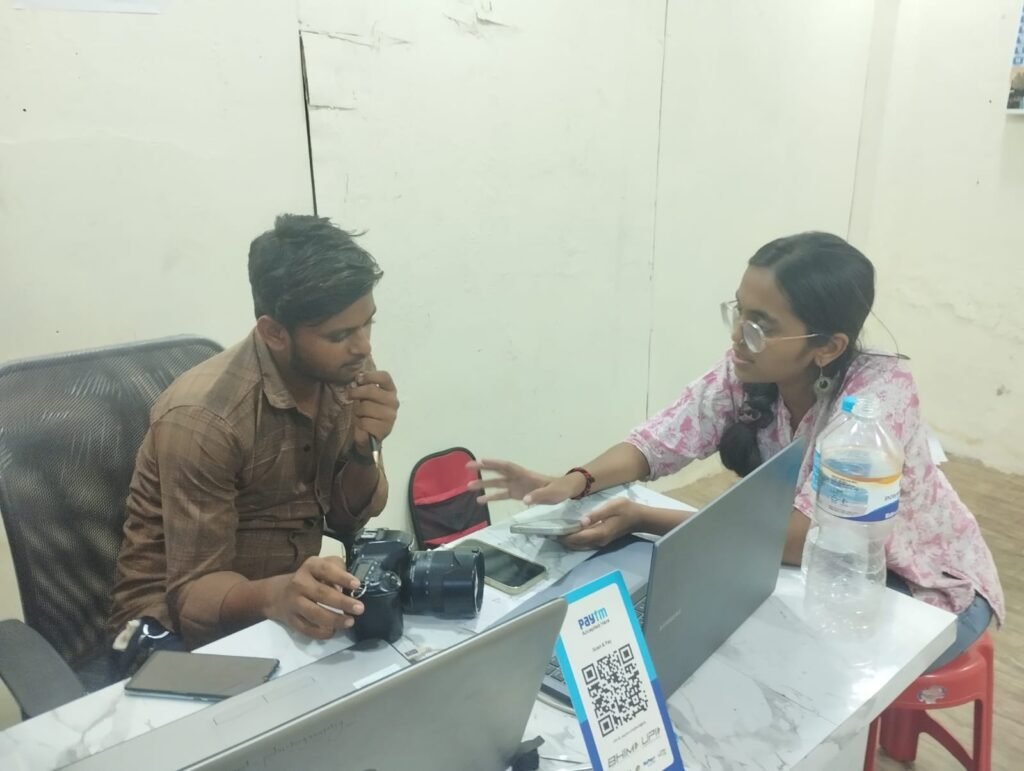
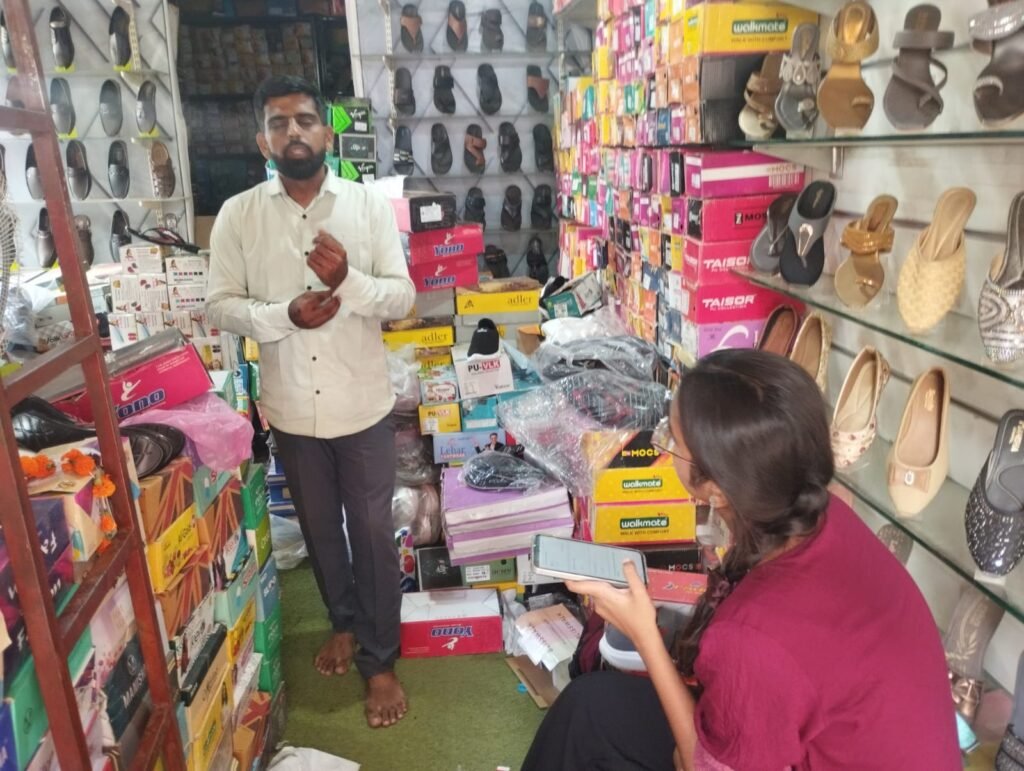
20 and 22 May: Field Survey and Interviews in Pabal
Compared to Loni, Pabal represents a larger and more diverse commercial area, encompassing micro, small, and medium-sized enterprises. Various types of businesses were surveyed, including grocery stores, garages, ice cream parlors, beauty parlors, and trading establishments.
Respondents reported delays in addressing consumer complaints, inefficient management of public street lighting (with some streetlights reportedly remaining operational throughout the day), and unreliable electricity supply. Many business owners indicated that frequent power interruptions and inconsistency in electricity availability negatively affected their operations, with some establishments being forced to close earlier than planned during evening hours.
Opinions regarding voltage quality were mixed. While some respondents talked about significant improvements in voltage stability compared to previous years, others believed that further improvements were still necessary to ensure a reliable power supply.
The survey identified several key factors contributing to the low adoption of renewable energy technologies in the area:
- Limited awareness and understanding of solar energy and other renewable energy sources.
- High installation and capital costs associated with renewable energy systems.
- Lack of adequate space for the installation of solar panels and biomass/biogas plants.
- Concerns regarding maintenance requirements and long-term operational reliability.
- Insufficient availability of animal waste and other feedstock necessary for biomass-based energy production.
25 May: Field Survey and Interviews in Rajgurunagar
The area appeared to be relatively more developed and had higher levels of commercial activity and electricity consumption. Larger establishments, including restaurants, cold storage facilities, and event decoration businesses, were surveyed.
Despite the higher level of development, respondents reported concerns similar to those observed in the other study locations. Voltage fluctuations and unreliable electricity supply were identified as major challenges. Business owners emphasized the importance of a stable and continuous power supply for maintaining productivity and minimizing operational disruptions.
The factors responsible for the low adoption of renewable energy technologies were largely consistent with findings from the previous survey locations. These included:
- High initial investment and installation costs.
- Limited awareness regarding renewable energy technologies and their benefits.
- Administrative and last-mile bottlenecks in accessing government subsidies and support schemes.
- High interest rates on loans.
28 May: Field Survey and Interviews in Kendur
The characteristics of the area were largely similar to those observed in Loni, with the majority of enterprises falling within the micro and small-scale categories. Consequently, the overall electricity consumption in the area was relatively low compared to larger commercial centers such as Pabal and Rajgurunagar.
The respondents were cooperative and generally provided consistent responses regarding their energy consumption patterns and perceptions of renewable energy technologies. Most businesses relied entirely on conventional grid electricity for their energy needs. Among the 20 surveyed enterprises, only one respondent had adopted solar energy, while the remaining businesses reported no use of solar or other renewable energy sources.
The limited adoption of renewable energy technologies in Kendur was attributed to factors similar to those identified in other surveyed locations. Respondents highlighted the high initial investment required for solar installations, limited awareness regarding the benefits and operational aspects of renewable energy systems, and concerns related to maintenance and long-term reliability. Additionally, some respondents expressed the view that their relatively low electricity consumption did not justify the investment in solar energy systems.
Link to the excel sheet of responses collected :
https://docs.google.com/spreadsheets/d/1qGSYuhTYZKA0lANH8A0OALNbvEmsOUyMEbu1vXw8Lfs/edit?usp=sharing
15 June: Organizing and Analyzing Survey Data
By 15 June, the data collection phase was successfully completed, with a total of 100 survey responses gathered from businesses across the selected villages. The responses were compiled into a master Excel spreadsheet to create a structured database for further analysis.
The next step involved cleaning and organizing the data by standardizing responses, handling missing values, and ensuring consistency across variables. Once the dataset was cleaned, a summarized document was prepared to highlight key observations, response patterns, and preliminary findings.
The summarized document is as follows :
Deliverables :
Typology of rural businesses and the energy type they use Assessment of current energy challenges
List of potential use cases for renewable energy among rural businesses

