1. Introduction
Polyhouse cultivation requires controlled environmental conditions to ensure optimal crop growth. Cooling pads are widely used in evaporative cooling systems to regulate temperature and humidity. However, the continuous circulation of water across the pads, combined with sunlight exposure, creates favorable conditions for algae growth.
Why algae is a problem:
1. Clogs pad pores, reducing airflow.
2. Decreases cooling efficiency.
3. Requires frequent cleaning and replacement, raising maintenance expenses.
Therefore, effective algae control is essential for sustainable polyhouse operations.
2. Problem Statement
Cooling pads in polyhouses frequently face algae growth, especially during summer when warm temperatures and high humidity accelerate microbial growth.
- Existing methods (like manual cleaning) are labor-intensive, temporary, and costly.
2. A need exists to identify cost-effective chemical methods for long-term algae management.
3. Objectives
- To study the factors contributing to algae growth on cooling pads.
2. To evaluate lime treatment as a pH-based method for algae control.
3. To evaluate bleaching powder treatment as a chlorine-based method for algae control.
4. To design an experimental setup simulating actual cooling pad conditions.
5. To compare results and recommend the most effective treatment for farmers.
4. Experimental Setup
Materials Required
- Tulu water pumps (for continuous circulation)
- 2 plastic buckets (capacity: 15 liters each)
- cooling pads
- Bleaching powder (Ca(OCl)₂) – chlorine content – 30 %
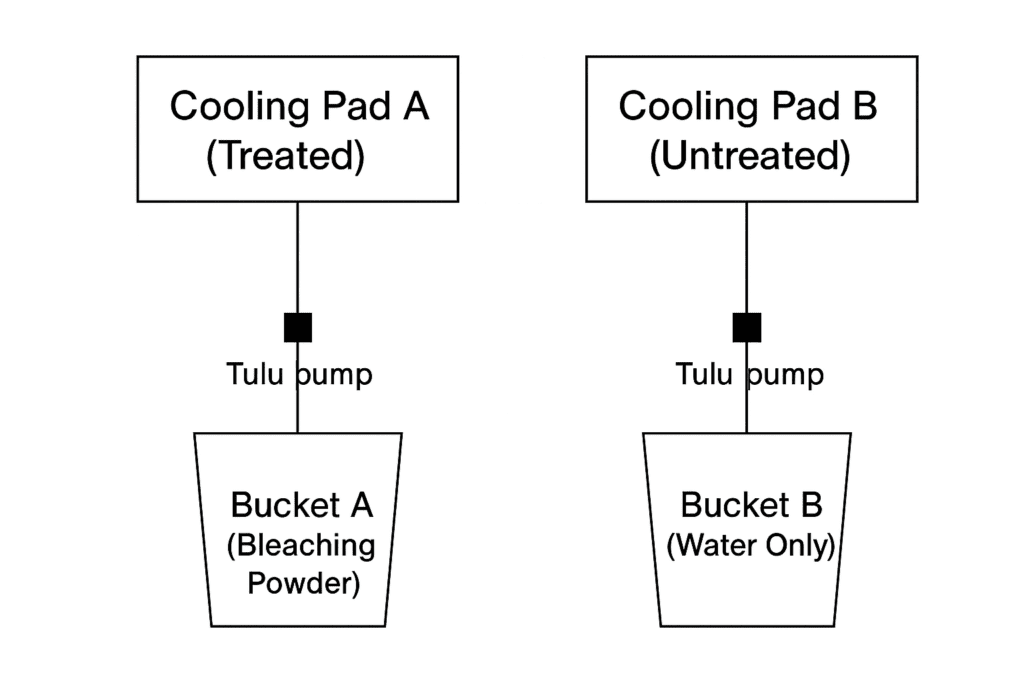
Experimental Setup for Buckets
- Two plastic buckets (15 L each) were prepared:
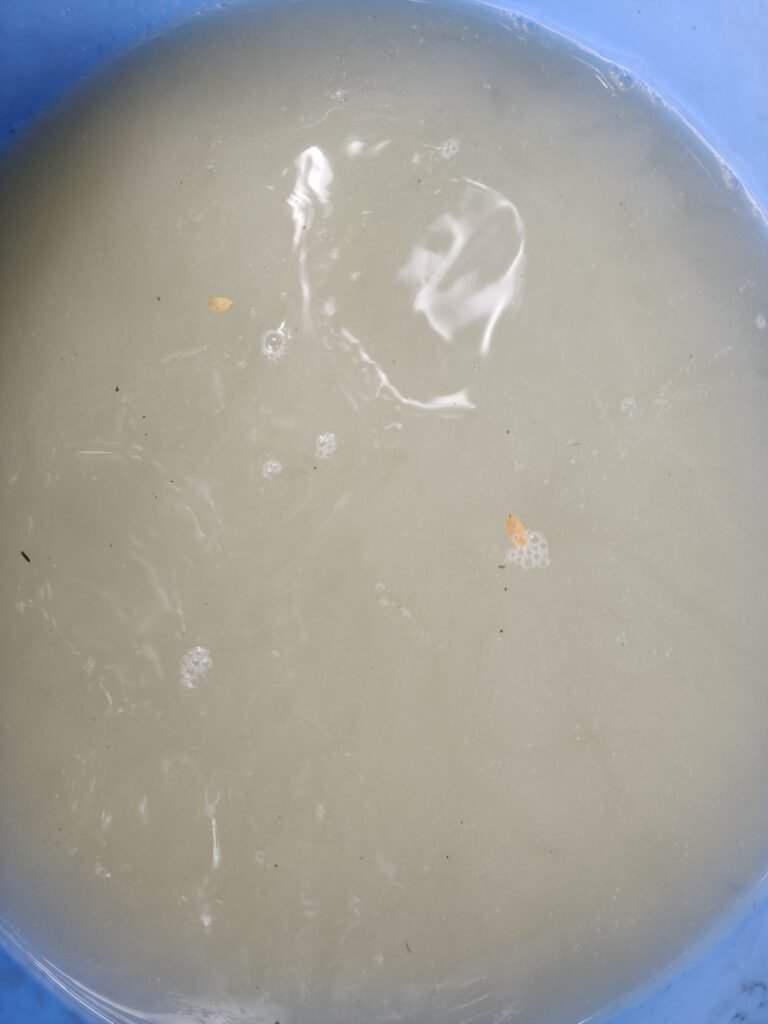
- Bucket A (Treated): Water treated with Bleaching powder
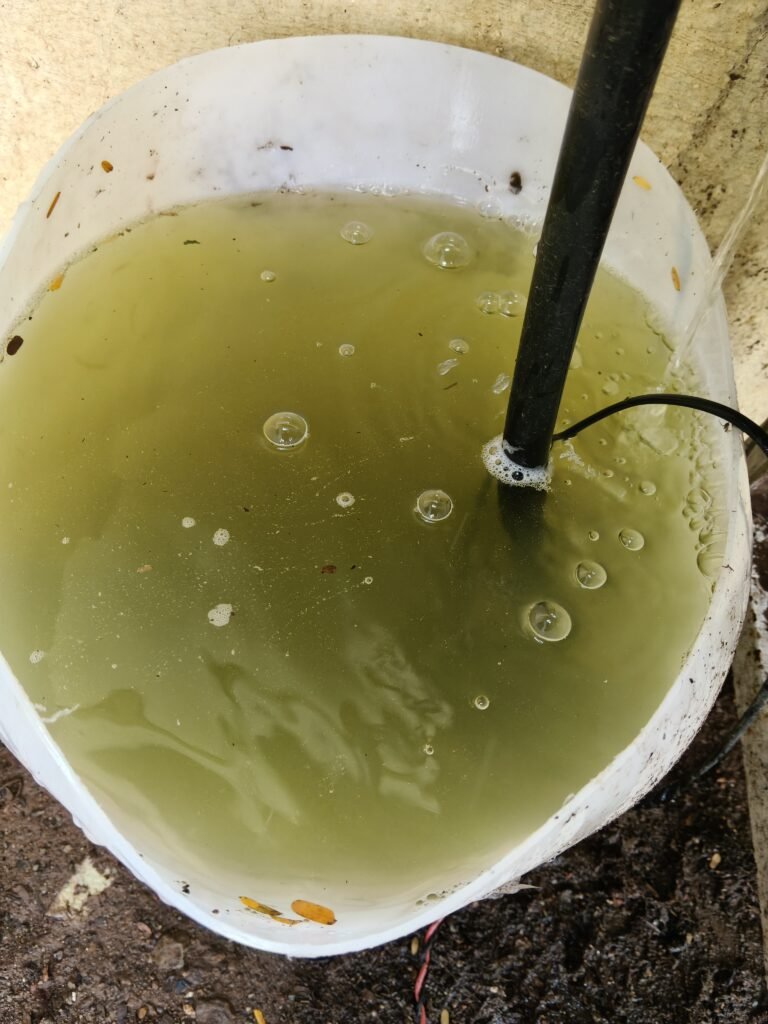
- Bucket B (Control): Untreated water.
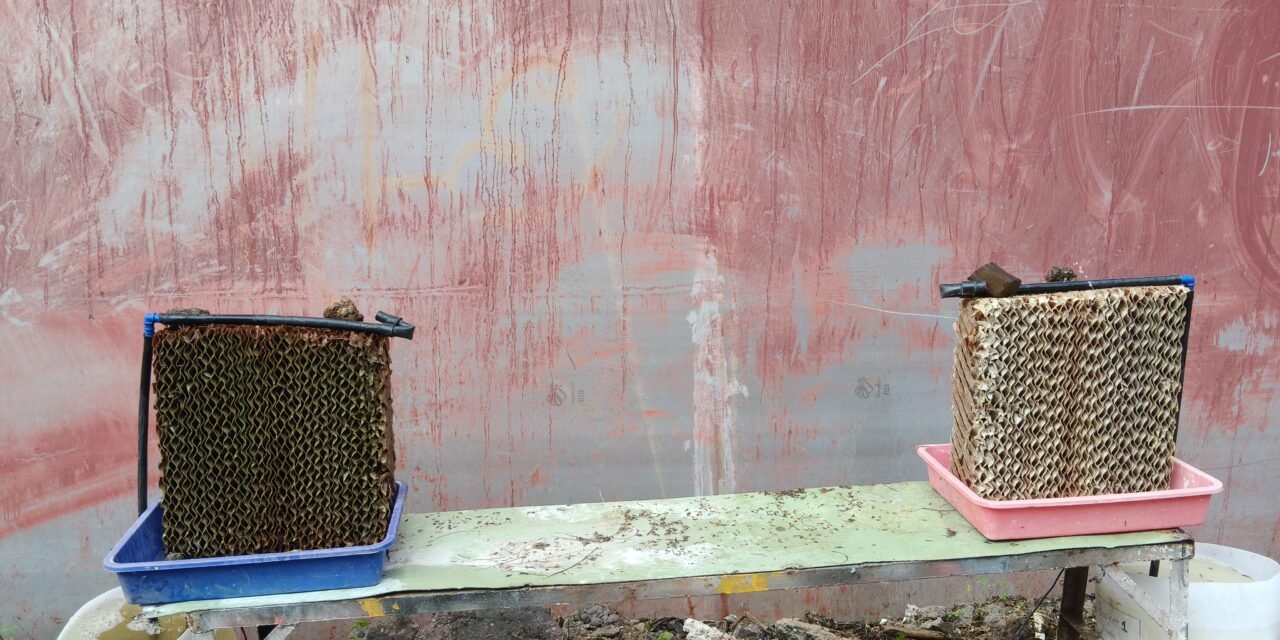
- Cooling pad samples were placed above each bucket.
- Tulu pumps circulated water continuously from the buckets to the top of the pads, simulating real polyhouse cooling systems.
- Both setups were kept in natural light to encourage algae growth.
Bleaching Powder Treatment
Calculation:
Bleaching powder containing ~30% chlorine
We want 100 ppm and 1 gm/lit Conc. of chlorine
Therefore , 0.1 %
Required available chlorine = 15 lit × 1 gm/lit =15 gm
Bleaching powder required = 15 / 0.30 = 50 gm
Bleaching powder was dissolved and added to Bucket A (Treated), while Bucket B remain untreated.
Pad Size : Height (H) = 40 Cm = 0.40 m
Width (L ) = 32 Cm = 0.32 m
Area (A) = Height x Width
A = 0.40 x 0.32 = 0.128 m 2
Pad Area = 0.128 m2
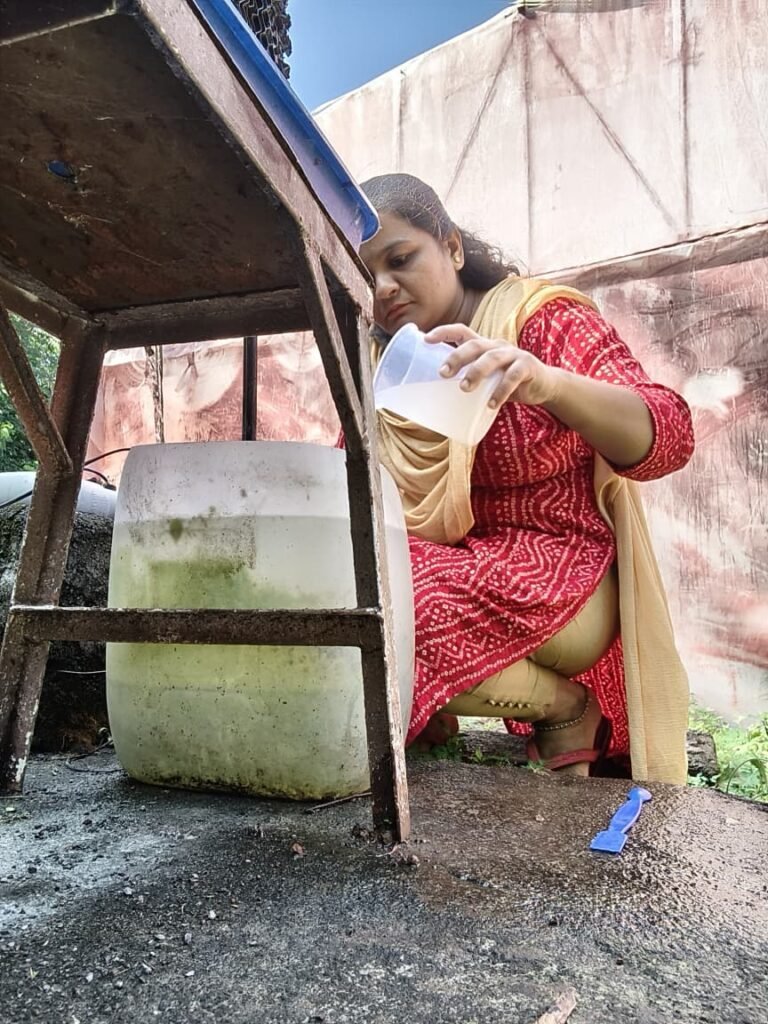
Methods to Measure Algae Growth
1. Visual Observation & Scoring (Simple, Low-Cost)
Inspect the cooling pad surface daily.
Assign scores based on algae coverage:
Algae Growth Observation :
Please refer to the above link to view observations :
Link of Visual Observation photos of Algae Growth :
https://drive.google.com/file/d/1cItXR7z6sIo-eG-YEjuXrMfWj_a-6Zq6/view?usp=sharing
| Week No. | Date | Notes/Remarks (color, patch location, spread, etc.) | |
| Treated Water | Untreated Water | ||
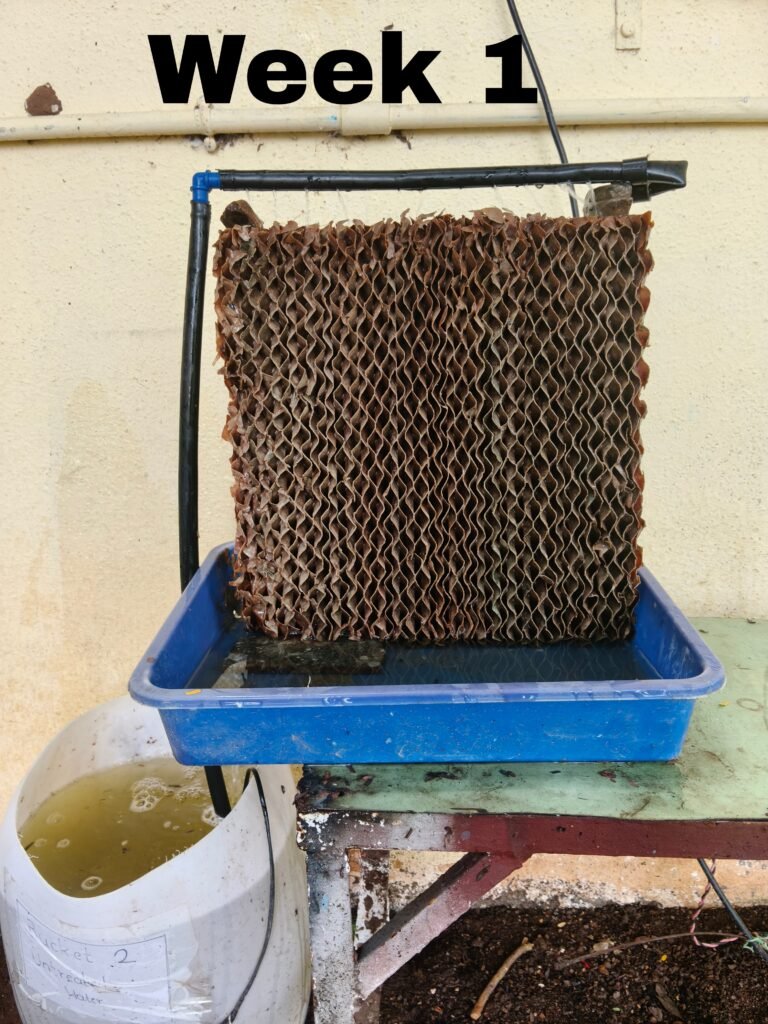
| Week 1 | 13/09/2025 | No algae visible | Cooling pad is clean and dry; no visible algae growth. Cellulose structure fully visible. |
| Week 2 | 20/09/2025 | No algae visible | Slight darkening observed at the lower edge of pad, no visible algae yet. |
| Week 3 | 27/09/2-25 | No algae visible | Thin green film starts forming at the base and corners. Early algae colonization seen on continuously wet areas. |
| Week 4 | 4/10/2025 | No algae visible | Green colouration noticeable on lower half of the pad. Algae spreading upward. |
| Week 5 | 11/10/2025 | No algae visible | Moderate algae growth; patchy green and brown zones visible. Slight clogging observed . |
| Week 6 | 18/10/2025 | No algae visible | Dense green growth on 60–70% of surface. Top area still cleaner. |
| Week 7 | 25/10/2025 | No algae visible | Algae layer thickens and turns darker green to brownish-green. Airflow through pad slightly reduced; slime accumulation visible. |
| Week 8 | 1/11/2025 | No algae visible | Full pad covered with thick green film. Flow resistance increased; detached algae seen floating in tray water. |
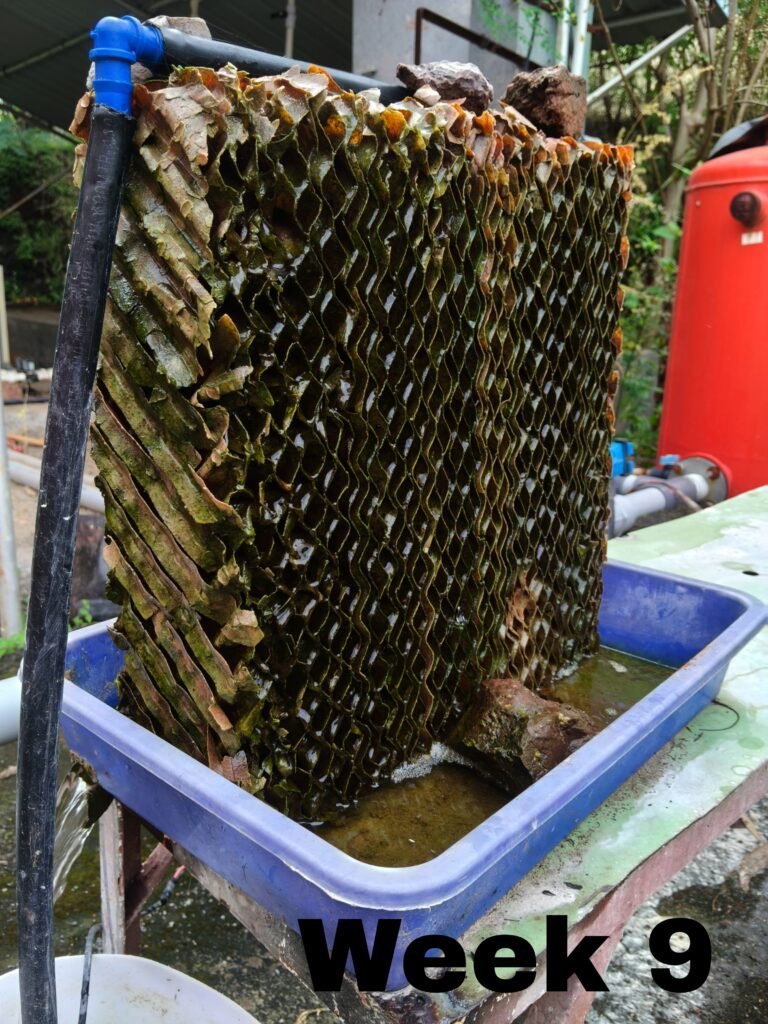
| Week 9 | 8/11/2025 | No algae visible | Thick, mature algae layer across pad. Greenish-brown colouration, clogged structure notice. |
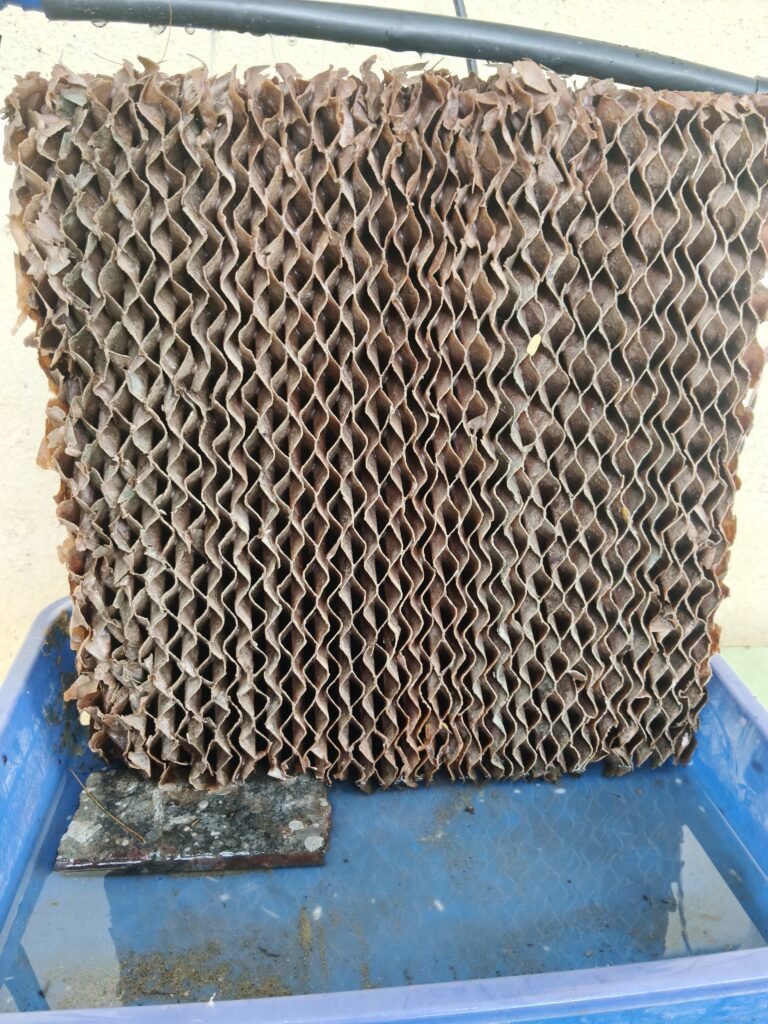
| Week 10 | 15/11/2025 | No algae visible | Complete algae mat formation. Brownish-green thick layer blocks airflow. Strong odour of algae noticable. |
This method is subjective but easy and practical for farmers.
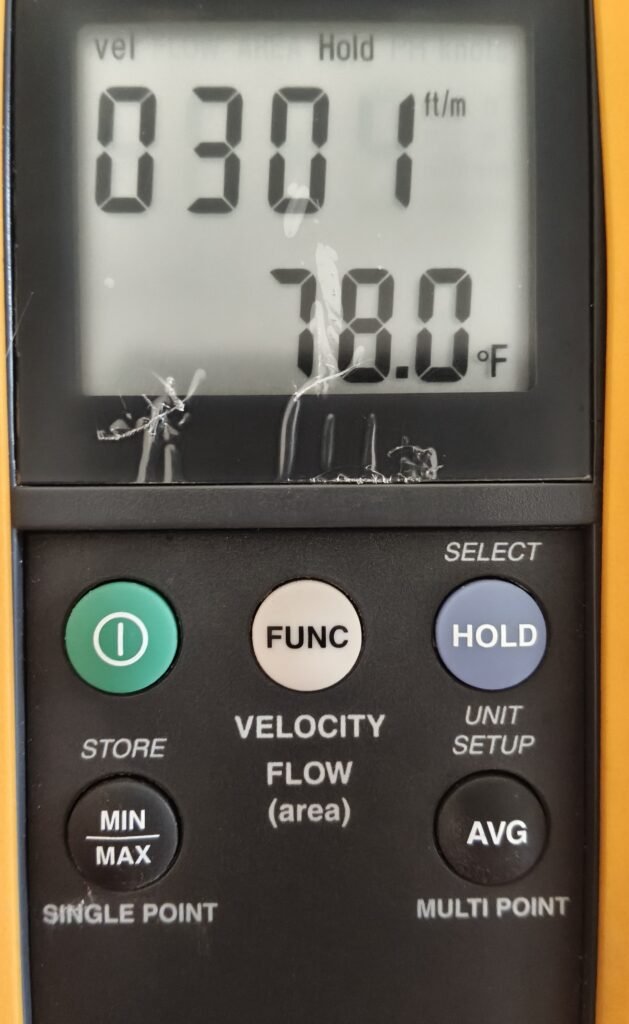
2. Measuring Airflow with Anemometer
Why?
Algae clog the pores of cooling pads.
When pores are blocked, airflow through the pad decreases.
An anemometer (which measures wind speed/air velocity) can directly quantify this effect.
How to Use It
Place the anemometer behind the cooling pad (air outlet side).
Measure air velocity (m/s) at the start (Day 0 – Onwards) when pads are clean.
Compare airflow reduction in treated water or untreated water
Record air velocity values (m/s) in a table :
Please refer to the below link to view further observations
| Week No. | Date | Treated Water (Velocity m/s) | Reduction % (Treated Water) | Untreated Water ()Velocitym/s_ | Reduction % (Untreated Water) |
| week 1 | 13-09-2025 | 1.57 | 0% | 1.57 | 0% |
| week 2 | 20-09-2025 | 1.57 | 0% | 1.55 | 1.27% |
| week 3 | 27-09-2025 | 1.57 | 0% | 1.52 | 3.18% |
| week 4 | 04-10-2025 | 1.55 | 1.27% | 1.5 | 4.45% |
| week 5 | 11-10-2025 | 1.55 | 1.27% | 1.48 | 5.73 % |
| week 6 | 18-10-2025 | 1.55 | 1.27% | 1.45 | 7.64 % |
| week 7 | 25-10-2025 | 1.55 | 1.27% | 1.38 | 12.01% |
| week 8 | 01-11-2025 | 1.52 | 3.18% | 1.27 | 19.10 % |
| week 9 | 08-11-2025 | 1.52 | 3.18% | 1.21 | 22.92 % |
| week 10 | 15-11-2025 | 1.47 | 6.36% | 1.18 | 24.84 % |


20 September 2025 :
On 20th September, there was a discussion with Dixit Sir about the algae experiment. Sir checked the observations of the past 7 days and told me to continue taking observations.
1 Oct 2025
Dixit sir told me to measure the airflow of the old polyhouse cooling pad with the help of an anemometer. I measured it in 5 sections as follows :
| Section of cooling pad of old polyhouse | Readings (ft/min) | Mean (ft/min) | Mean (m/s) |
|---|---|---|---|
| Section 1 | 106, 138, 157 | 133.7 | 0.68 |
| Section 2 | 204, 170, 147 | 173.7 | 0.88 |
| Section 3 | 87, 80, 108 | 91.7 | 0.47 |
| Section 4 | 123, 140, 90 | 117.7 | 0.60 |
| Section 5 | 0, 0, 87 | 29.0 | 0.15 |
| Overall | — | 109.1 ft/min | 0.55 m/s |
Cooling pad observation :
| Section of cooling pad of old Polyhouse | Airflow (m/s) | Observed Algae Growth | Observation/Interpretation |
|---|---|---|---|
| Section 1 | 0.68 | Moderate | Airflow is decent, algae growth is moderate. |
| Section 2 | 0.88 | Low | High airflow reduces algae accumulation. |
| Section 3 | 0.47 | Moderate | Lower airflow than Sections 1 & 2, moderate algae growth. |
| Section 4 | 0.60 | Moderate | Airflow is sufficient, algae growth not severe. |
| Section 5 | 0.15 | High | Very low airflow → stagnant area → algae growth highest. |
| Overall | 0.55 m/s | – | Average airflow moderate; algae growth varies by section. |
10 Oct 2025
On 10th October, Dixit sir checked the cooling pad of the algae experiment. In visual observation, the algae growth is clearly visible, but there is not much change in the air flow on a daily basis, so sir told me to take weekly observations.
26 OCT 2025
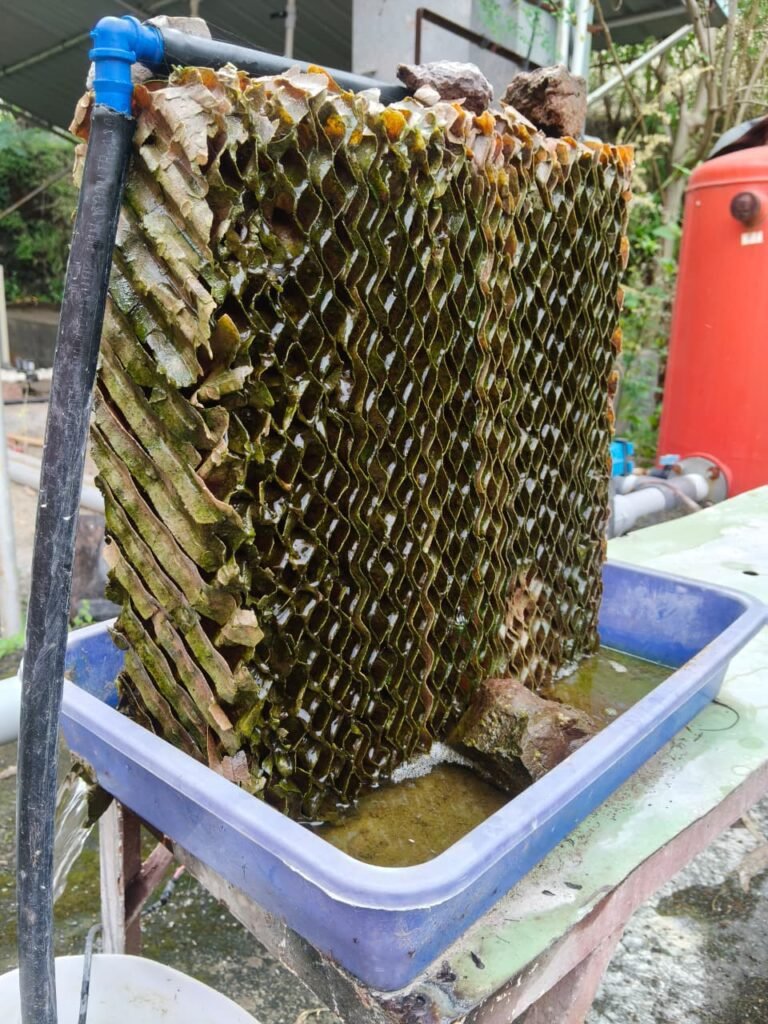
On 26th October, a discussion was held with Dixit Sir and Abhijeet Sir ,the algae experiment was discussed in detail. In this experiment, the final calculations, conclusions, or results could not yet be obtained because the algae growth on the cooling pad was not as expected. Although the algae have fully covered the surface of the cooling pad, the holes are still not completely blocked. Therefore, to enhance and accelerate the algae growth, various measures—such as the application of fertilizers or other nutrients—were discussed with the sir during the meeting .
1 Nov 2025
Objective: To boost algae growth for comparison with the bleaching powder treatment.
- Urea: 1 gram per liter → 20 grams for 20 L
- SSP: 1 gram per liter → 20 grams for 20 L
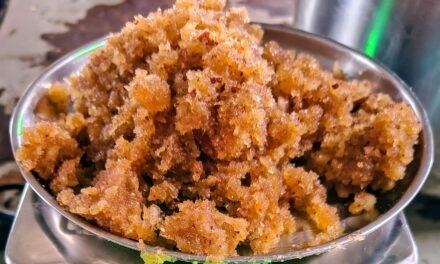
7 Nov 2025
Algae growth photo after Addition of urea in untreated water .

16 Nov 2025
On 16th November, Kulkarni Sir checked my blog on the algae experiment on the cooling pad. His feedback was that there is no conclusion on the algae growth in the cooling pad experiment.
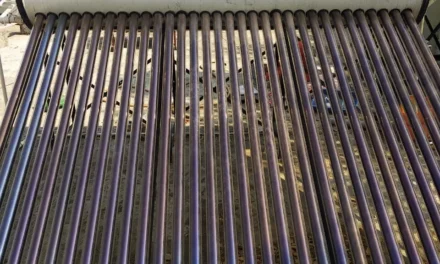
Untreated Algae Growth on Cooling Pad
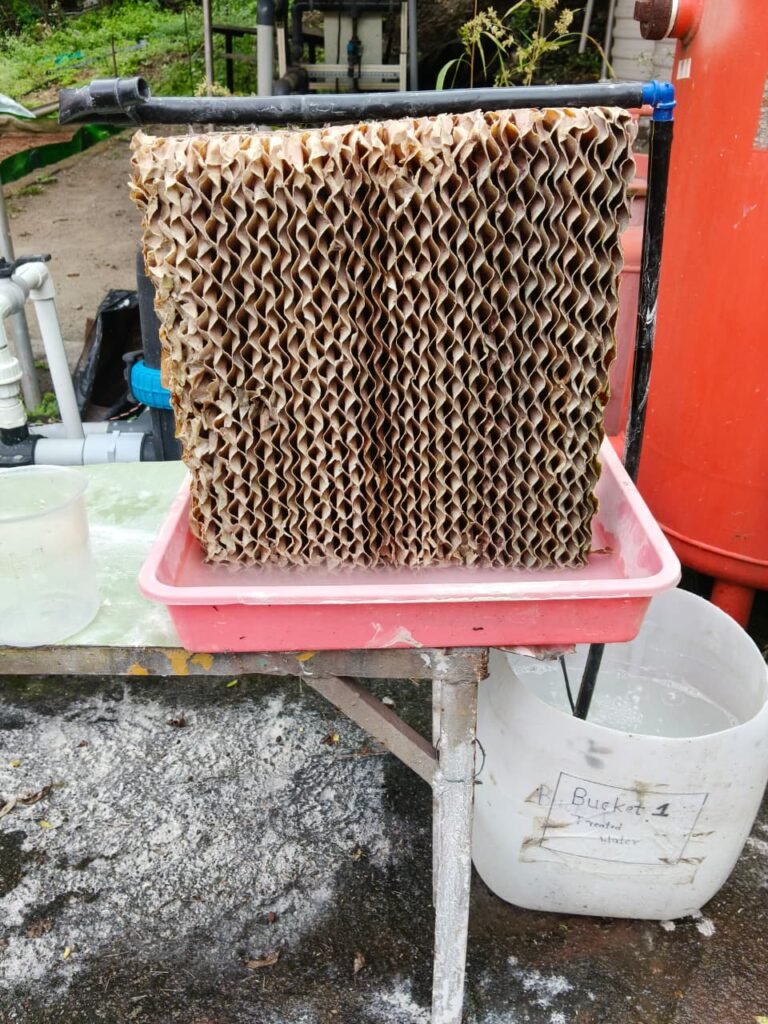
Treated Water Algae Growth Observation :
Link of Visual Observation photos of Algae Growth :
https://drive.google.com/file/d/1cItXR7z6sIo-eG-YEjuXrMfWj_a-6Zq6/view?usp=sharing
27 Nov 2025
Conclusion: Algae Growth on Cooling Pads (Based on Airflow Observation and Reduction Percentage)
The experiment aimed to study the effect of algae growth on the performance of cooling pads by measuring airflow velocity over a period of 10 weeks using an anemometer. The comparison was made between two systems — one using treated water( Bleaching Powder) and the other using untreated water.
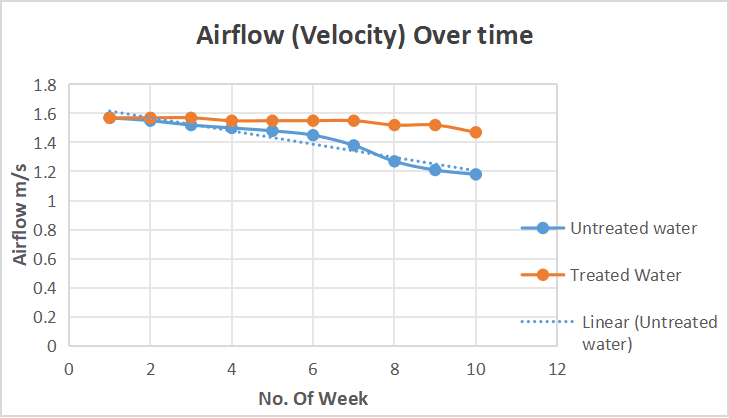
1. Airflow (Velocity) Analysis
- In the Untreated water setup, the airflow velocity gradually decreased from 1.57 m/s in Week 1 to 1.18 m/s by Week 10.
This represents a 24.84% reduction in airflow. - In contrast, the Treated water() system maintained a nearly steady airflow, decreasing only slightly from 1.57 m/s to 1.47 m/s, which corresponds to a 6.36% reduction.
- The trend clearly indicates that untreated water led to faster clogging of pad pores, reducing air movement efficiency over time.
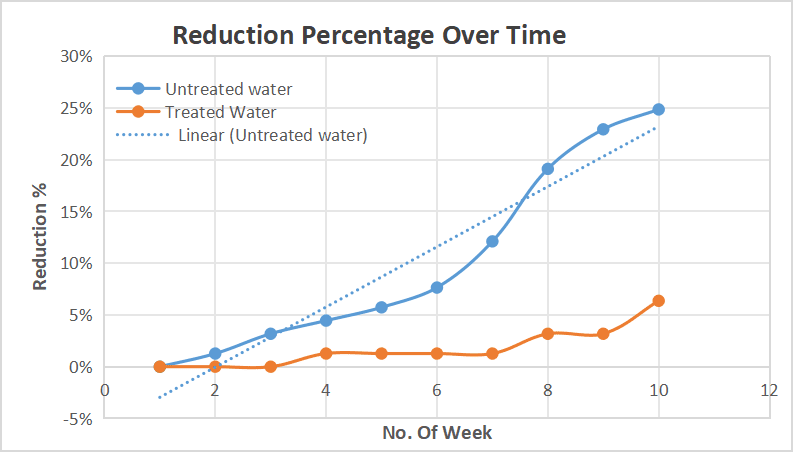
2. Reduction Percentage Analysis
- The reduction percentage graph shows a continuous and steep increase for the untreated pad, while the treated pad shows only a slight rise toward the end of the observation period.
- After 6 weeks, the untreated pad had already shown around 7–8% reduction, which continued to rise rapidly, reaching nearly 25% by the 10th week.
- The treated pad, however, maintained low reduction levels (below 5%) for most of the duration, demonstrating the effectiveness of the treatment.
In the treated system, the use of anti-algae or biocidal treatment inhibited algal formation, thus maintaining the porosity of the pads and consistent airflow.
Untreated water systems are highly susceptible to algae formation, leading to decreased airflow velocity and poor cooling performance over time.
Treated water systems show a clear advantage, maintaining better airflow, cleaner pad surfaces, and improved long-term performance.
Therefore, the use of treated or anti-algae water is highly recommended in evaporative cooling systems to prevent biological clogging, enhance cooling efficiency, and extend pad lifespan.
