Introduction
In Vigyan Ashram, one project is to develop a fully automated greenhouse. One concern is to predict and detect crop disease to treat plants before it spreads. I have programmed a convolutional neural network to distinguish pictures of fresh leaves and plants from diseased ones.
This project has been programmed on google.colab notebook with the dataset stored on Fablab google drive account (https://drive.google.com/drive/folders/1DyaJuueJhbIXRLWST4kSMp92DpmgspZk?usp=sharing)
Convolutional neural network
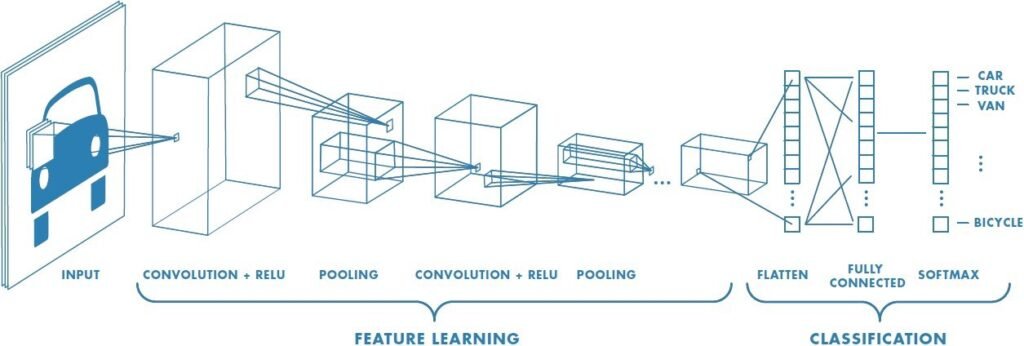
CNN is a deep learning detection algorithm able to recognize complex patterns and name the nature of the information it receives.
Before being able to do so, the algorithm must train with a sufficiently important dataset so that it can figure out the key aspects of the information that it must focus on. The pictures are associated to a class label.
Firstly, the CNN model randomly guesses to what class the picture belongs. Then it improves and sharpens the parameters called weights as it goes through the training dataset to minimize the error loss. At the end of every training loop, the algorithm tests its model on the testing dataset. The algorithm saves the best model out of the number of epochs representing the complete passes through the training dataset. Hopefully, you have a high accuracy model by the end of the algorithm.
My model works with 3 hidden layers each composed of a 2 dimension convolution, a 2 dimensions batch normalization and a ReLU (Rectified Linear Unit) function as activation function. The loss function is a cross entropy based.
Choice of hyperparameters
There are two main hyperparameters :
- Learning rate : defines how much we improve the new weights according to the previous loss results. It is the step size of the gradient descent. If the learning rate is too small the computation is costly and might get stuck in local optimum. If on the other hand, it is too high, the gradient descent might diverge and never reach any optima.
- Batch size : defines the number of samples to work through before updating the internal model parameters.
These hyperparameters are defined from testing. In my case I have set a learning rate of 0.001 and a batch size of 32 which is smaller than my training dataset length meaning that we run a mini-batch gradient descent. I tried to implement a greater learning rate but the model was too slow to be generated and the results were not significantly better.
Dataset format
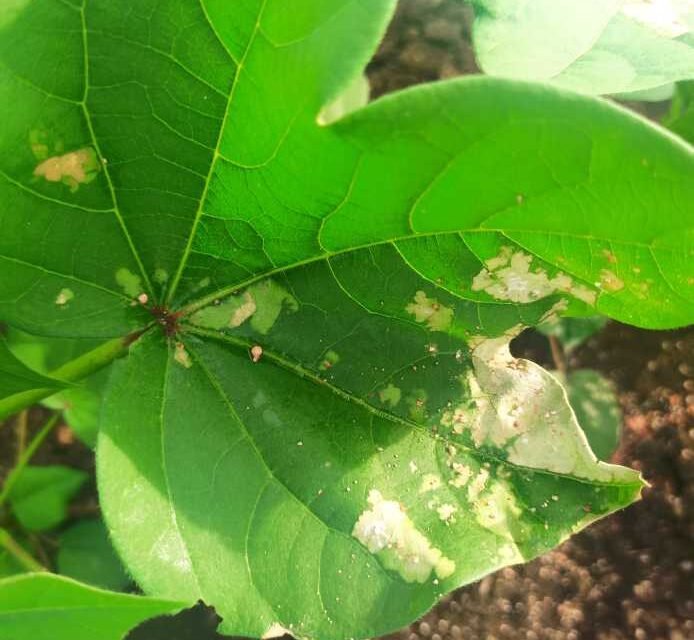
My dataset comes from kaggle.com and represents cotton plants in four different situations : diseased leaf, diseased plant, fresh leaf and fresh plant.

The dataset is composed of 1951 training pictures (A. 288, B. 815, C. 427 and D. 421), 106 testing pictures (A. 25, B. 28, C. 26 and D. 27) and 253 validation pictures (A. 43, B. 78, C. 66 and D. 66).
My google.colab is linked to fablab’s drive in which all these pictures are stored.
To analyze these datasets, i had to resize and normalize my pictures to decrease the number of information to treat and speed the algorithm up.
Results
The programs shows results after every epochs and draw a final chart to highlight improvement. Only the model with the best test accuracy continues to validation step.
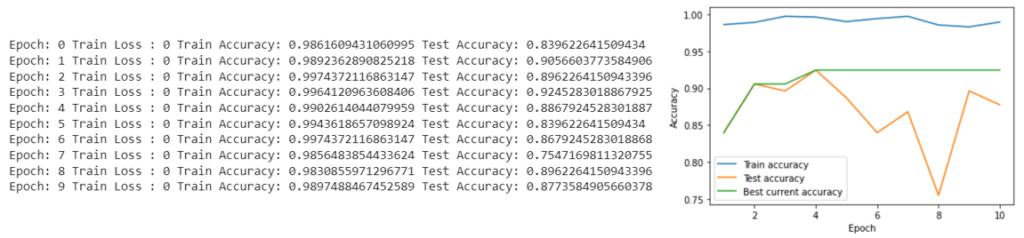
After validation of some models with learning rate = 0.001, batch size = 32 and 10 epochs, I find a constant 90% accuracy.
| Diseased leaf | Diseased plant | Fresh leaf | Fresh plant | Total | |
| Number of pictures | 43 | 78 | 66 | 66 | 253 |
| Good predictions | 41 | 76 | 61 | 50 | 228 |
| Accuracy | 95.35 | 97.44 | 92.42 | 75.76 | 90.12 |
| Diseased leaf | Diseased plant | Fresh leaf | Fresh plant | Total | |
| Number of pictures | 43 | 78 | 66 | 66 | 253 |
| Good predictions | 37 | 69 | 64 | 57 | 227 |
| Accuracy | 86.05 | 88.46 | 96.97 | 86.36 | 89.72 |
| Diseased leaf | Diseased plant | Fresh leaf | Fresh plant | Total | |
| Number of pictures | 43 | 78 | 66 | 66 | 253 |
| Good predictions | 41 | 72 | 59 | 53 | 228 |
| Accuracy | 95.35 | 92.31 | 89.39 | 84.85 | 90.12 |
To keep the best try, I have considered that the best model is the one with the best accuracy and the smallest range according to the different classes. The reason is that for a big range the model might be excellent at predicting one class but awful for a different class.
First and third models have the best accuracy (90.12%) but the latter has the best range with 10.2 against 21.68 for the first try. The third is the most robust model.
A 90% percent accuracy is considered as very good in machine learning. However it means that there are still possible mispredictions. Some of these mispredictions can be explained because of tricky pictures that even human vision can’t tell which class they belong to.
Discussion
It is unrealistic to implement an autonomous camera taking pictures of the plants in the polyhouse due to cost limitation. The finality of this project is to predict and detect crop disease with no pictures, only sensors such as : humidity sensor, temperature sensor, soil moisture sensor, light sensor and carbon dioxyde sensor. It is the most feasible and automated way to detect and predict disease.
To build a robust model, we must collect a great dataset of different environment situations and the relative plant health conditions. We might need hundreds or thousands of unique data which might take several months or years. Data must be diverse, which involves purposely creating favorable conditions for the onset of the disease.
Another idea is to have precise environment conditions for disease appearance and once disease condition occur, alert the user that plants are prone to disease. The major cons of this solution is that you can’t rely with certainty on others studies because the conditions in our polyhouse are unique (pressure, air density, soil nature, mite presence, …). We must do the study on our own in Vigyan Ashram.
