Objectives
- To study existing material generation by ‘Panidar Pabal Samiti ‘ for watershed management .
- To generate / obtain watershed characteristics of study area.
- To suggest the watershed structure by using digital tool according slope map, drainage density map, stream order map and land use land cover map.
Need of study
Pabal always faces water related problems. To solve this, the “Panidar Pabal Samiti” is working for watershed development and water conservation of pabal village. The main focus is on Rainwater harvesting. Rainwater is natural occurence i.e. it is seasonal and irregular thus by conserving or storing water conditions like drought, water scaracity can be avoided and To manage the available water watershed management is needed.
Details of the study area
Pabal is a village in shirur Taluka of pune district. Maharashtra it is located on the globe latitude 18°49’51’N and 074°3’10’E longitude in shirur taluka the total geographical area of pabal village is 3978.81 Hectare/39.78km2. The temperature has relatively high range between 18℃ to 40℃. The village receives average rainfall of 500-600m.
10-03-22 To 17-03-22
Data collection
The “Panidar pabal samiti” is working under the guidance of Dr. Sumant Pandey, Mr. Sarjerao Chaudhary and many more. After contact with them on call, we obtained data like drone videos of study area, project report. It is seen from the report, samiti is working on 3-4 lakes. For this, they are using stream directions, length of streams obtained from the satellite map.
Project report provided by “Panidar Pabal Samiti”
Our methodology
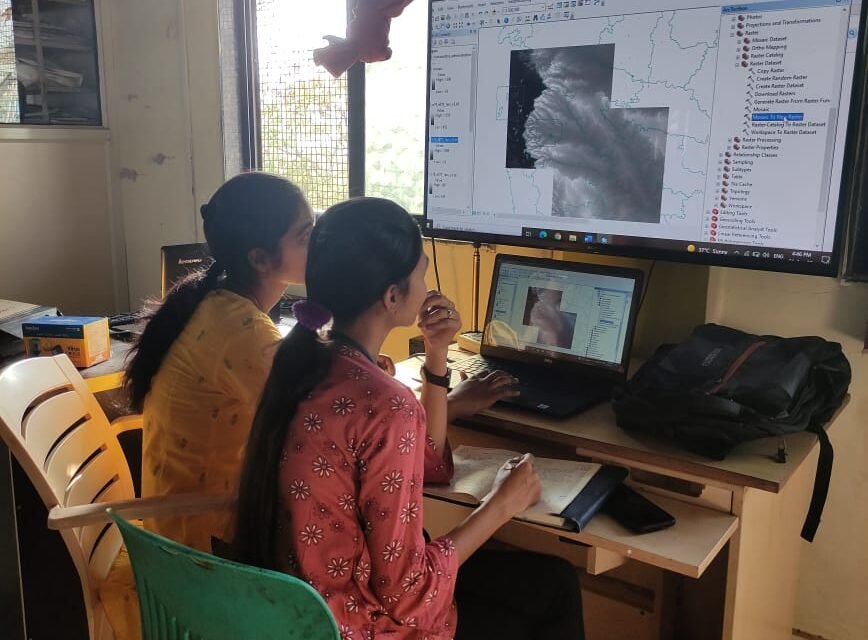
Mapping is to be done of study area i.e. Pabal village using different softwares like Google earth pro, USGS earth explorer, Arc-map. By using the slope maps, stream order maps of pabal created from this softwares different structures are to be suggested.
Different softwares for mapping:
There are different GIS softwares available for mapping like Google eatrh pro, GPS visualizer, USGS earth explorer, Arc-GIS, Q-GIS, Quickgrid, etc. These are utilized to visualize, manipulate, and analyze geospatial data. We have used following softwares:
Google earth pro: This is used to visualize, assess, create/upload geospatial data. It is often used to complement other GIS software.
GPS visualizer: It is free and easy to use. In this input can be in the form of GPS data, simple coordinates and can be converted into GPX, CSV.
Arc-map 10:7:1:– It is one of the application of Arc-GIS used to view, edit geospatial data, and create maps with the help of other application like ArcToolbox.
USGS earth explorer: The United States Geological Survey EarthExplorer is the primary portal for the publicly available space-borne imagery. Global digital elevation models from SRTM can obtained from here. Remotely sensed data of all kinds is available here.
Flowchart of Quick grid

The above flowchart shows the steps to create contour lines using Quick grid. By following this steps contour map of area near the vigyan ashram side is prepared. The fig.2 is area selected near vigyan ashram side from Google earth pro and fig.3 shows the contour lines of that area at 4m interval.


24-03-22 To 28-03-22
After discussion with kulkarni sir, tried a web app https://wikiwatershed.org/model/ ,https://modelmywatershed.org/draw. This are watershed modelling apps which analyzes real land use and soil data in the watershed, model stormwater runoff etc. But it did not worked out.

Fig. Web app for watershed
Using USGS explore and Arc map
The flowchart below shows the process for a clip file. Using this process clip file of Shirur taluka is obtained and from that slope map is prepared.


24/04/2022
Selected study area

For this study, the Pabal village is divided into different areas for ease of work. The areas for which we are working are:
- Pabal Gavthan
- Thapewadi + Pimpalwadi
- Chaudhar bend
- Futanwadi
- Zodagewadi + Aagarkarwadi

Process flow chart for stream order, drainage density, slope map.
Preparations of Various Maps
Slope map
Slope is one of the factors that control the infiltration of rainwater in to sub surface. In gentle sloping areas the surface runoff is slow allowing more time for rainwater to percolate, whereas, steep slope area facilitates high runoff allowing less residence time for rainwater to percolate.

The slope map of Pabal watershed was derived from the digital elevation map in Arc GIS. It has highest elevation 834 m and lowest elevation 650 m. The slope of the area was classified in to Nearly to level (0-1%), Very gently sloping (1-3%), Gently sloping (3-8%), Moderately sloping (8-15%), Moderately steep (15-30%), Steeply sloping (30-50%) and very steeply sloping (>50%). Slope map of this area has been prepared from ArcGIS. The maximum area is covered by nearly level and very gently sloping.
The area having nearly to level (0-1%) slope are suitable for farm pond and percolation tank. Percolation tanks are the structure for recharging groundwater. The suitable temporary, semi- permanent and permanent structures were proposed in the plan. Based on this map the activities can be implemented may ultimately solve the water related crises in the area.
Stream Order Map
Stream orders are essential in the planning of conservation measures in terms of storage and capacity. They develop where the channel follows the slope of the terrain. After drainage identification, orders are assigned to each tributary and sub-tributary respectively. Drainage ordering represent the number of streams presents in each order defined i.e., 1, 2,3,4,5 and 6 stream orders. 1, or 2 order streams are suitable Percolation Tank. 3 or 4 order streams are suitable for Check Dams and Nala bund. 1, 2, or 3 order streams and greater slope are suitable for contour trenches.

Stream order map was prepared by using ArcGIS. All the streams existing in the study area were marked on map. These streams were further classified based on stream ordering. Up to seven order streams exist in the study area.
Drainage density map
Drainage density is the indicator of drainage efficiency of the watershed. The lowest and the highest values of Drainage Density are 4084 and 7808.33 for sub-watersheds. Drainage density is the closeness of spacing of stream channels. It is the total length of all streams and Rivers in a drainage basin divided by the total area of the drainage basin. It has long been considered a fundamental property to describe how well or how poorly a watershed is drained by stream channels. This is map of Drainage Density of Pabal Village.
