Introduction
When I joined Vigyan Ashram, I got the opportunity to work on an active polyhouse cooling optimization project. At first, it looked simple: a polyhouse with exhaust fans and cooling pads. But once I started observing its behavior, I realized the system was much more complex.
A polyhouse is supposed to create a controlled environment for plant growth by regulating temperature, humidity, and airflow. But here, even with multiple exhaust fans running, the inside temperature was rising to 44–46°C during peak afternoon hours.
That raised a simple but important question:
Why was the cooling system not performing as expected?
That question became the starting point of my work.
Objective
The main objective of this project was to understand why the fan-pad cooling system was underperforming and optimize the airflow inside the polyhouse.
The key goals were:
- Study airflow patterns inside the polyhouse
- Identify leakage points
- Analyze thermal behavior during solar loading
- Improve air distribution
- Validate cooling performance through experiments
- Develop a data-driven control strategy for operating the cooling system efficiently
Initial Research
Before making any modifications, I first focused on understanding the basic science behind the system.
I studied:
- Greenhouse effect inside enclosed structures
- Heat transfer through poly film
- Thermal buoyancy and air density changes
- Evaporative cooling principles
- Fan-pad cooling mechanics
- Air leakage and pressure distribution
- Psychrometric behaviour of temperature and humidity
I also discussed these concepts with Arun Sir, Anand Sir and IIT Bombay mentors while comparing field observations with theory.
One thing became clear very early:
Airflow is not only about fan capacity. It is about pressure distribution and controlling the path through which air travels.
That changed the way I started looking at the whole polyhouse.
Project Progress
05 June 2026 – Understanding Airflow
My first task was conducting smoke tests.
Smoke helped visualize how air was actually moving inside the polyhouse.
What I observed
- Airflow was highly non-uniform.
- Some regions had stagnant air.
- Near the center, smoke was rising vertically instead of moving horizontally toward the exhaust fans.
This was my first real clue.
06 June 2026 – Understanding Thermal Buoyancy
To verify the previous observations, we repeated smoke tests during the evening.
Interestingly:
- Afternoon smoke rose upward.
- Evening smoke moved almost horizontally toward the fans.
Arun Sir explained that cool air entering the polyhouse gets heated by solar radiation, becomes lighter, and rises because of thermal buoyancy.
This was my first practical lesson in thermodynamics.
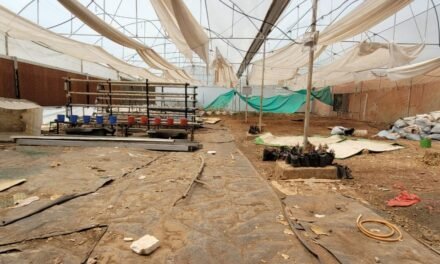
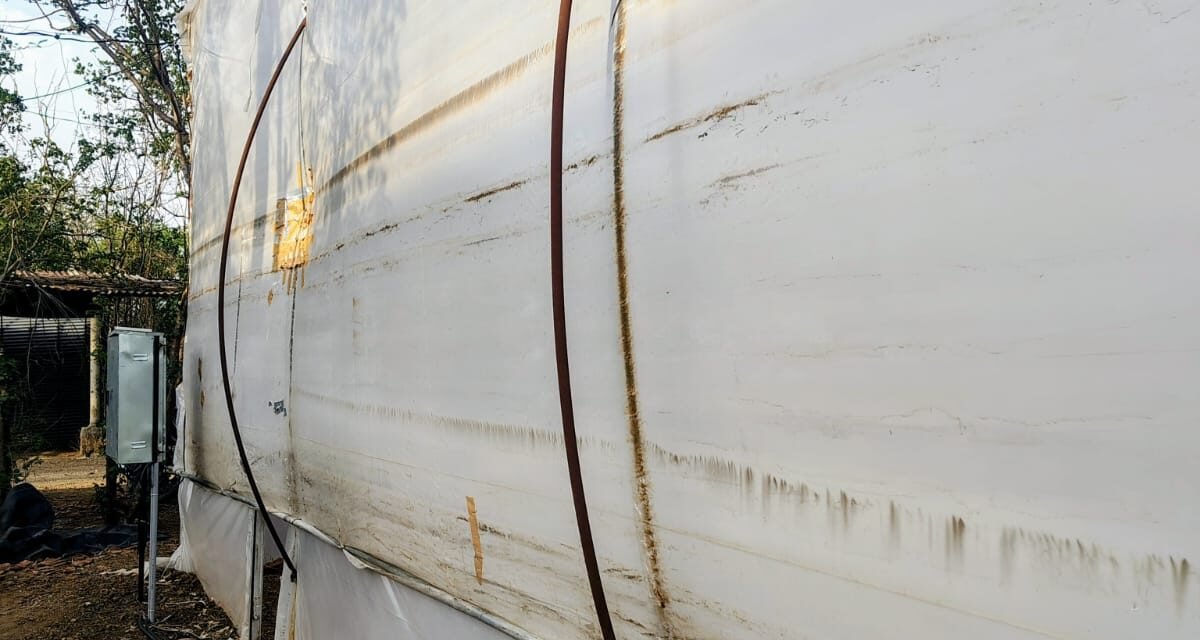
During the same study, we also identified major air leakage paths through damaged poly-film joints and structural openings.
07 June 2026 – Quantifying Airflow
After visual observations, I started measuring airflow using an anemometer.
Measurements were taken near:
- Exhaust fans
- Cooling pads
- Center of polyhouse
- Structural leakage points
Results
- Strong airflow near fans
- Almost negligible airflow at the center
- Very low airflow near cooling pads
- Major leakage through damaged film joints and gate opening
Instead of following the intended path:
Cooling Pad → Crop Zone → Exhaust Fans
air was taking shortcuts through leakages.
That explained the poor cooling performance.
08 June 2026 – Leakage Identification and Fixing
Corrective work began.
Activities included:
- Sealing poly-film gaps
- Closing structural corner openings
- Repairing electrical connections
- Reducing major leakage paths
Subsequent measurements showed:
- Side leakages reduced significantly.
- Fan-side airflow improved.
- Gate opening became the dominant remaining leakage path.
This taught me another engineering lesson:
Fixing one problem often reveals the next limiting factor.
09–15 June 2026 – Thermal Logging Experiments
This phase provided the strongest understanding of the thermal behavior.
Experiment 1 – Fans ON, Pads OFF
Temperature gradually increased throughout the morning and still reached 44–45°C.
This showed that:
Fans alone cannot counter peak solar loading.
Experiment 2 – Fans ON, Pads ON
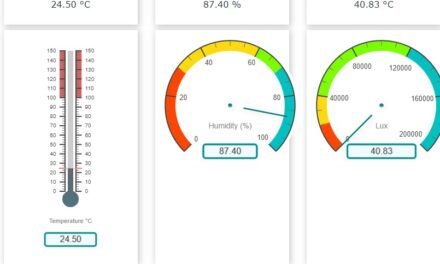
Turning on the cooling pads reduced temperature by approximately 5–6°C within 20 minutes, while humidity increased sharply.
This confirmed that the evaporative cooling system was functioning effectively.
Experiment 3 – Wet Soil + Fans ON
To study the influence of ground heat, I drenched the soil before sunrise.
The temperature rise slowed by 1–3°C, showing that soil moisture contributes to latent cooling and reduces sensible heat emitted from the ground.
16 June 2026 – Internal Air Circulation
An adjustable circulation fan was tested at different locations:
- Near cooling pads
- At the center
- Near exhaust fans
The fan improved air mixing but produced only marginal improvement in cooling.
This reinforced an important concept:
Better mixing does not necessarily mean better cooling.
17 June 2026 – Gate Leakage Analysis
One important question arose:
How much air was actually entering through the gate?
The measured airflow through the observed opening was approximately 93 CFM.
Although the calculated flow appeared small, discussions with Arun Sir highlighted that distributed gaps could contribute much larger leakage.
More importantly, even small leakage paths disturb the intended pressure distribution and create airflow short-circuiting.
19 June 2026 – Documentation
Compiled all observations, airflow measurements, thermal analysis and experimental results into a technical report for discussion with mentors.
20 June 2026 – Gate Modification
To eliminate uncontrolled air entry, the gate was modified to open outward.
This structural modification was expected to improve the intended pad-to-fan airflow path.
22 June 2026 – Comparative Cooling Experiment
A controlled experiment was conducted under multiple operating conditions:
- All systems OFF
- Fans ON
- Fans + Adjustable Fan
- Fans + Pads
The observations clearly showed:
- Fans improved sensible heat removal.
- Adjustable fan improved internal circulation.
- Cooling pads produced the strongest temperature reduction together with a large increase in humidity.
23 June 2026 – Validation After Structural Modifications
The previous experiment was repeated after leakage reduction and gate modification.
Additional measurements included:
- Solar radiation
- Outdoor wind speed
- Indoor and outdoor temperature
- Indoor and outdoor humidity
- Indoor–outdoor temperature difference (ΔT)
The results confirmed improved airflow distribution while again demonstrating that evaporative cooling remained the dominant cooling mechanism.
24 June 2026 – Data Analysis
The complete datasets collected on 22 and 23 June were analyzed.
Comparative plots were generated for:
- Temperature
- Relative humidity
- Solar radiation
- Wind speed
- Indoor–outdoor temperature difference (ΔT)
This helped quantify the cooling contribution of each operating mode.
25 June 2026 – Holiday
No project work was carried out.
26 June 2026 – Experimental Validation
To verify the repeatability of previous observations, the complete experimental sequence from 22 and 23 June was repeated under similar environmental conditions.
The objective was to ensure that the observed cooling trends were consistent and reproducible.
27 June 2026 – Comparative Study
The observations from 22, 23 and 26 June were compared.
The comparison showed consistent thermal response under similar operating conditions, increasing confidence in the experimental methodology.
28–29 June 2026 – Planning the Next Phase
After discussing the results with Arun Sir, we concluded that the project should now move beyond structural optimization toward developing an intelligent operating strategy.
The next phase would focus on:
- Quantifying the standalone contribution of exhaust fans through controlled Fan ON and Fan OFF experiments.
- Identifying environmental parameter ranges where each operating mode performs best.
- Developing an automatic control strategy based on:
- Solar irradiance
- Outdoor wind speed
- Outdoor temperature
- Indoor temperature
- Outdoor relative humidity
- Indoor relative humidity
29 June – 1 July 2026 – IIT Bombay Immersion
Participated in the IIT Bombay Immersion Program.
Experimental work remained paused during this period.
02 July 2026 – Holiday
No project activities were carried out.
03–08 July 2026 – Weather Delay
Continuous rainfall and very low solar radiation prevented meaningful experiments.
Since the project focuses on cooling performance under significant solar loading, experimentation was temporarily suspended.
09 July 2026 – Fan ON vs Fan OFF Study Begins
With clear weather returning, a new phase of experimentation began.
Controlled Fan ON and Fan OFF observations were conducted during the afternoon and again before sunset.
To improve measurement accuracy, an additional data logger was installed just outside the polyhouse, allowing comparison with the nearby weather station.
10 July 2026 – Extensive Fan ON / Fan OFF Experiments
A detailed experiment was conducted from approximately 11:45 AM to 7:00 PM.
The operating sequence alternated every 30 minutes:
- Fans OFF
- Fans ON
This allowed direct comparison under gradually changing environmental conditions.
11 July 2026 – Analysis of Fan Contribution
The previous day’s data was analyzed.
One of the most significant findings so far emerged:
When the fans were ON, the indoor-outdoor temperature difference remained consistently 2–3°C lower than during Fan OFF periods.
This provided strong quantitative evidence of the standalone contribution of exhaust fans.
Additional observations regarding airflow effectiveness and thermal response were also identified.
12 July 2026 – Weekly IIT Bombay Review Meeting
The current project progress was presented during the weekly review meeting with IIT Bombay mentors.
Future work was discussed in detail.
The agreed roadmap included:
- Continuing controlled Fan ON and Fan OFF experiments.
- Identifying environmental operating ranges for different cooling modes.
- Developing an automatic operating strategy.
- Validating the proposed control logic experimentally.
- Recommending an optimized operating strategy for the polyhouse.
A new area of investigation was also proposed:
Effect of Shade Nets
Future experiments will study:
- Different shade-net coverage percentages.
- Poly-film surface temperatures from inside and outside.
- Influence of shading on greenhouse heat gain and cooling performance.
13–14 July 2026 – Data Processing Framework
Work began on developing a program to analyse the large amount of Fan ON/Fan OFF data collected over previous weeks.
The objective was to compare observations only under similar environmental conditions by keeping:
- Solar radiation
- Outdoor wind speed
within selected ranges.
For each range, indoor temperature and humidity under Fan ON and Fan OFF conditions are compared to calculate:
- Temperature difference (ΔT)
- Humidity difference (ΔRH)
This analysis was still under development and was intended to provide a fairer comparison by reducing the influence of changing weather conditions.
15 July 2026 – Automatic Fan Switching
A detailed discussion was held with Arun Sir regarding improving the consistency of experiments.
To eliminate manual switching errors, an automatic timer circuit was installed.
The timer operated the exhaust fans in a fixed cycle:
- 30 minutes Fan ON
- 30 minutes Fan OFF
continuously from 7:00 AM to 7:00 PM.
This ensured highly repeatable experiments throughout the day.
16 July 2026 – Full-Day Monitoring and Sensor Evaluation
Using the newly installed timer system, observations were recorded continuously from 7:00 AM to 7:00 PM.
During the same day, an additional study was performed to determine the most representative location for measuring indoor temperature.
Three data loggers were placed:
- Near cooling pads
- At the center of the polyhouse
- Near exhaust fans
The objective was to evaluate spatial temperature variation and determine which sensor location best represents the overall polyhouse environment.
17 July 2026 – Selection of Representative Indoor Sensor
After analysing observations from multiple logger locations and reviewing previous datasets, two possible approaches were identified:
- Use the center data logger as the representative indoor measurement.
- Use the average of all three indoor data loggers.
Further statistical comparison was ongoing to determine the most suitable approach.
18 July 2026 – Advanced Data Analysis
Work continued on analysing the large Fan ON/Fan OFF dataset collected over recent days.
The analysis again focused on grouping observations according to similar:
- Solar radiation
- Wind speed
to quantify temperature and humidity differences between operating modes.
This work was intended to serve as the basis for developing the automatic control strategy.
19 July 2026 – Weekly Project Review
The week’s progress was presented during the weekly review meeting with IIT Bombay mentors.
The discussion covered:
- Development of the Fan ON/Fan OFF analysis program.
- Installation of the automatic timer circuit.
- Full-day continuous observations.
- Comparison of multiple indoor sensor locations.
- Progress toward identifying environmental operating ranges.
- Next steps for intelligent control development.
The project was moving from qualitative observations toward quantitative, data-driven analysis.
Challenges
This project presented challenges at every stage.
Technical
- Complex airflow patterns
- Thermal buoyancy
- Large volume of experimental data
- Frequent power failures
- Data logger synchronization
- Identifying the most representative indoor sensor location
Practical
- Working in high temperatures
- Structural repairs
- Continuous day-long observations
- Maintaining consistent experimental conditions
Scientific
- Matching theory with real observations
- Separating solar effects from ventilation effects
- Comparing experiments conducted under changing weather
- Developing fair comparison methods using environmental parameter ranges
Learnings
This project taught me much more than simply operating a polyhouse.
I learned:
- Experimental planning
- Airflow visualization techniques
- Thermal behaviour of enclosed environments
- Data acquisition using multiple sensors
- Environmental monitoring
- Statistical comparison of experimental datasets
- Importance of controlling experimental variables
- Developing engineering solutions based on measured data instead of assumptions
Perhaps the biggest lesson was:
Real engineering begins after collecting data. Understanding that data is often harder than collecting it.
Current Status
Completed
✓ Smoke flow visualization
✓ Airflow mapping
✓ Leakage identification
✓ Leakage sealing
✓ Gate modification
✓ Fan-pad performance evaluation
✓ Thermal logging experiments
✓ Fan ON/Fan OFF experiments
✓ Outdoor data logger installation
✓ Automatic fan timer installation
✓ Multi-location indoor sensor comparison
✓ Continuous full-day monitoring from 7 AM to 7 PM
✓ Weekly technical reviews with IIT Bombay mentors
Ongoing
- Development of the Fan ON/Fan OFF comparison program
- Environmental range-based analysis using solar radiation and wind speed
- Selection of the most representative indoor temperature sensor
- Development of an automatic control algorithm
- Experimental validation of the proposed operating strategy
- Investigation of shade-net effects on polyhouse thermal performance
Next Steps
The remaining work focuses on converting experimental observations into a practical automatic control strategy.
The planned work includes:
- Complete the environmental range-based Fan ON/Fan OFF analysis.
- Finalize the representative indoor sensor selection.
- Develop decision rules for switching between operating modes.
- Validate the automatic control strategy experimentally.
- Study the influence of shade-net coverage on indoor thermal conditions.
- Recommend an optimized operating strategy for the polyhouse based on real-time environmental conditions.
Conclusion
What began as a simple investigation into high temperatures inside a polyhouse gradually evolved into a comprehensive study of airflow, heat transfer, ventilation, evaporative cooling, environmental monitoring and intelligent control.
The project progressed from identifying airflow problems and structural leakages to experimentally validating cooling strategies and analysing sensor observations collected under controlled operating conditions.
Each phase built upon the previous one. Smoke tests helped reveal the airflow problem. Air velocity measurements helped quantify it. Leakage sealing and gate modification addressed the unwanted airflow paths. Thermal experiments showed the contribution of fans and evaporative cooling. Repeated Fan ON/Fan OFF experiments then moved the project toward quantitative evaluation.
Today, the focus is no longer only on improving cooling performance. It is on understanding when, why and under what environmental conditions each operating mode performs best.
The ultimate goal is to use these observations to develop an automatic control system capable of selecting an appropriate operating strategy based on real-time weather and polyhouse conditions.
Looking back, this project has shown me that engineering is not simply about building systems. It is about observing carefully, questioning assumptions, validating ideas through experiments and continuously improving solutions using evidence.
The journey is still ongoing, but every experiment has brought me one step closer to understanding the polyhouse as a complete thermodynamic system rather than just a farming structure.