09-09-2026 to 20-09-2026
After a discussion with Ranjeet Sir and Kulkarni Sir, Kulkarni Sir instructed me to develop a School Information Dashboard. They instructed me to first develop a dashboard for a few schools.
School Data Collection and Analysis
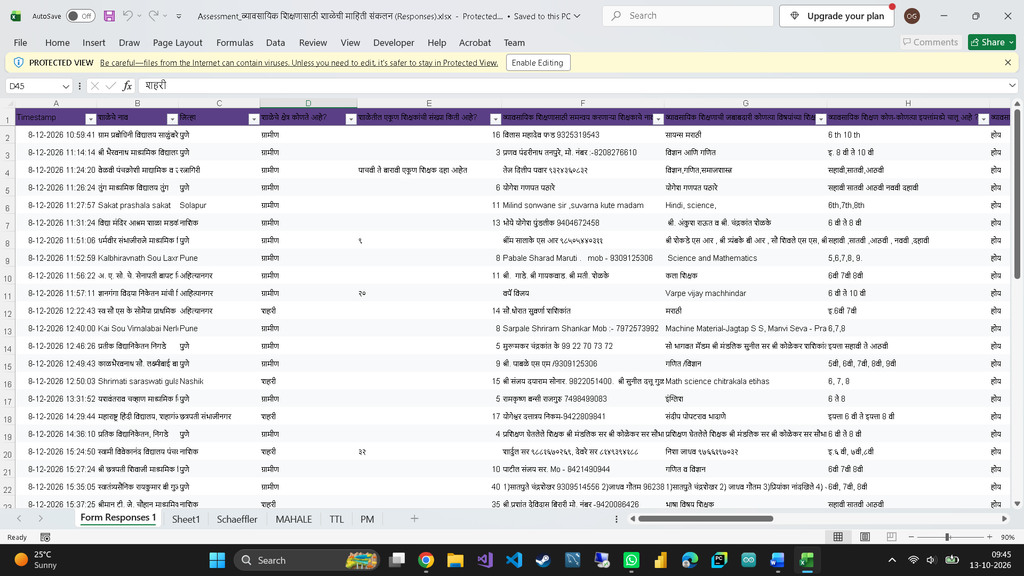
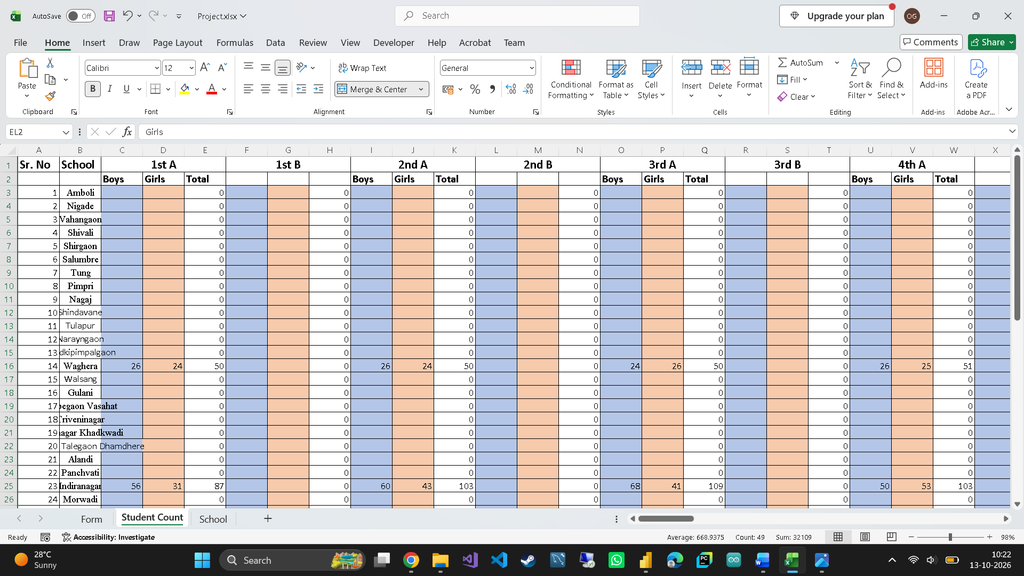
- Collected row-wise data for the selected schools.
- Analyzed the collected data to identify key information.
- Identified dashboard requirements based on the data analysis.
- Reviewed school records to understand the available information.
- Identified important parameters such as student count, teacher details, school facilities, and project information.
Data Cleaning and Preparation
- Translated the Marathi data into English.
- Removed null values and cleaned the dataset.
- Added additional columns as required for dashboard development.
- Standardized school names, district names, and other data fields.
- Organized the cleaned data into a structured format for Power BI.
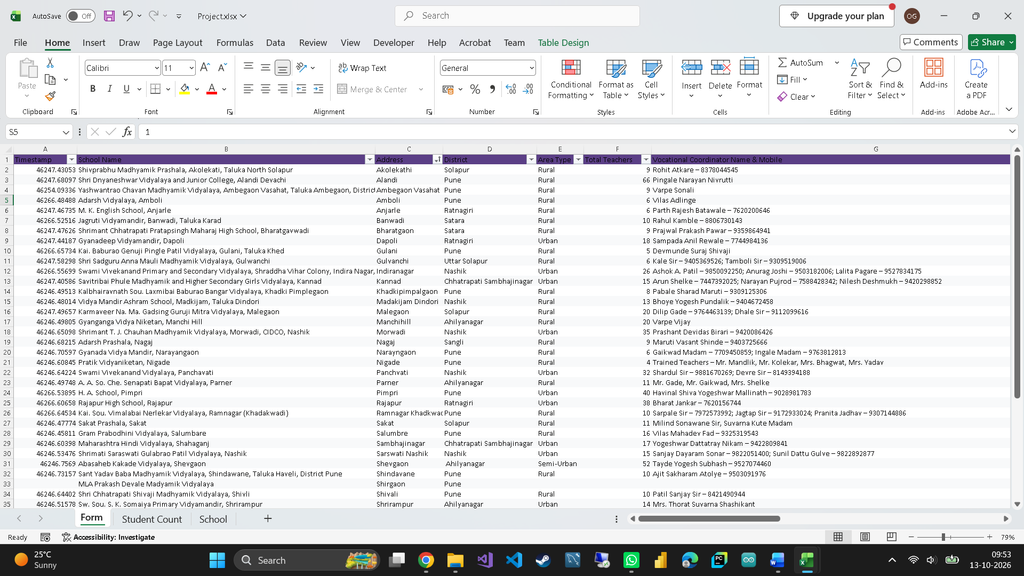
Data Transformation in Power BI
Imported the cleaned school data into Power BI.
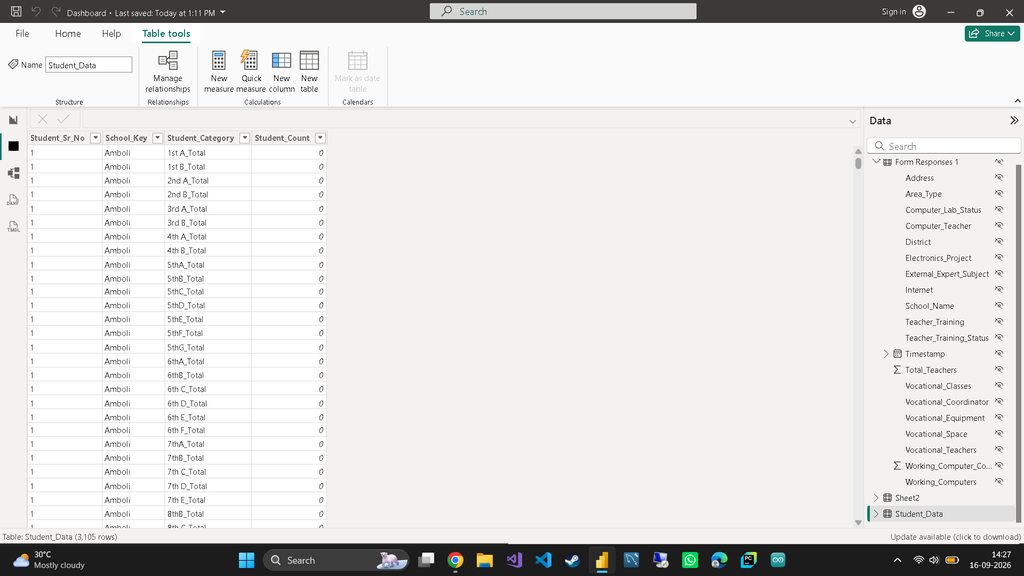
Transformed and formatted the data using Power Query Editor.
Modified table structures according to dashboard requirements.
Changed column data categories and data types according to their content.
Created and edited columns required for DAX calculations and dashboard visualizations.
Creating Relationships Between Tables
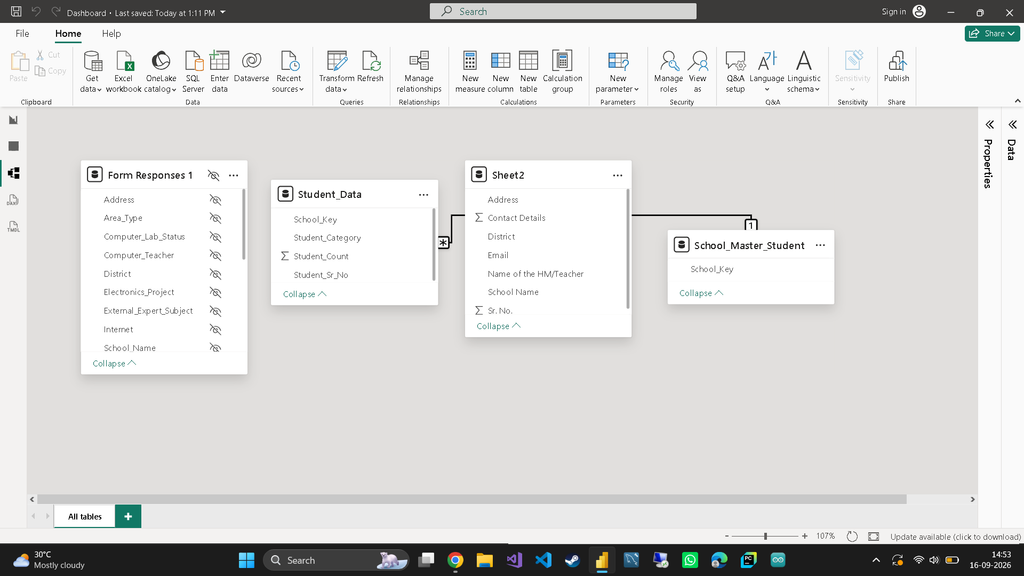
Identified common columns between different tables.
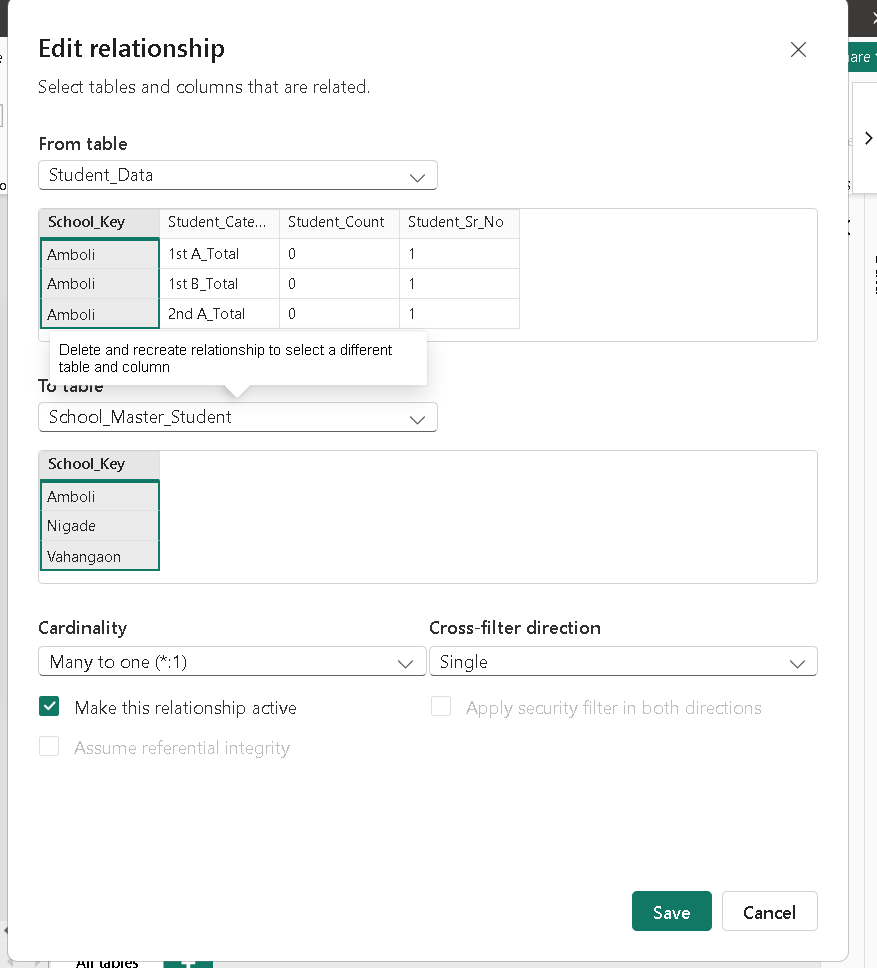
Created relationships between tables using common fields such as School_Key.
Configured relationship cardinality according to the data structure.
Checked and resolved relationship conflicts to ensure proper data filtering.
Verified the relationships to support accurate DAX calculations and dashboard visualizations.
Creating Dashboard Visuals
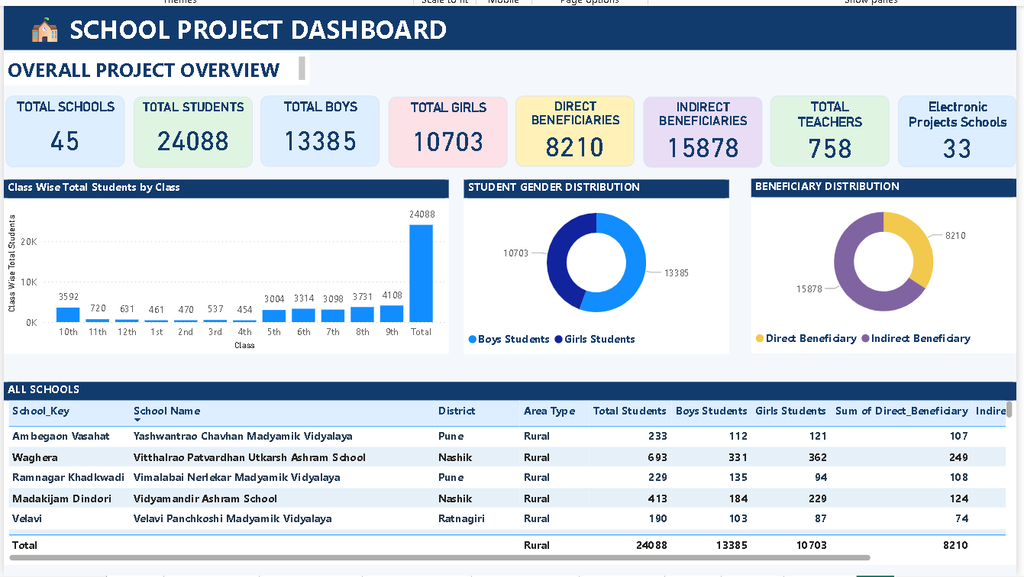
- Created KPI cards to display total schools, students, boys, girls, direct beneficiaries, indirect beneficiaries, total teachers, and electronic projects.
- Developed a class-wise student bar chart to compare student counts across different classes.
- Created a gender distribution donut chart to visualize the proportion of boys and girls.
- Added a beneficiary distribution donut chart to show direct and indirect beneficiaries.
- Created a detailed school information table containing relevant school details for easy reference.
21-09-2026 – 27-09-2026
Creating a School-Wise Dashboard with Detailed Insights
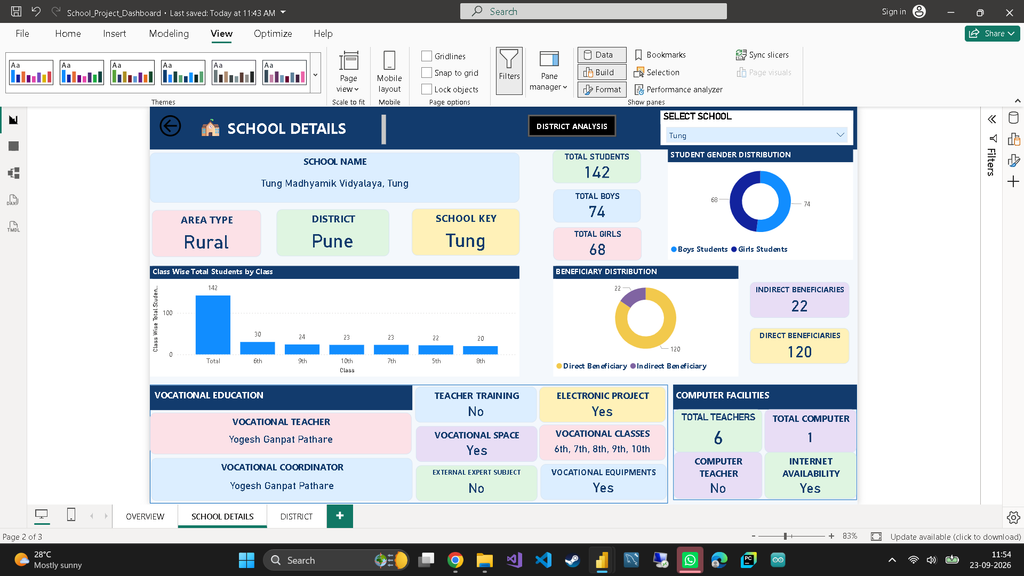
- Added a school slicer to display selected school data.
- Included school name, address, district, and area type.
- Created KPI cards for students, teachers, beneficiaries, and electronic projects.
- Added class-wise student, gender distribution, and beneficiary charts.
- Displayed school details and insights into vocational education and computer facilities.
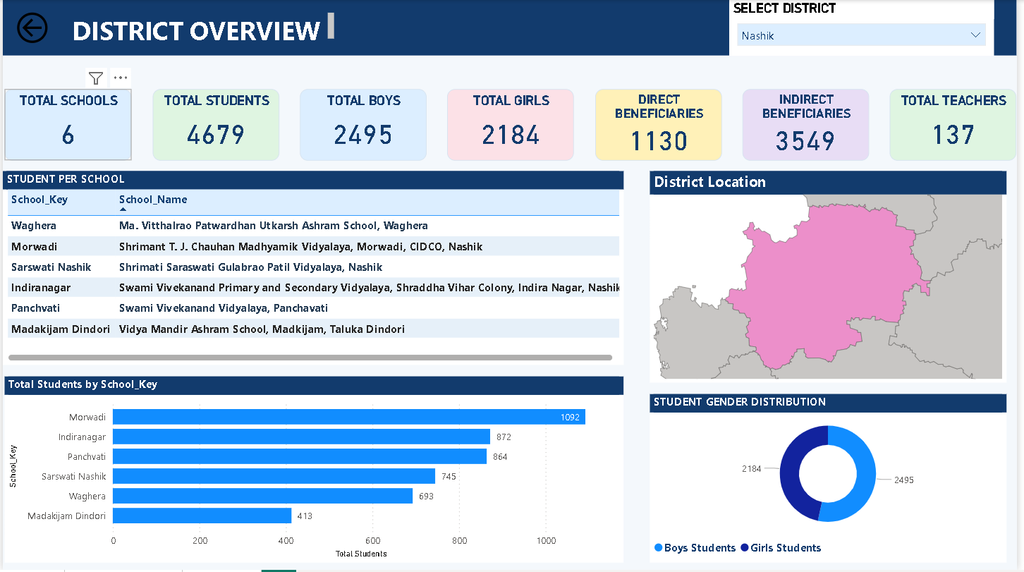
Creating a District-Wise Dashboard
- Added a district slicer to display district-wise data.
- Created KPI cards for schools, students, boys, girls, teachers, and beneficiaries.
- Added a table listing schools in the selected district.
- Highlighted the selected district on the Maharashtra map.
- Created a bar chart for school-wise students and a donut chart for gender distribution.
Displaying the Dashboard Output
Displayed the dashboard with school-wise and district-wise information.
Demonstrated the interactive slicers, charts, tables, and map.
Showed how the dashboard updates based on the selected school or district.
Dashboard Presentation and Feedback
Presented the dashboard to Kulkarni Sir for review. Based on his feedback, he instructed me to develop an additional dashboard to display and analyze school data funding agency-wise.
Presented the dashboard to Archana Mam and other IBT staff for review and feedback.
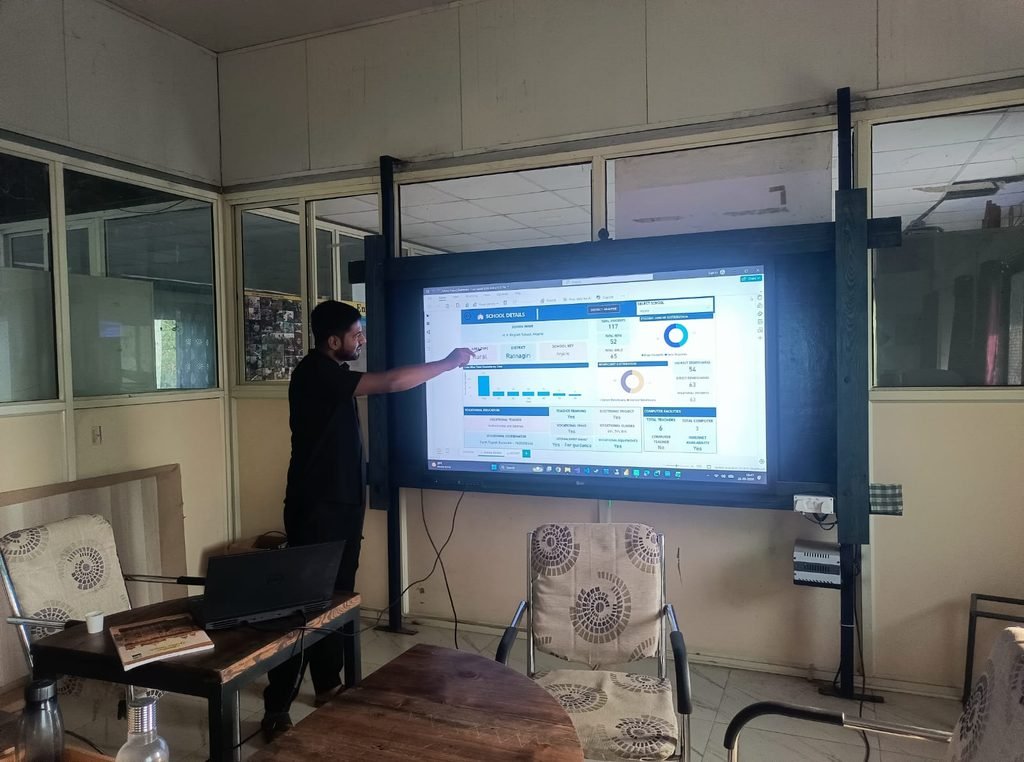
- Feedback and Suggestions for Dashboard Improvement
- Added school locations to the dashboard.
- Renamed some visuals for better clarity.
- Rearranged the visual order to improve the dashboard layout.
28/09/2026 – 04/10/2026
Data Preparation and Transformation in Power BI
Collected school data for the Nandurbar and Dantewada regions.
Cleaned the data by translating required text into English, removing null values, and standardizing data fields.
Transformed the data in Power Query Editor, modified tables, adjusted column data types and categories, and added columns for DAX calculations.
Created relationships between tables using common fields such as School Key.
Verified the relationships to ensure accurate calculations and proper data filtering.
Creating a Nandurbar Schools Dashboard Page
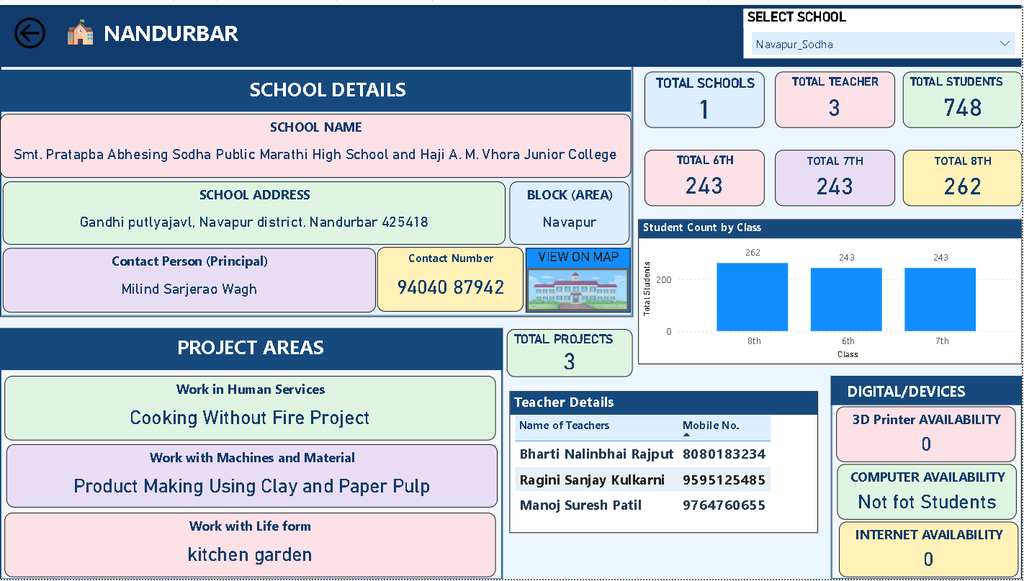
- Added school details, including name, address, area, Google Maps location, and contact information.
- Created KPI cards for schools, teachers, students, Classes 6th–8th, and total projects.
- Developed a class-wise student count column chart.
- Added work area and project information.
- Displayed teacher names and mobile numbers.
- Included digital facilities such as 3D printers, computers, and internet availability.
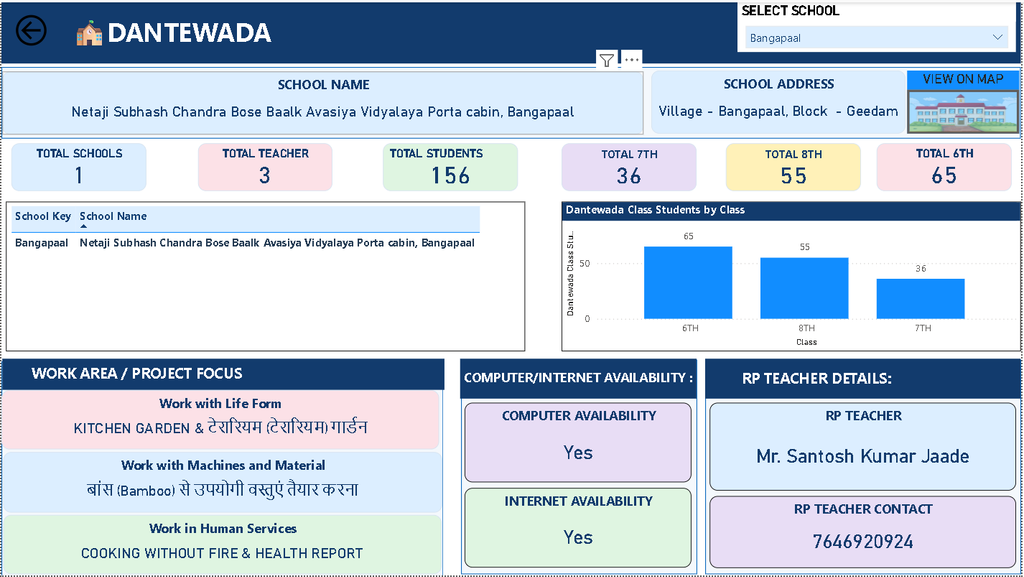
Creating a Dantewada Schools Dashboard Page
- Displayed school names, addresses, and Google Maps locations.
- Added KPI cards for total schools, teachers, and students in Classes 6th, 7th, and 8th.
- Created a class-wise student count column chart.
- Added Responsible Person (RP) names and contact details.
- Displayed computer and internet availability.
- Added work areas and project information.
Creating a Funding Agency-Wise School List Dashboard
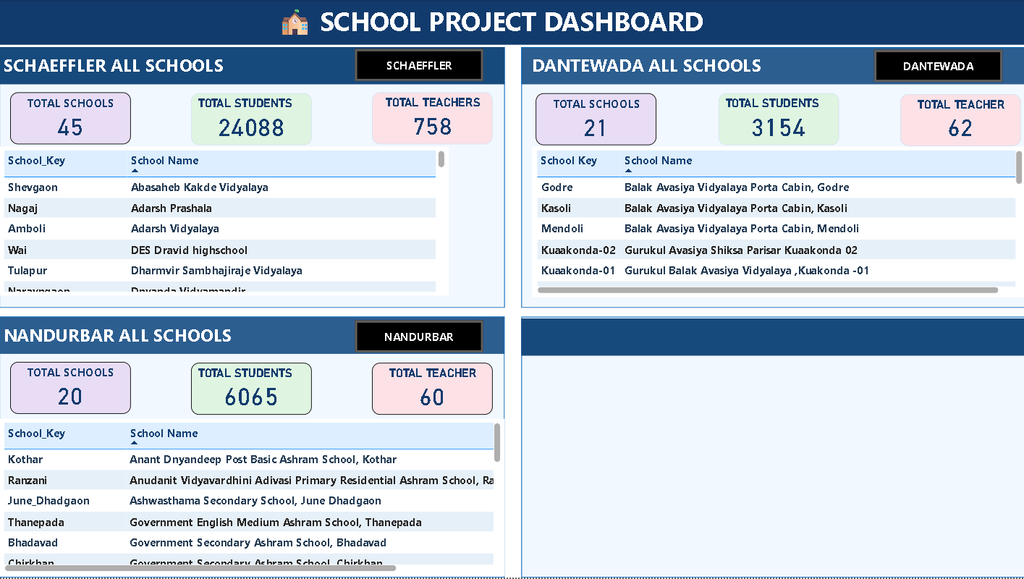
- Created a School List page to display all schools categorized by funding agency.
- Added KPI cards for total schools, total students, and total teachers.
- Created a table listing all schools with their School Key and School Name.
- Added navigation buttons to open the detailed dashboard for the selected school.
- Organized the page to make school-wise information easy to access.
Dashboard Output
School List: Complete list of all schools.
Dantewada: Information for 21 schools in Dantewada.
Nandurbar: Information for 20 schools in Nandurbar.
Updates to the Schaeffler Schools Dashboard
Updated the Schaeffler Schools dashboard page with additional school information.
Added Google Maps locations for schools.
Included instructor and VE teacher counts.
Added 3D printer availability information.
05/10/2026 – 11/10/2026
Data Collection, Cleaning, Transformation – TTL Schools
Collected data for TTL schools.
Retrieved school latitude and longitude coordinates using Google Maps.
Checked the collected data for missing and inconsistent values.
Standardized school names and verified location coordinates.
Imported and transformed the data using Power Query Editor.
Separated latitude and longitude into individual columns.
Set the appropriate data types and categories for map visualization.
Prepared the cleaned data for integration into the existing Power BI dashboard.
Added TTL schools to the dashboard page
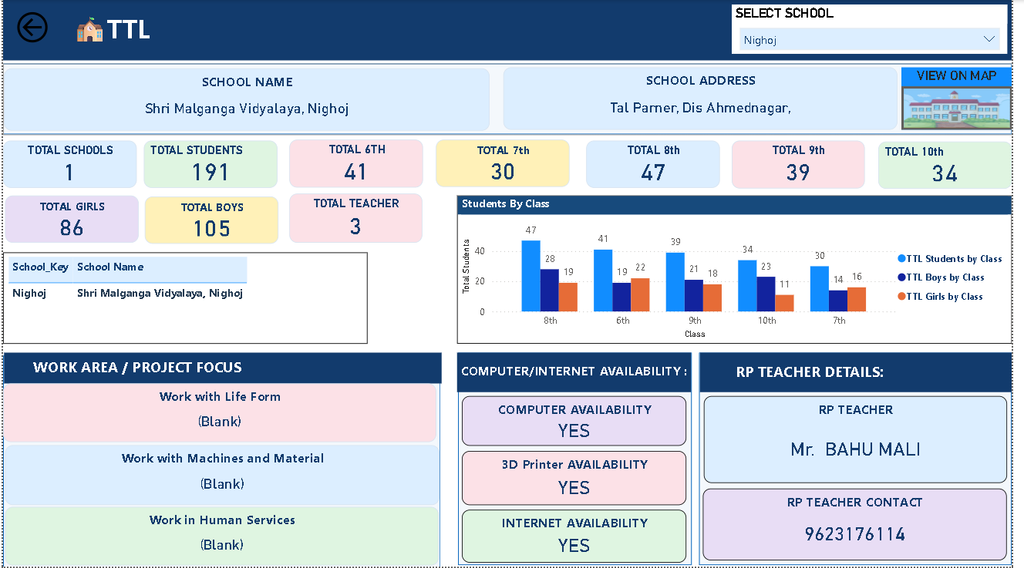
- Displayed school name, address, and Google Maps location.
- Added KPI cards for total schools, students, teachers, boys, girls, and students from Classes 6th to 10th.
- Created a class-wise column chart showing total students, boys, and girls.
- Added a school list containing School Key and School Name.
- Included responsible teacher names and contact details.
- Displayed computer, internet, and 3D printer availability.
- Added a project details section; however, project data is not available.
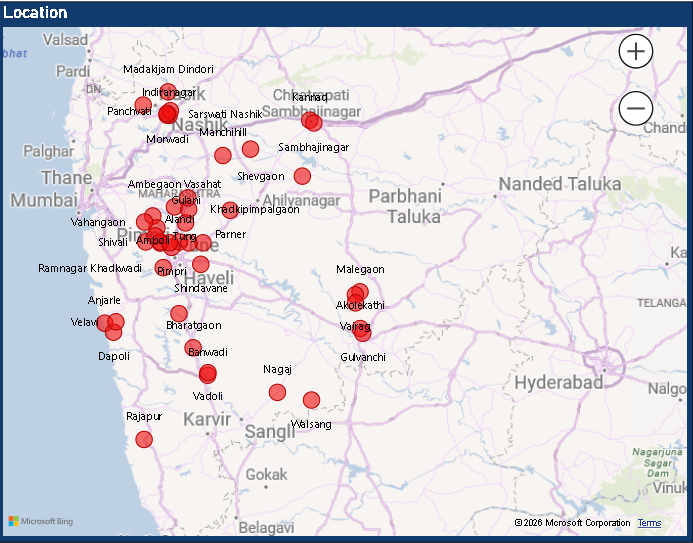
Added a new Map page to the dashboard.
- Calculated the latitude and longitude coordinates for each school using Google Maps.
- Configured map bubbles to display school locations using latitude and longitude coordinates.
- Added school names and location details to improve map identification.
- Displayed the School Key for each school on the map.
- Improved map visualization to make school locations easier to identify.
- Verified the plotted school locations using the geographical coordinates.
Added the TTL schools list to Funding Agency-Wise School List Dashboard
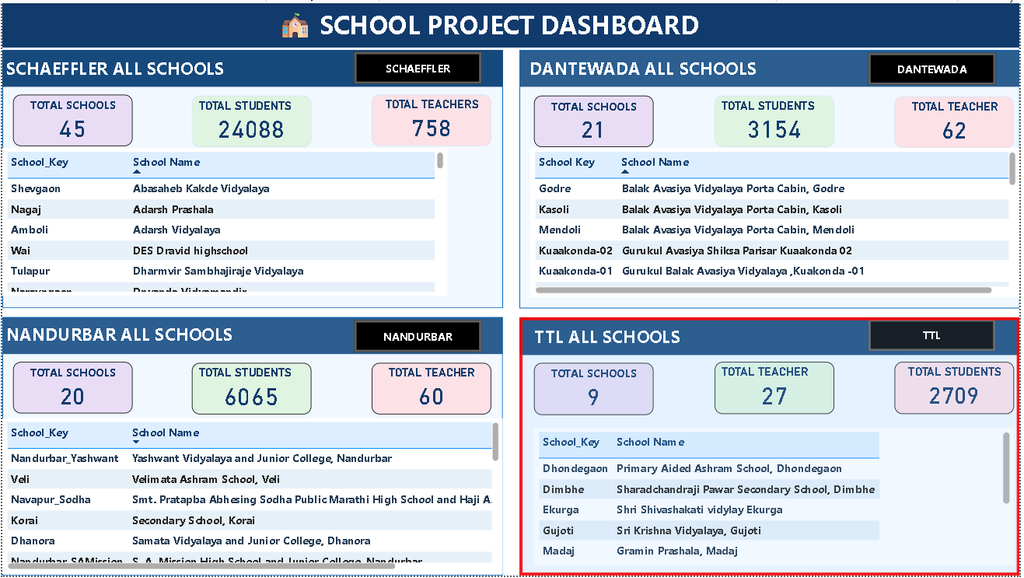
- Organized the page to make school-wise information easy to access
- Added the TTL schools list to the Funding Agency-Wise School List Dashboard.
- Created KPI cards for total schools, total students, and total teachers.
- Added a table displaying School Key and School Name for all schools.
- Added navigation buttons to open the detailed dashboard for the selected school.
- Organized the page for easy access to school-wise information.
Dashboard Output
Pranit Sir guided me on managing the Vigyan Ashram website and uploading monthly reports (05/10/2026).
Uploaded the July monthly report to the Vigyan Ashram website under Pranit Sir’s guidance (09/10/2026).