Introduction :
Hydroponic farming is the practice of growing plants without soil, using nutrient-rich water solutions in a controlled environment. This method reduces water usage by up to 90%, eliminates soil-borne diseases, and ensures year-round production of high-quality crops.The project focuses on developing optimized hydroponic systems, mainly the Nutrient Film Technique (NFT), along with other models like Deep Water Culture (DWC) and drip hydroponics, etc .
The goal is to determine precise environmental requirements for crops such as spinach, lettuce, tomato, cucumber, and herbs, including the ideal ranges of temperature, light, and nutrient concentration .This research will build a comprehensive understanding of crop-environment interactions in hydroponic systems, ultimately creating efficient models that can be scaled for commercial farming and urban agriculture.
System Design and Optimization:
1. Nutrient Solution: Establishing crop-specific formulations and monitoring EC(Electrical Conductivity) and pH for maximum growth.
2. Water Circulation: Ensuring proper flow rate in NFT channels for balanced oxygen and nutrient supply.
3. Growing Conditions: Controlling temperature, humidity, and light duration for healthy crop development.
4. Resource Efficiency: Evaluating how water, nutrient, and energy usage can be minimized without compromising yield.
5. To study effect of synergistic effects like Ca and Mg concentration, but not limited to only this.
Objectives
1. To design and implement hydroponic systems (NFT, DWC, and drip) for leafy and fruiting vegetables.
2. To standardize nutrient solution and environmental conditions for different crops.
3. To evaluate crop growth, yield, and quality under controlled hydroponic conditions.
4. To promote hydroponics as a sustainable farming practice for urban and peri-urban regions.
This project was assigned to me by Dixit Sir, and I am doing it under his guidance. We have already started working on it. In our first discussion with him, we talked about the project background and how the work can be carried out.
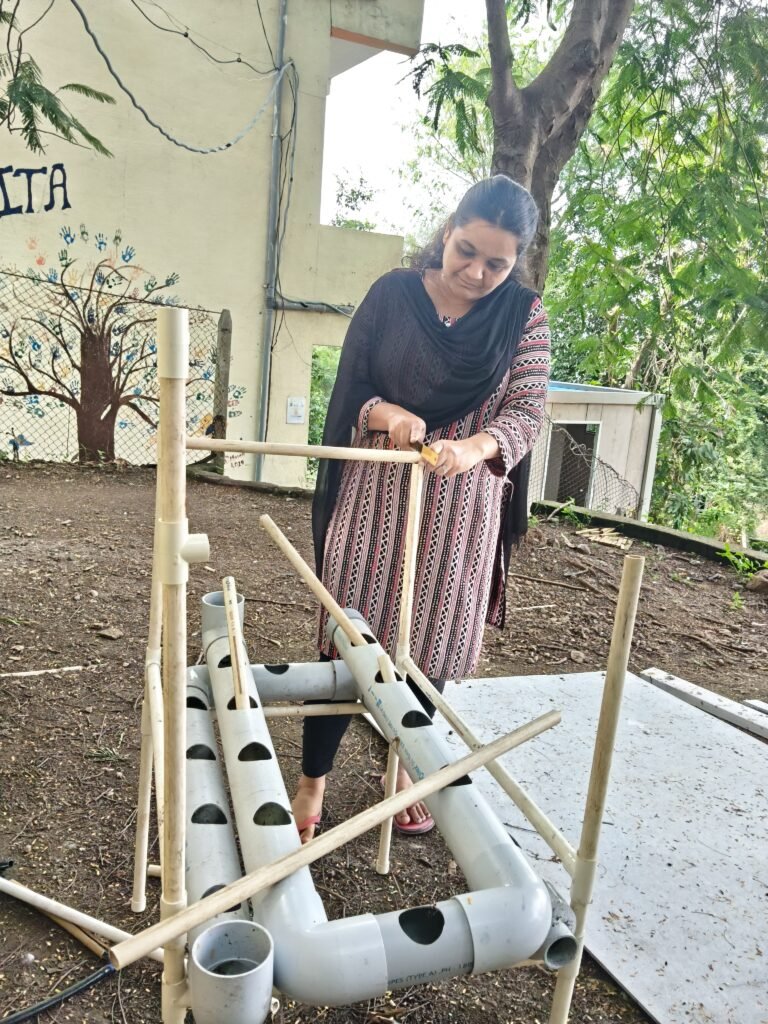
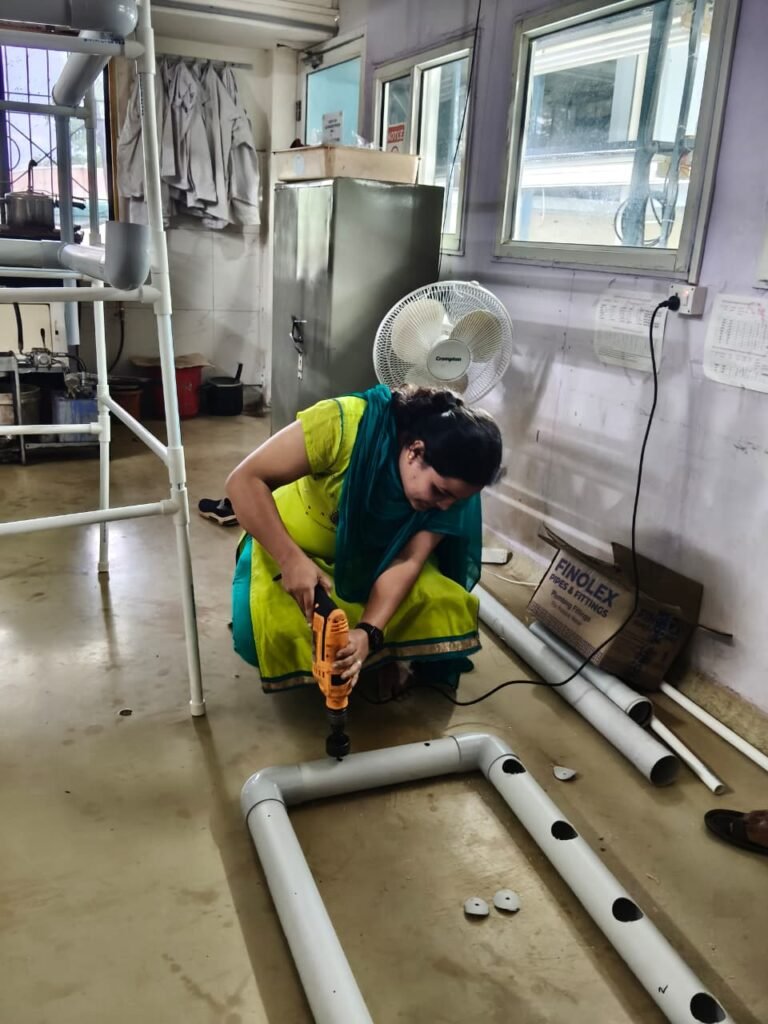
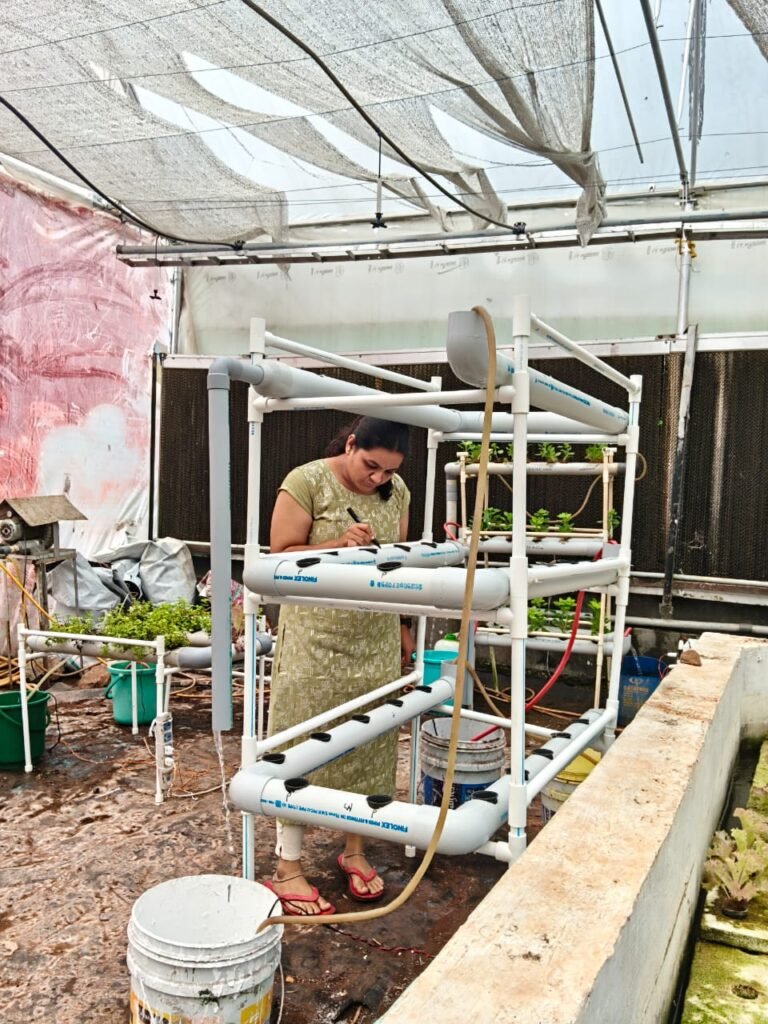
In the second discussion with Dixit Sir and Prasad Sir, it was decided to prepare different hydroponic systems and conduct trials on them. Accordingly, the first system we prepared was the NFT hydroponic system. I prepared this NFT hydroponic system using some scrap materials.
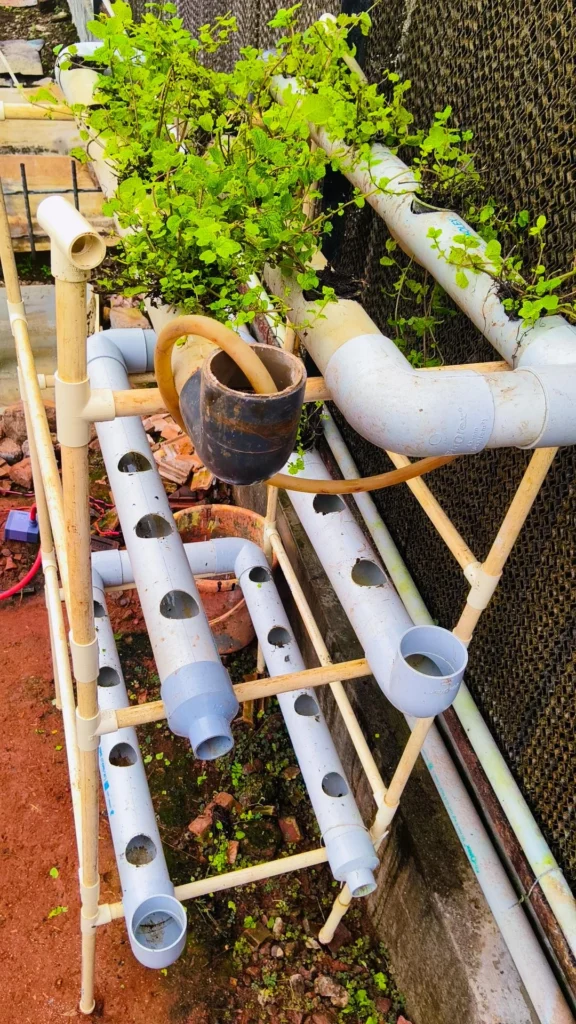
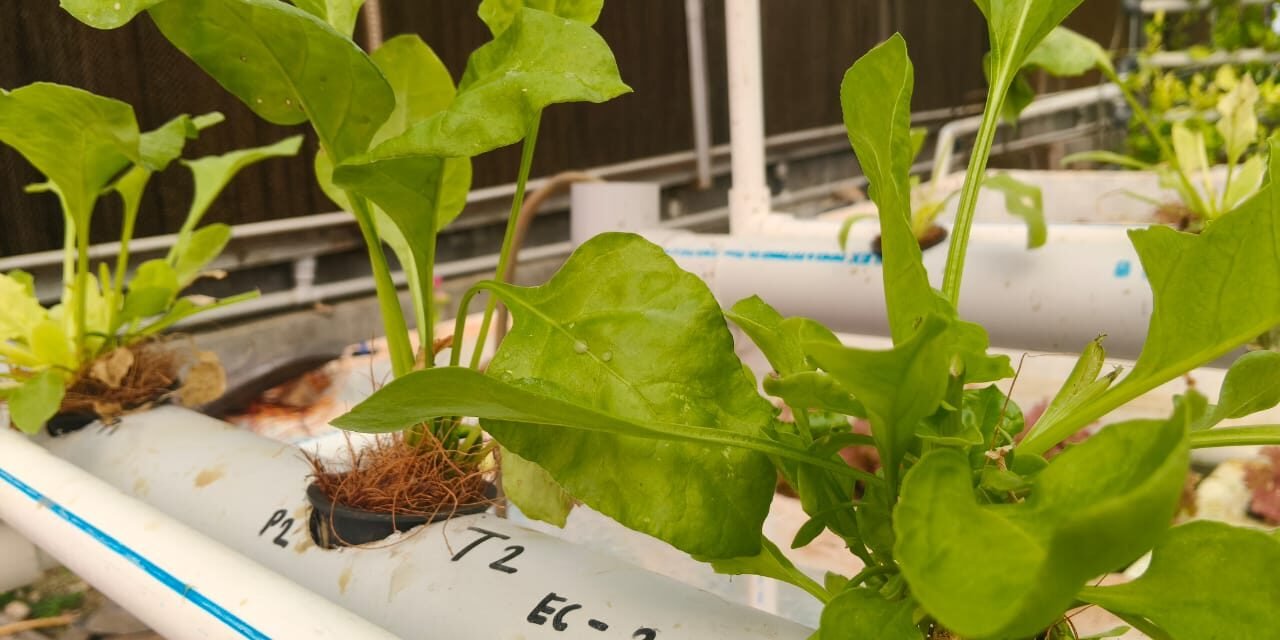
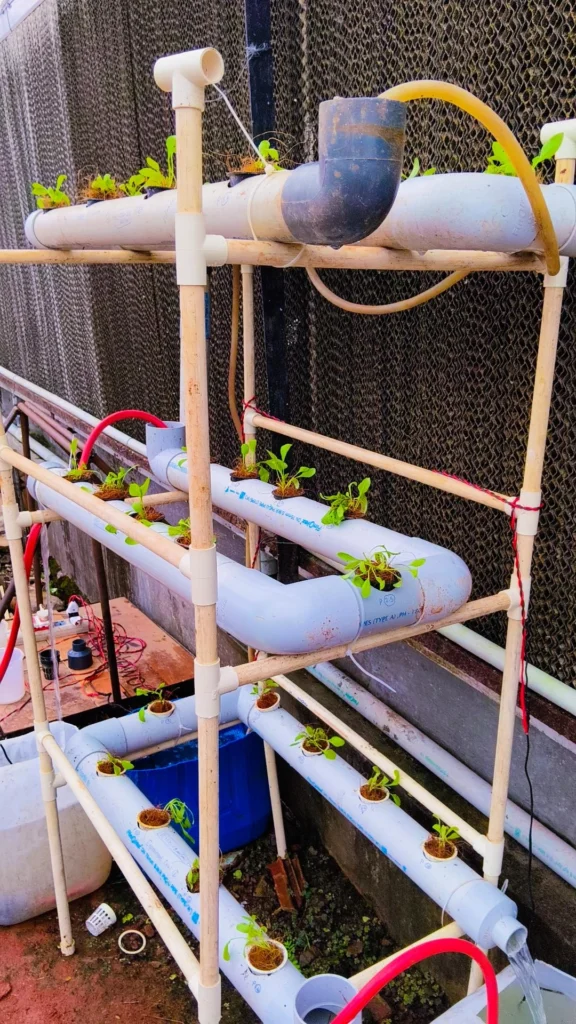
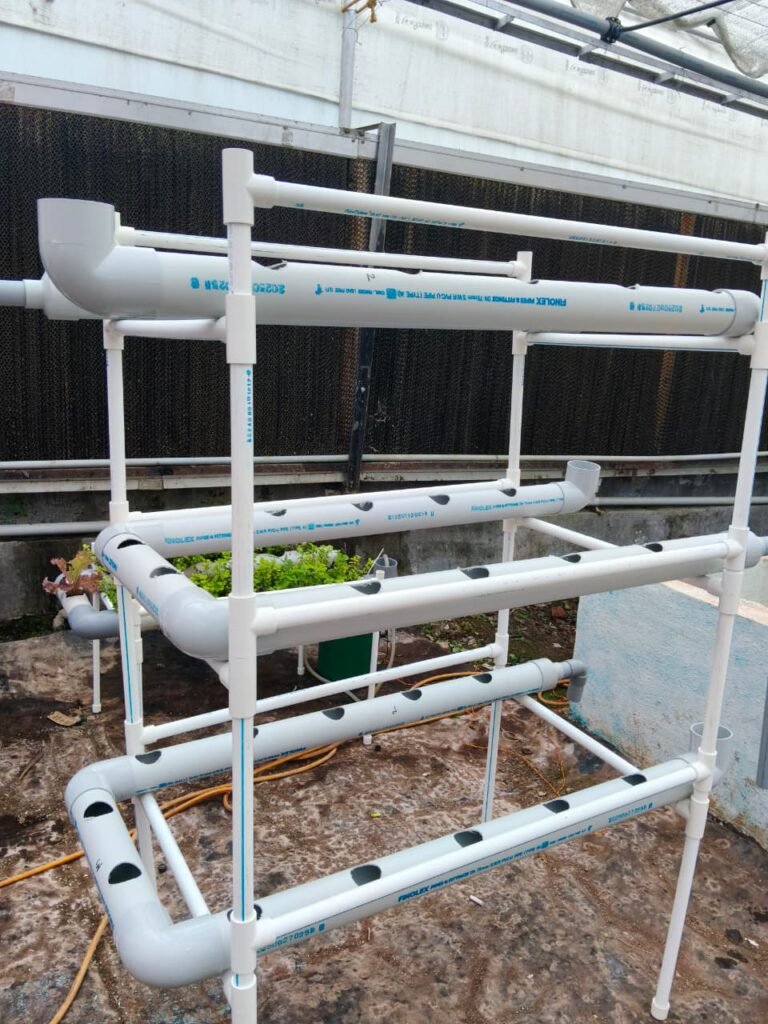
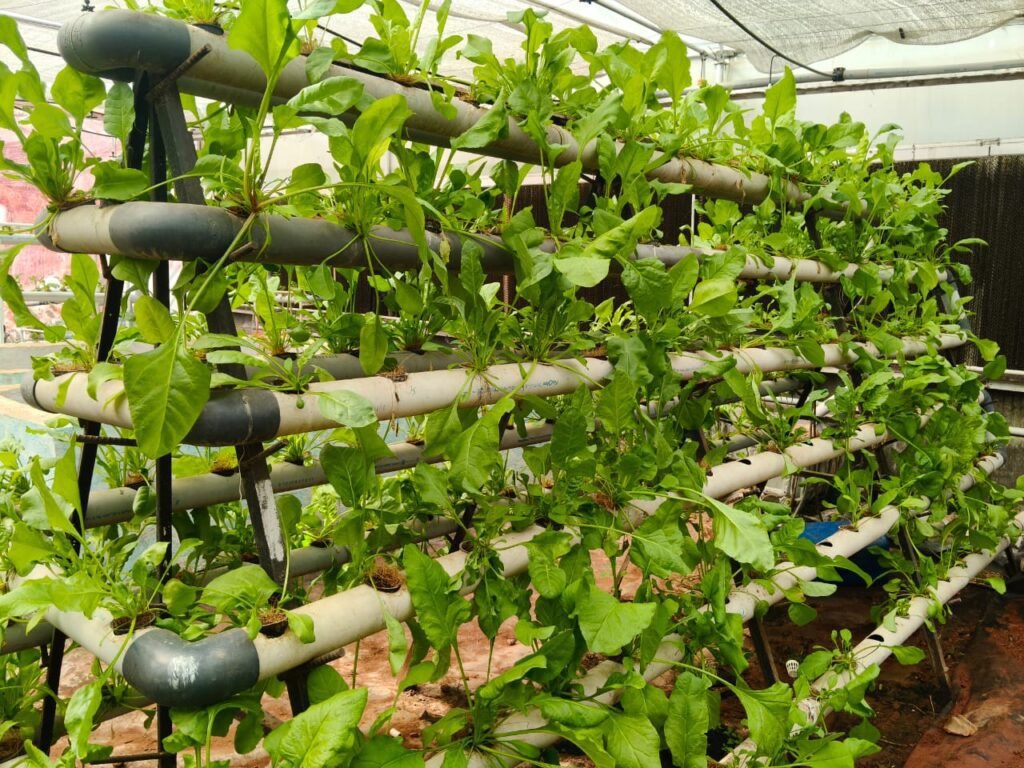
This is a 3-tier NFT (Nutrient Film Technique) hydroponic unit made from PVC pipes. It is 4.1 ft tall and can hold 31 plants. The system is suitable for growing leafy vegetables and herbs like mint, spinach, coriander, and lettuce. An 18-watt submersible pump is used to circulate the nutrient solution.
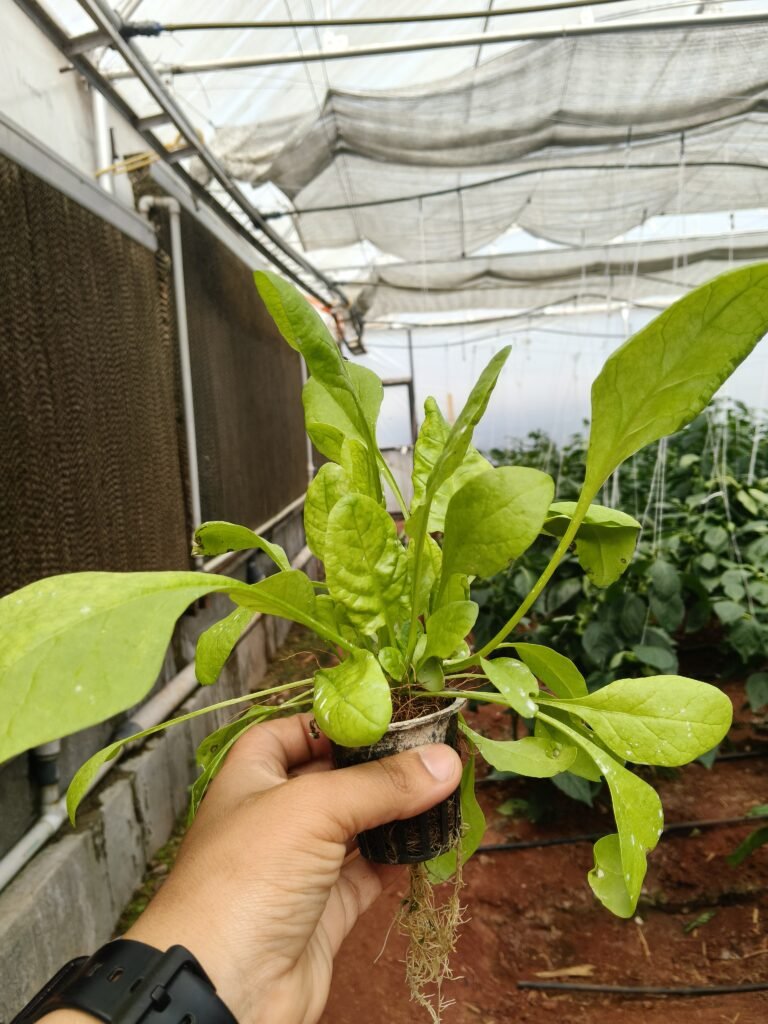
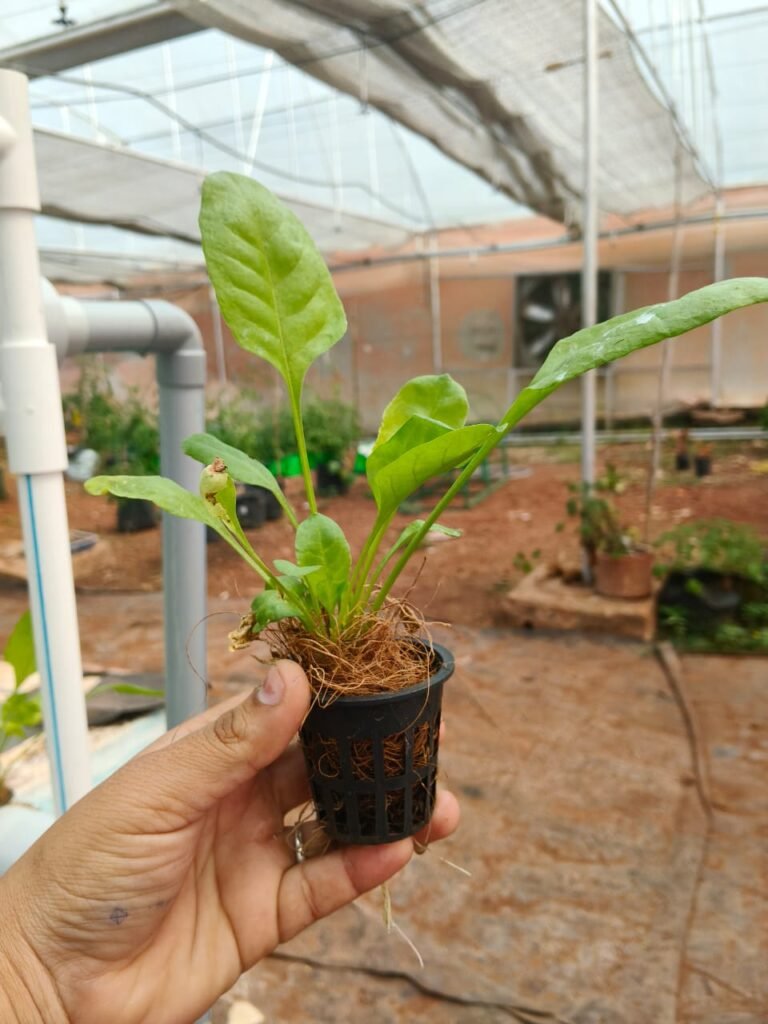
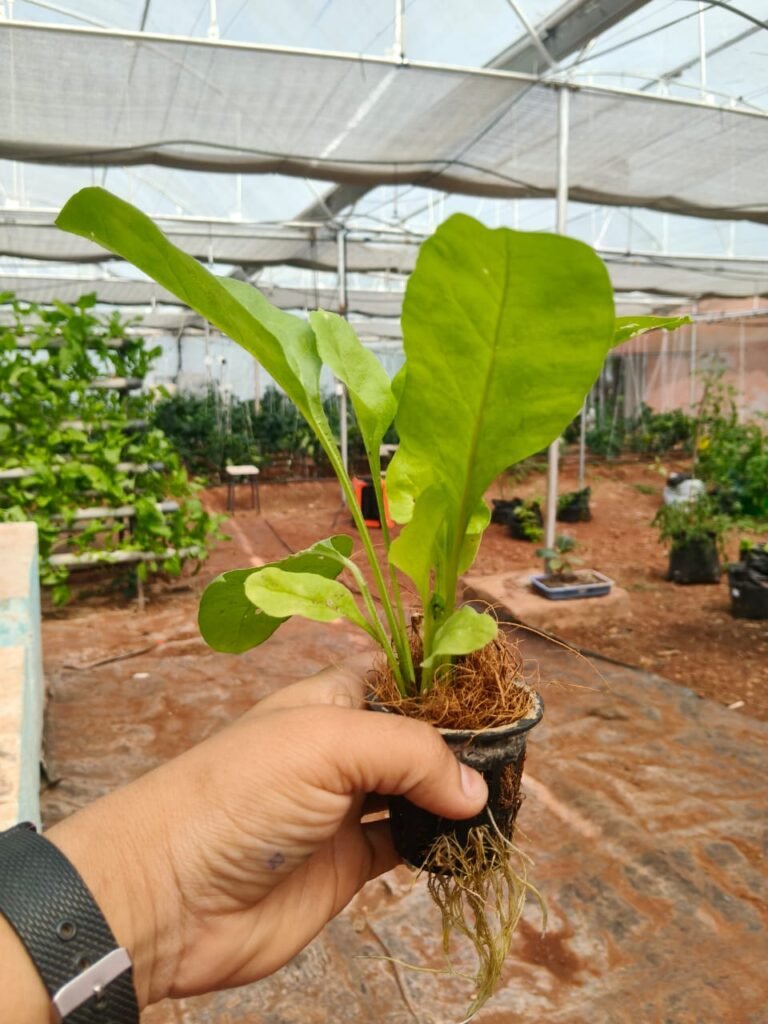
Spinach in Hydroponics
Spinach (Spinacia oleracea) is one of the best leafy greens for hydroponics. It grows quickly, is nutrient-rich, and thrives in cooler hydroponic conditions compared to crops like lettuce or basil. Since spinach is sensitive to heat and water stress in soil, hydroponics helps maintain consistent growth.
NFT (Nutrient Film Technique): A thin film of nutrient solution flows over the roots, making it ideal for growing leafy greens.
Table No.1 Environmental Requirements
| Parameter | Ideal Range | Notes |
|---|---|---|
| pH | 5.8 – 6.5 | Keep stable; check regularly |
| EC (Electrical Conductivity) | 1.8 – 2.3 mS/cm | Too high causes tip burn |
| Water Temp | 18 – 22°C | Cooler water improves growth |
| Air Temp | 15 – 24°C | Prefers cool climate |
| Humidity | 50 – 70% | Too high = fungal risk |
| Light | 10–12 hours/day | 150–250 µmol/m²/s (LED or sunlight) |
Spinach is sensitive to heat → bolting (premature flowering) happens if temp > 26°C.
Nutrient Management for Spinach in NFT
N = 162 ppm
P = 50 ppm
K = 230 ppm
Ca = 140 ppm
Mg = 50 ppm
S = 70 ppm
Fe = 2.5 ppm
Mn = 0.8 ppm
Zn = 0.08 ppm
Cu = 0.05 ppm
B = 0.5 ppm
Mo = 0.05 ppm
Link of Nutrient Source for spinach :
Calculation :
Calcium Nitrate (N= 15.5 %, Ca = 19%)
Calculation for calcium (Ca – 19%)
= 140 × 100 / 19 = 736 mg
To Convert mg/L = 736/1000 = 0.736 g/L
For 20 L Water = 0.736 × 20 =14.72 g
= 14.72 g (Ca Requirement Competed)
Nitrogen :
= 736 × 15.5 N / 100 = 114.08
(162 – 114.08 = 47.92 ppm N need to Complete n source )
- 00:52:34 (Phosphorus) KH2PO4
P = 50 × 100 / 52 = 96.15 mg/L
=0.0961 g/L
= 96.15 × 20 L= 1923 mg →1.923 g
K = 96.15 × 34 k / 100 = 32.691 mg/L
( K = 230 ppm – 32.691= 197.31 need to complete k requirement )
- 13:00:45 potassium
Nitrogen = 47.92 N need × 100 / 13 = 368.615 mg →0.3676 g/L
= 368.615 × 20 = 7372.30 mg → 7.372 gram
(Nitrogen Requirement completed)
Potassium = 368.6. × 45 k / 100 = 165.8 mg/L
(197.31 – 165.9 = 31.41 K Need )
- 00:00:50 (To complete k)
= 31.41 × 100 / 50 = 62.82 mg/L
= 62.82 mg/L→0.0564 g/L
(Potassium Requirement Completed)
- Magnesium Sulphate (MgSO4 , Mg =9.5% ,S12 % )
50 × 100 / 9.5= 526.31 mg L → 0.52631 g
0.52631 g × 20 = 10.526 g
Sulfur (S= 12 %)
= 526.31 × 12 / 100 = 63.15 g
We used Micronutrients (EDTA) mix for micronutrient supply:
Fe = 2.5 × 100 /2.5 =100× 200 L , 20000 mg → 20 ml
Method 1 –
| Sr. No. | Fertilizer | 1 L | 20 L |
| 1 | Calcium nitrate — Ca(NO₃)₂ | 0.736 g | 14.720 g |
| 2 | 13:00:45 (KNO₃) | 0.507 g | 10.140 g |
| 3 | KH₂PO₄ (mono-K phosphate) 00:52:34 | 0.096 g | 1.920 g |
| 4 | 00:00:50 K₂SO₄ / 0-0-50 | 0.303 g | 6.060 g |
| 5 | MgSO₄ | 0.526 g | 10.520 g |
| 6 | Micronutrient mix (EDTA; Fe) | 0.1 mL | 2.0 mL |
Calculation for if we used Urea as N source
if we add urea (46% N), then what should be replaced and what else needs to be adjusted.
Therefore, replacing KNO₃ with urea makes the most sense — since KNO₃ supplies both N and K, while urea supplies only N. The missing K can then be supplied from another K source (K₂SO₄).
- Calculation for calcium (Ca – 19%)
= 140 × 100 / 19 = 736 mg
To Convert mg/L = 736/1000 = 0.736 g/L
For 20 L Water = 0.736 × 20 =14.72 g
= 14.72 g (Ca Requirement Competed)
Nitrogen :
= 736 × 15.5 N / 100 = 114.08
(162 – 114.08 = 47.92 ppm N need to Complete n source )
Urea required (to supply 47.92 ppm N):
urea(mg/L = 47.92 × 100 / 46 = 104.174mg/L
For 20 L:104.174 mg /lL×20 = 2.0835 g urea
K deficit from removing KNO₃ = 45.69 ppm K.
K₂SO₄ provides 50% K, so:
K₂SO₄ (mg/L) = 31.41 × 100 / 50 k = 62.82 mg/L
For 20 L= 62.82 × 20 = 1256.4 mg/L →1.256 g
So new K₂SO₄ total = original 60.64 g + 1.256 g = 61.89 g
Method 2:
| Sr. No. | Fertilizer | 1 L | 20 L |
| 1 | Calcium nitrate — Ca(NO₃)₂ | 0.736 g | 14.720 g |
| 2 | KH₂PO₄ (mono-K phosphate) | 0.096 g | 1.920 g |
| 3 | Urea (46% N) | 0.104174 g (≈0.104 g) | 2.083 g |
| 4 | K₂SO₄ (0-0-50 style K source) | 0.395 g | 7.900 g |
| 5 | Mg SO₄ | 0.526 g | 10.520 g |
| 6 | Micronutrient mix (EDTA; Fe) | 0.1 mL | 2.0 mL |
17 Sept 2025
On 17th September, I had a small discussion with Dixit Sir, and it was decided that instead of selecting three crops, we would conduct different experimental trials on spinach.
20 Sept 2025
On 20th September, I had a discussion with Dixit about how the spinach experiment trials will be. In that discussion, it was decided that the three-layer hydroponic system I prepared will be used with three different EC ranges, with 9 plants in each layer, and the same nutrient fertilizer will be given to all three layers. Also, every week, the fresh weight and dry weight of one plant from each layer will be calculated.
Objective of this experiment :
- To study the effect of different EC (Electrical Conductivity) levels of nutrient solution on the growth and water content (moisture percentage) of spinach in an NFT hydroponic system.
- To determine the optimum EC range for maximum spinach growth and moisture retention.
- To analyze the relationship between EC, nutrient uptake, and physiological responses such as deficiency symptoms or osmotic stress.
- To evaluate Loss on Drying (LOD) as an indicator of water content and plant freshness under different EC treatments.
21 Sept 2025
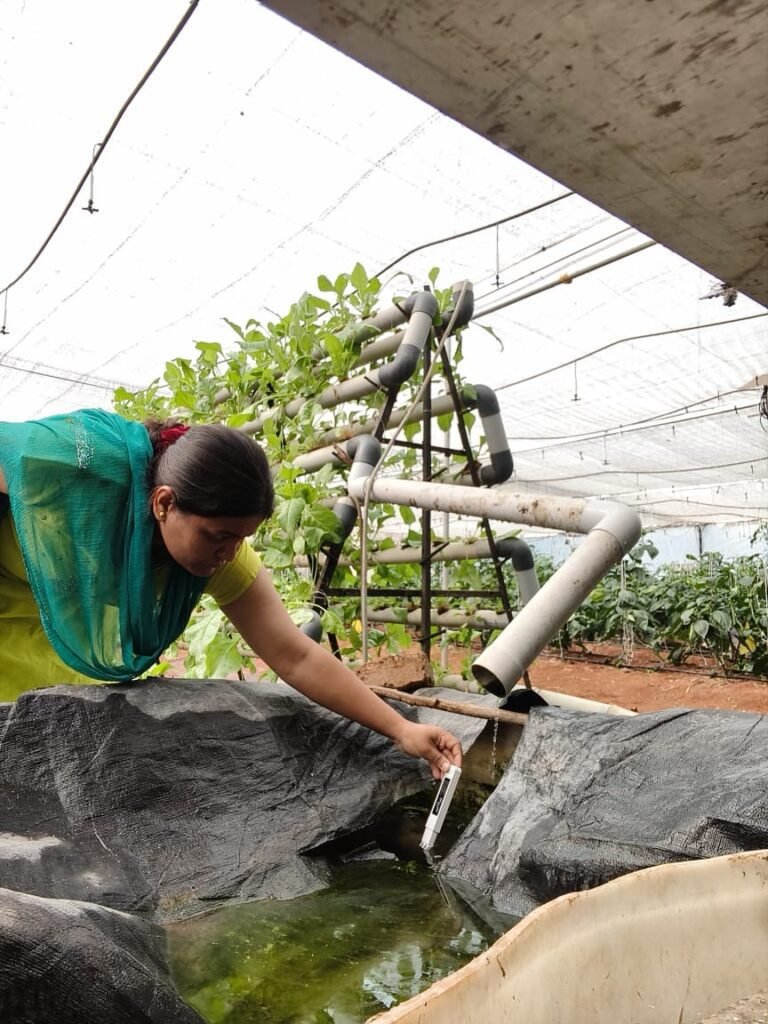
Link of Spinach NFT Hydroponic Daily EC Maintenance sheet :
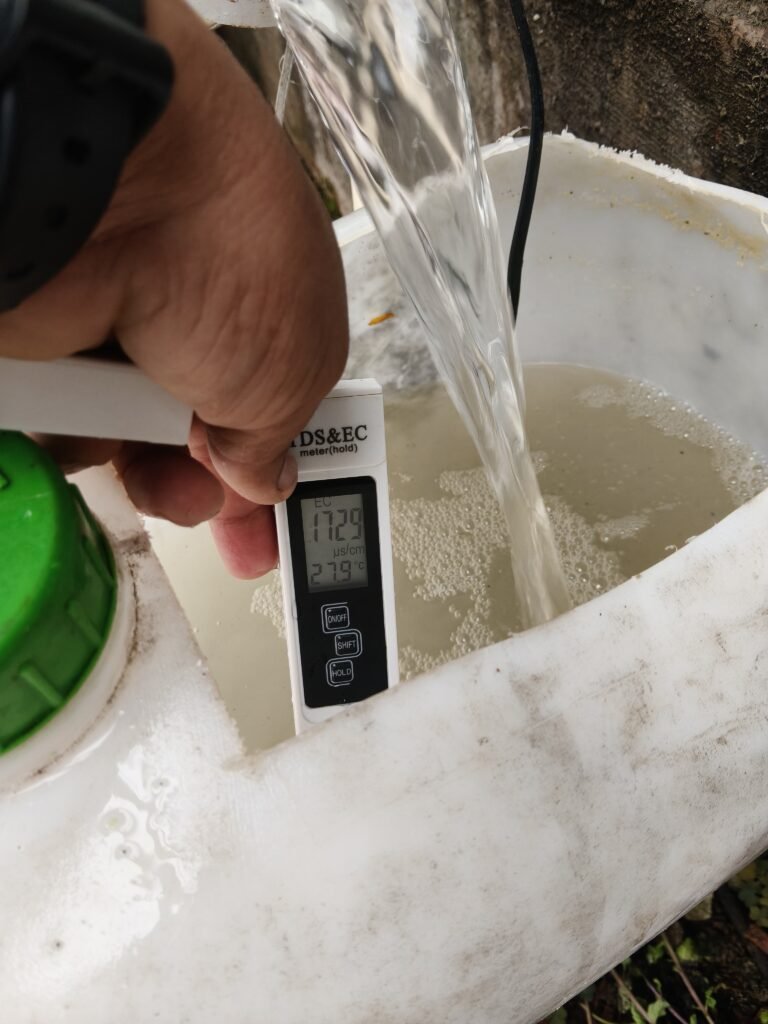
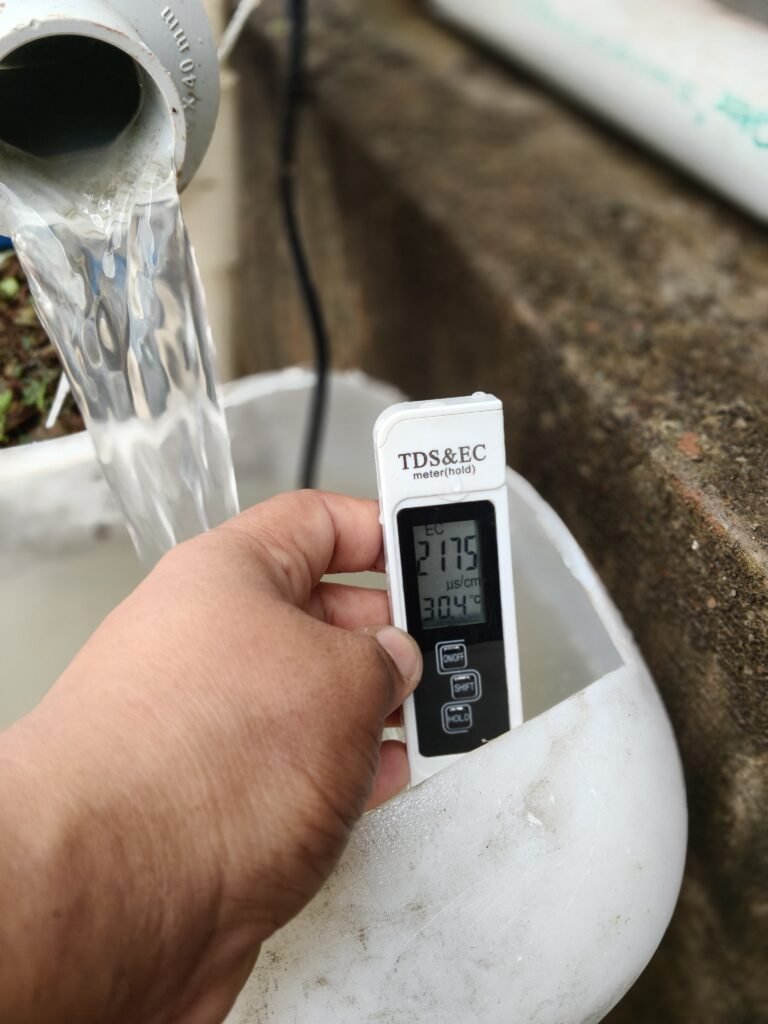
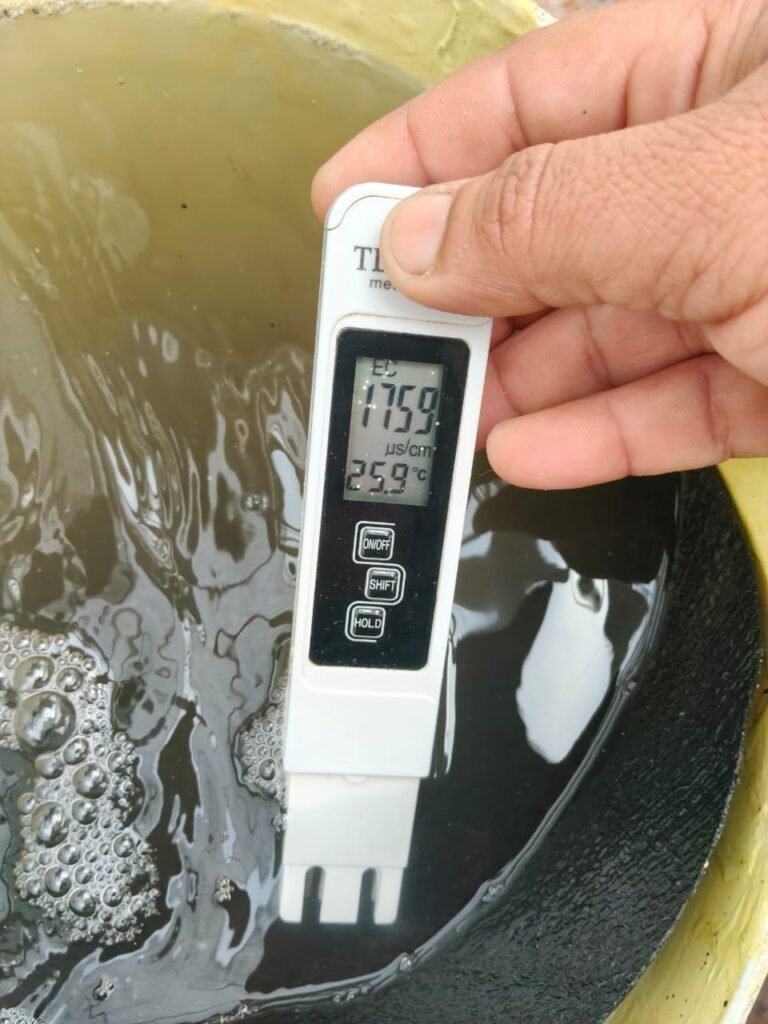
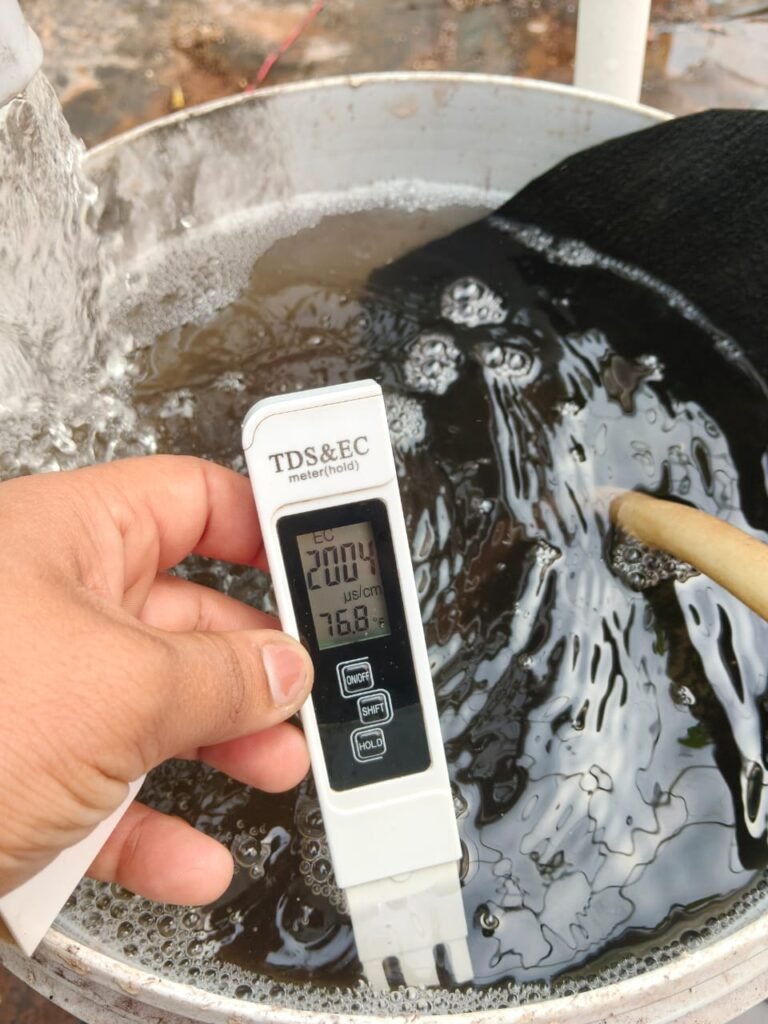
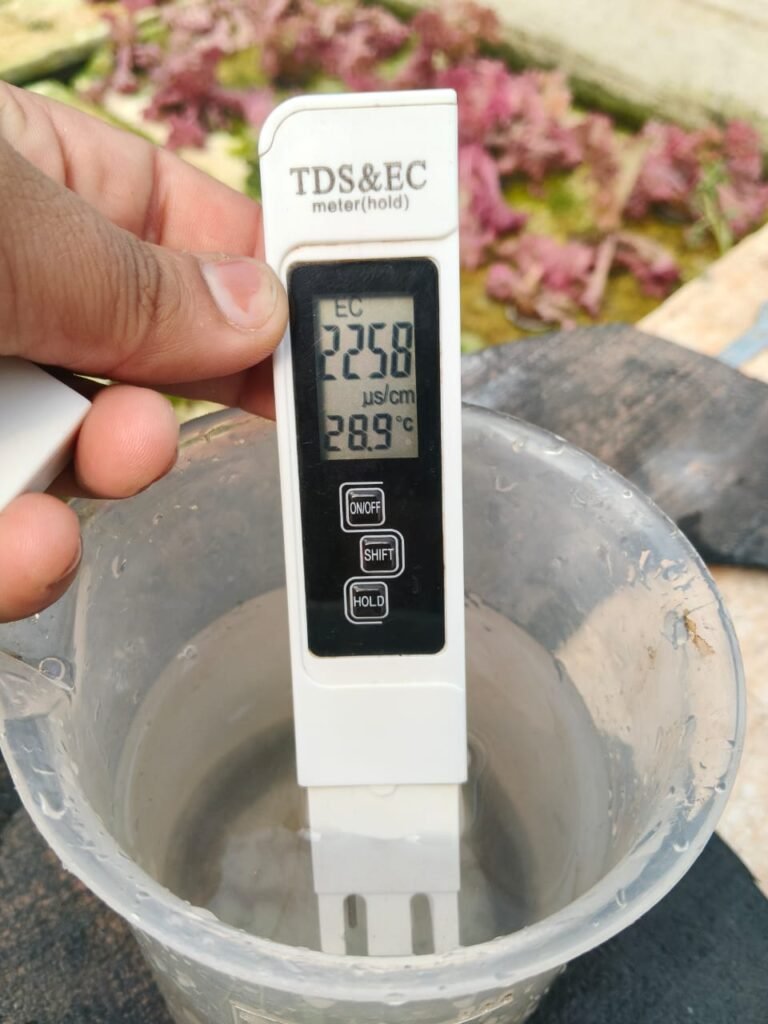
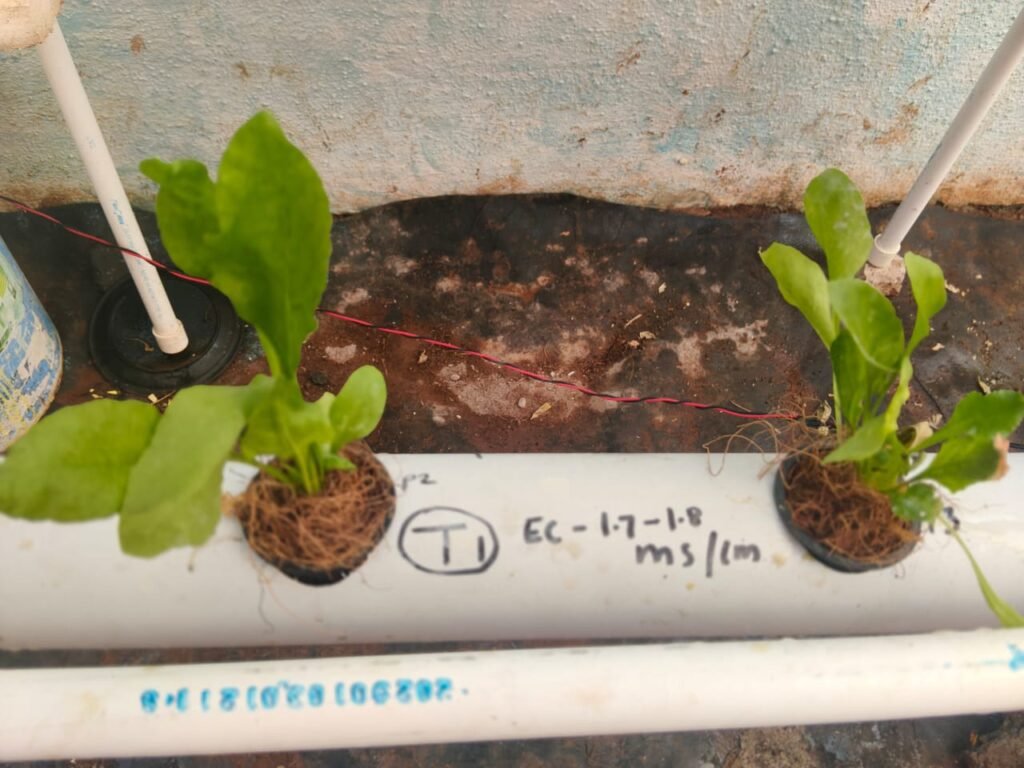
As decided during the discussion, I prepared an NFT hydroponic system to study the effect of different EC ranges. Three separate systems were set up, each maintained at a different EC level, while using the same type of fertilizer solution. A 20-liter nutrient tank was used for each system to ensure uniform water and nutrient supply. This arrangement allowed comparison of plant response under controlled but varying EC conditions.
| Experiment Trial No. | EC Range |
| Experiment 1 | 1.7 – 1.8 mS/cm |
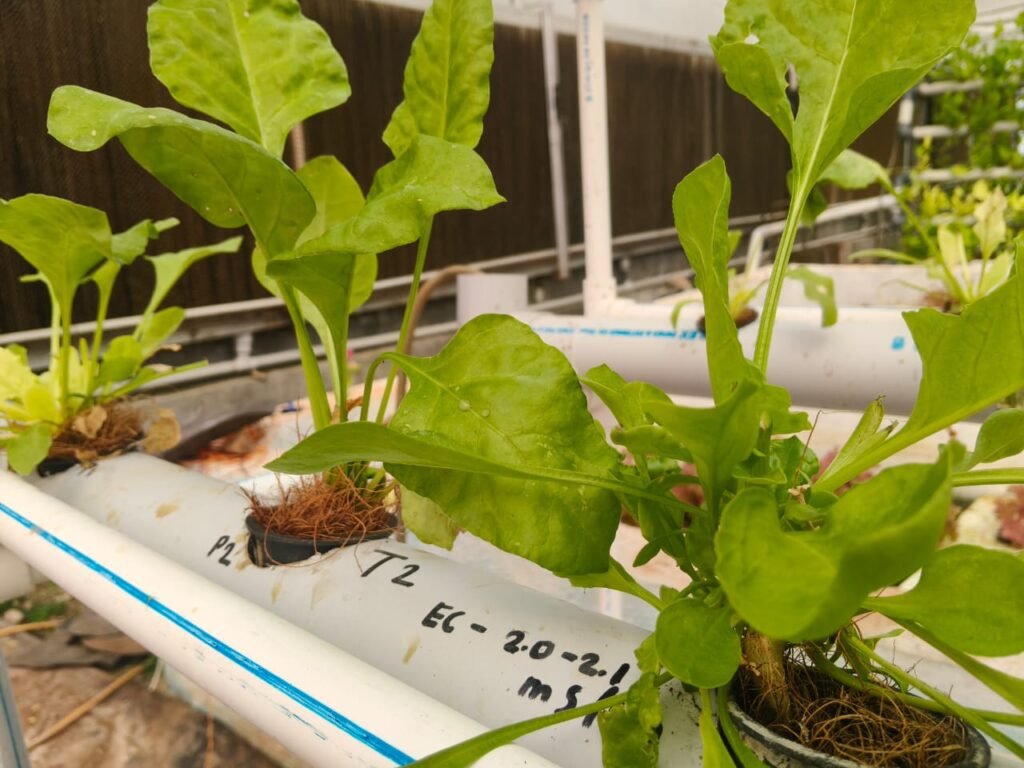
| Experiment 2 | 2.0 – 2.1 mS/cm |
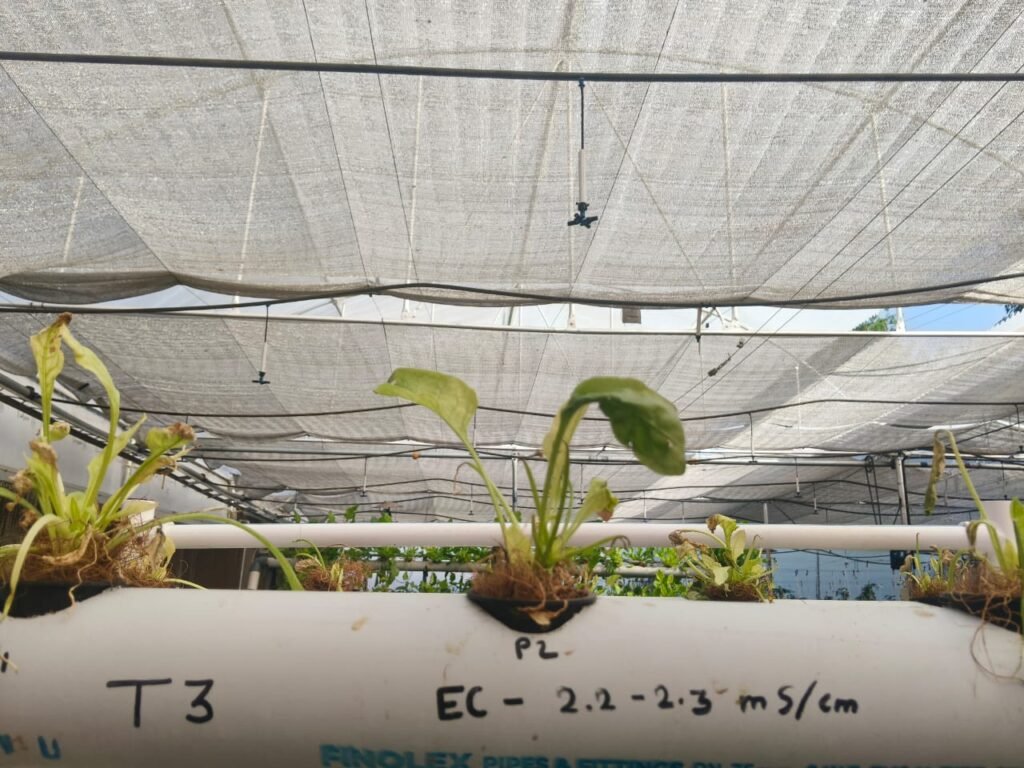
| Experiment 3 | 2.2 -2.3 mS/cm |
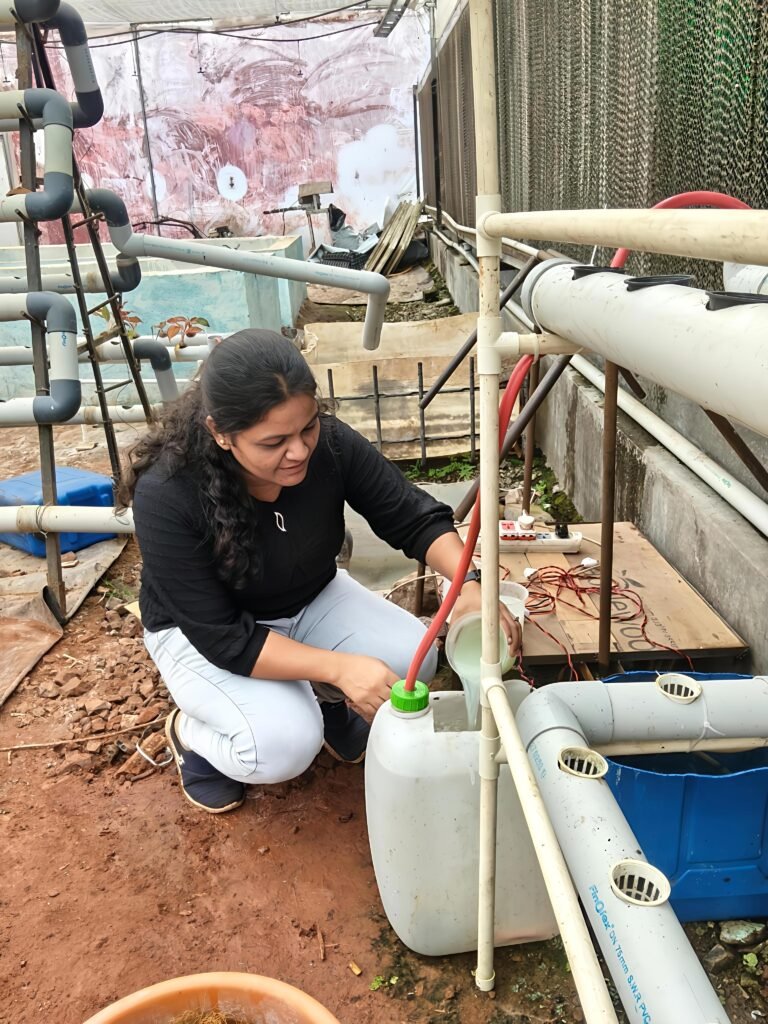
1.Adding nutrients to 20 L water in the reservoir to feed spinach plants in the NFT hydroponic system.
28 Sept 2025
On 28th September, I had a discussion with Dixit Sir. In that discussion, it was decided that after spinach, we will grow Aster plants in the hydroponic system. For this, I need to find out which type of hydroponic system is suitable for Aster plants. Also, documentation has to be prepared on Aster plants, and after that, the next discussion will be held .
3 Oct 2025 :
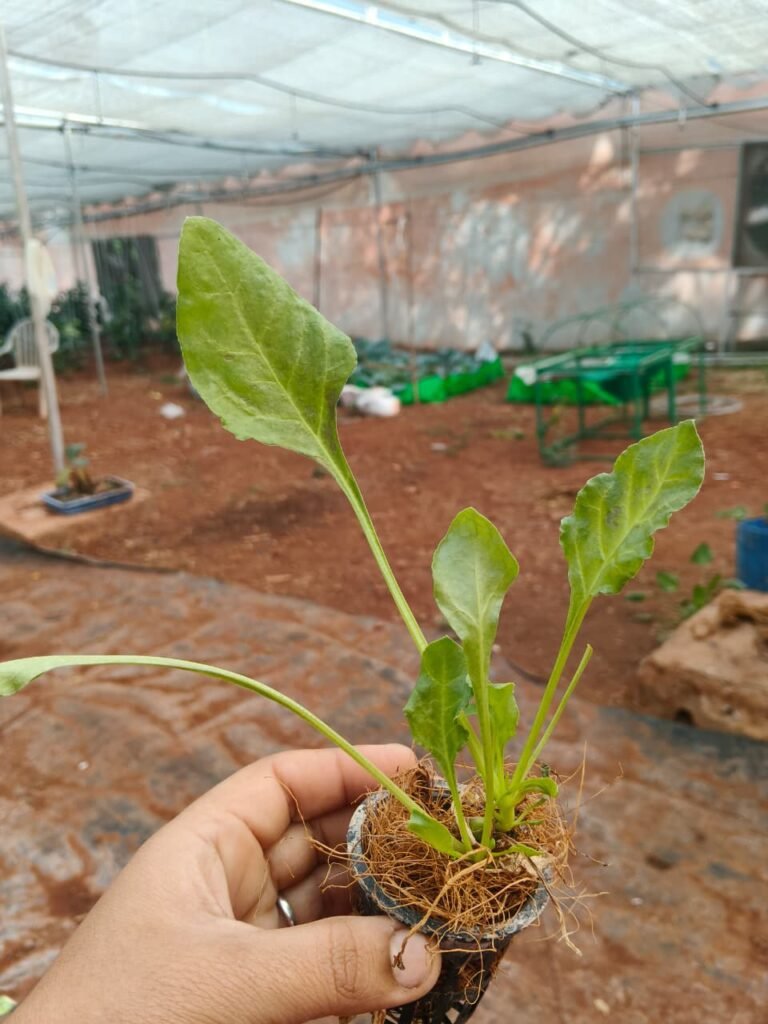
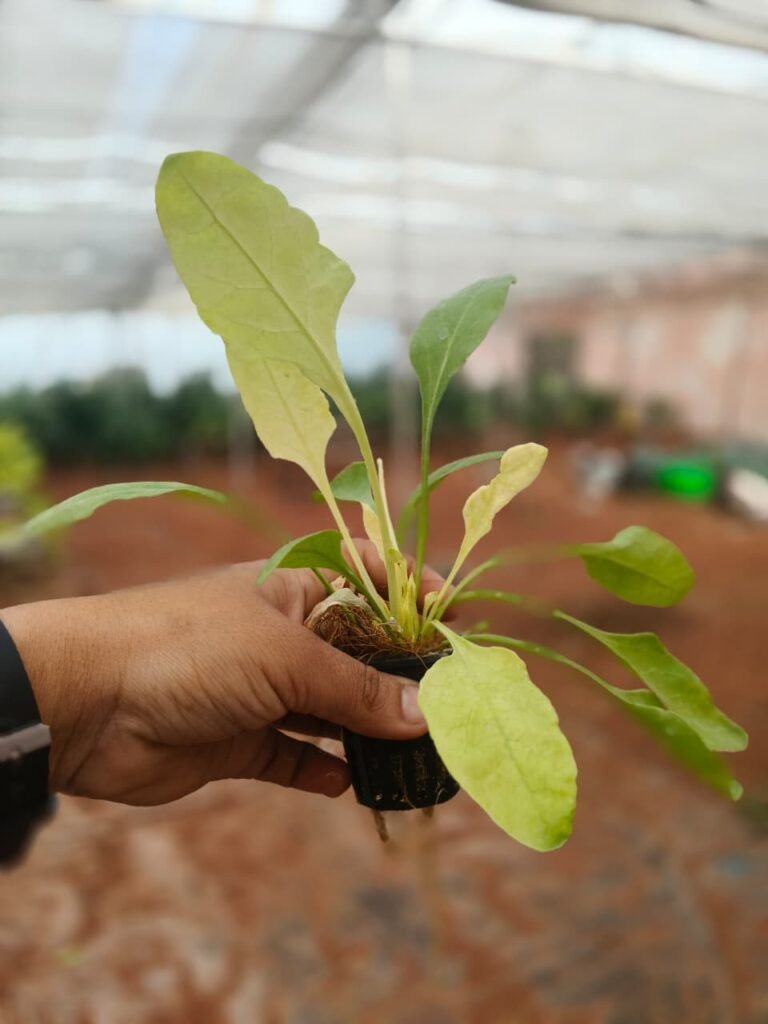
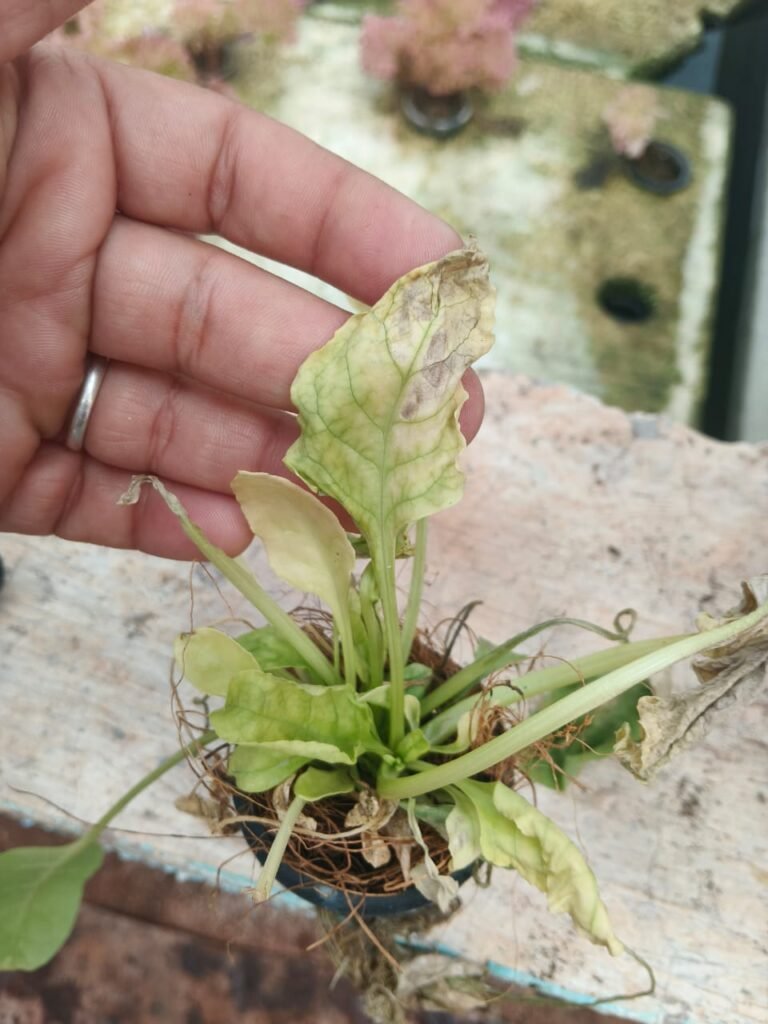
Observation of Three EC ranges:
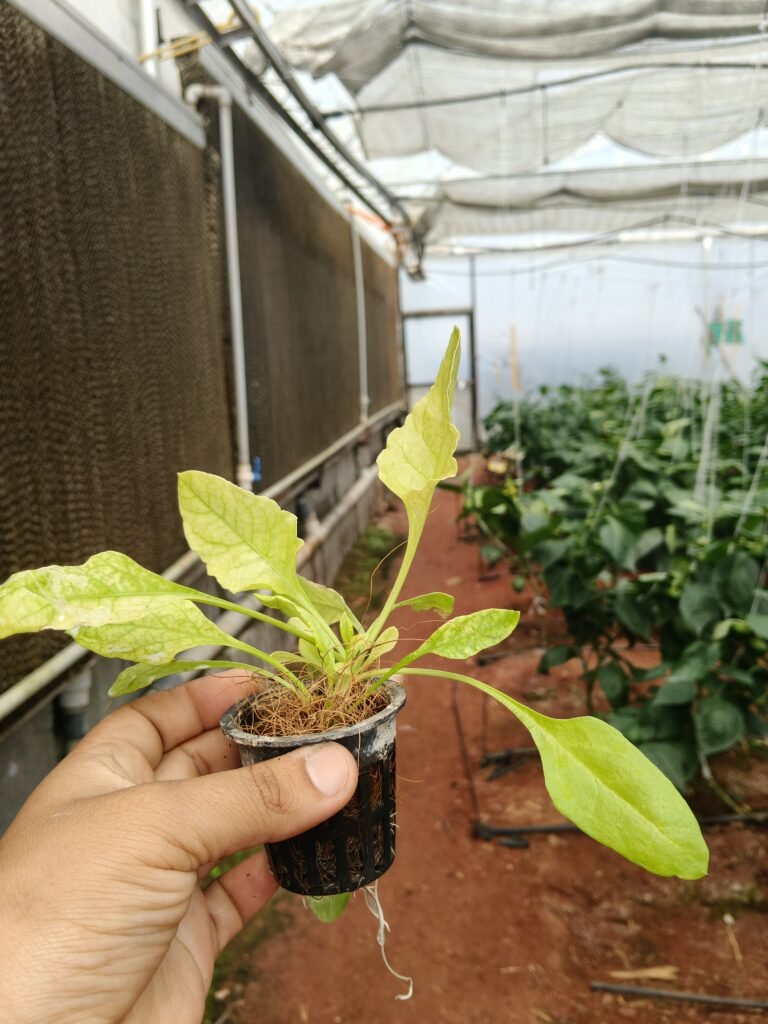
- Layer 1: EC 1.7 – 1.9 → no deficiency
- Layer 2: EC 2.0 – 2.1 → no deficiency
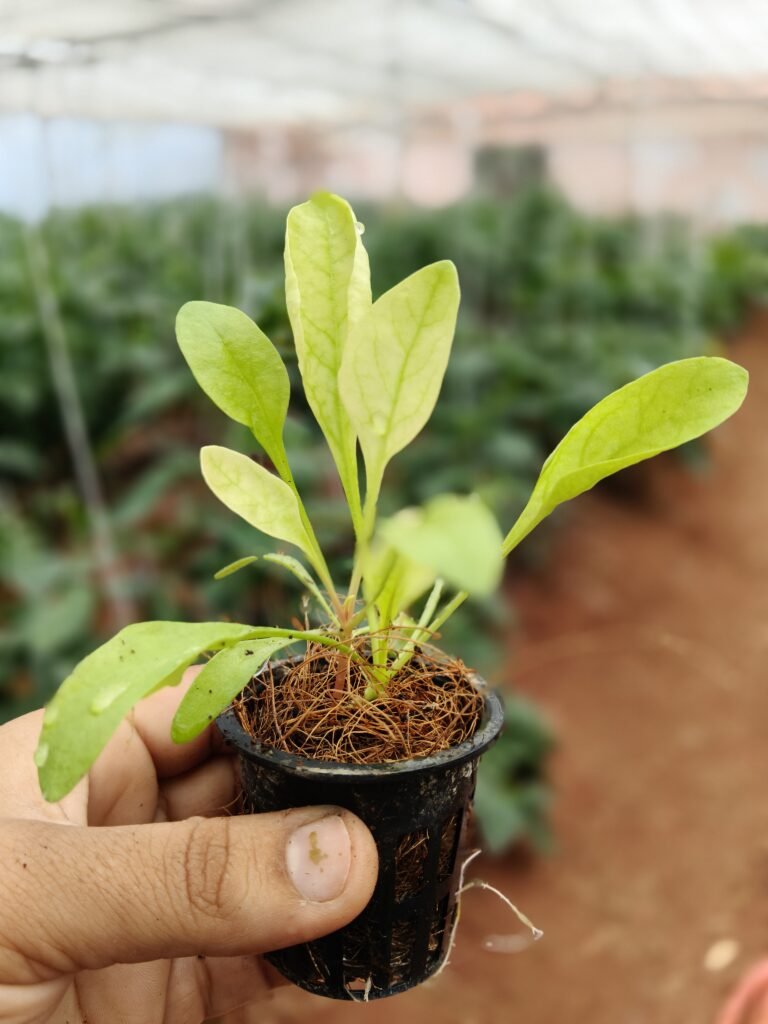
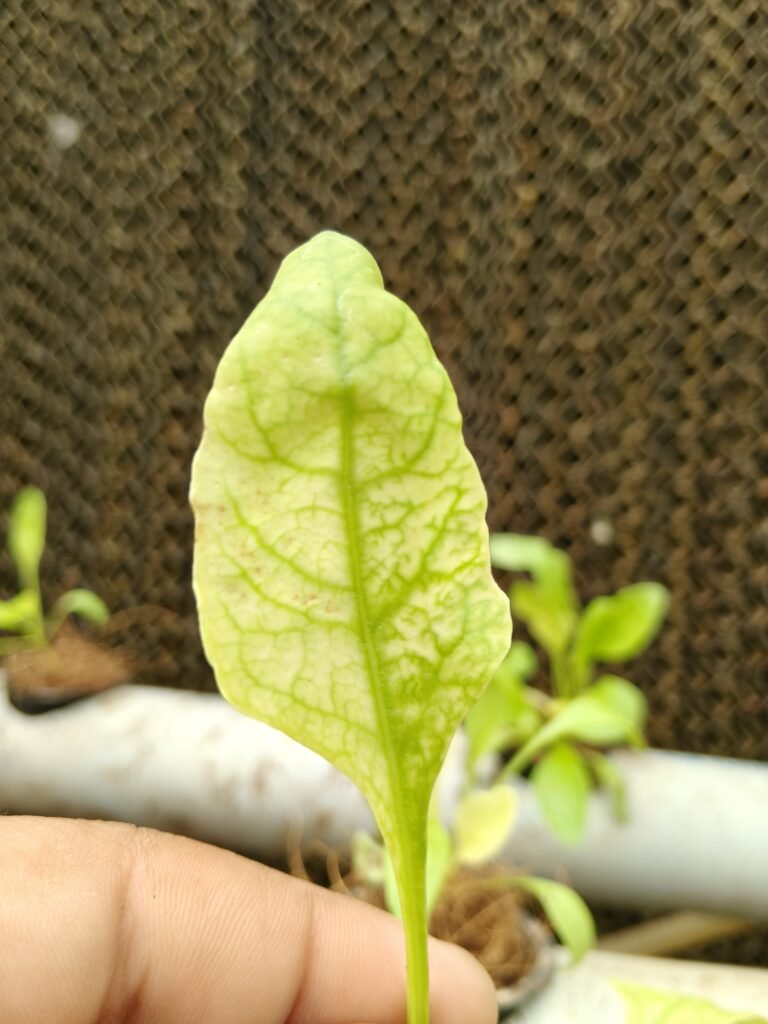
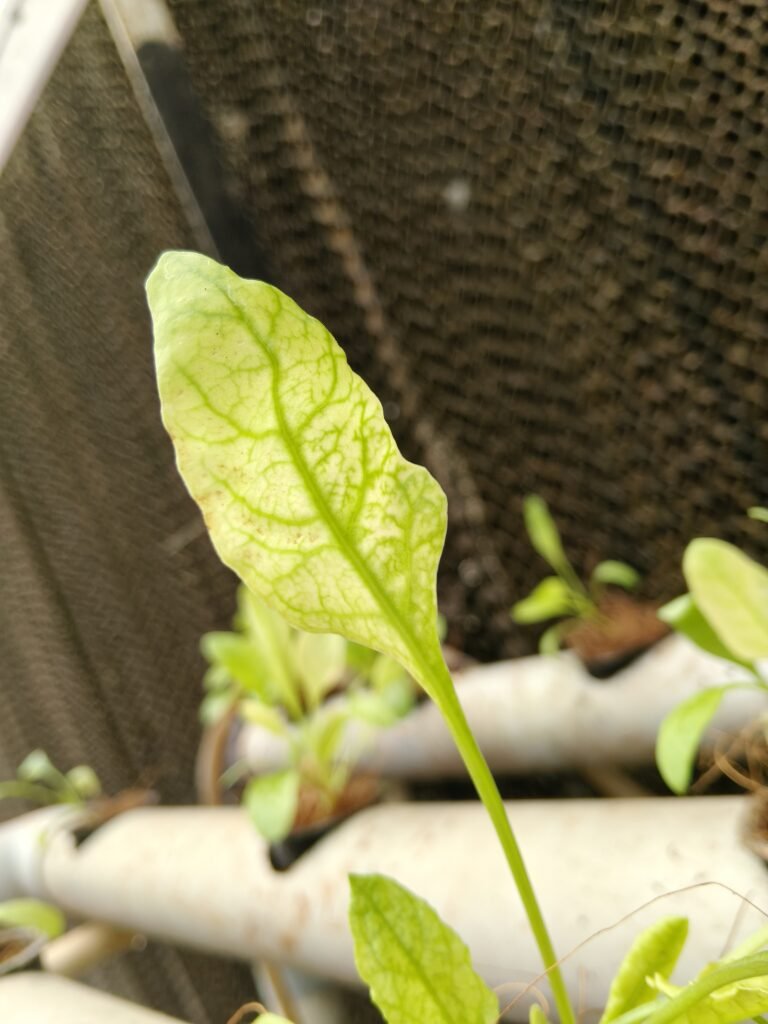
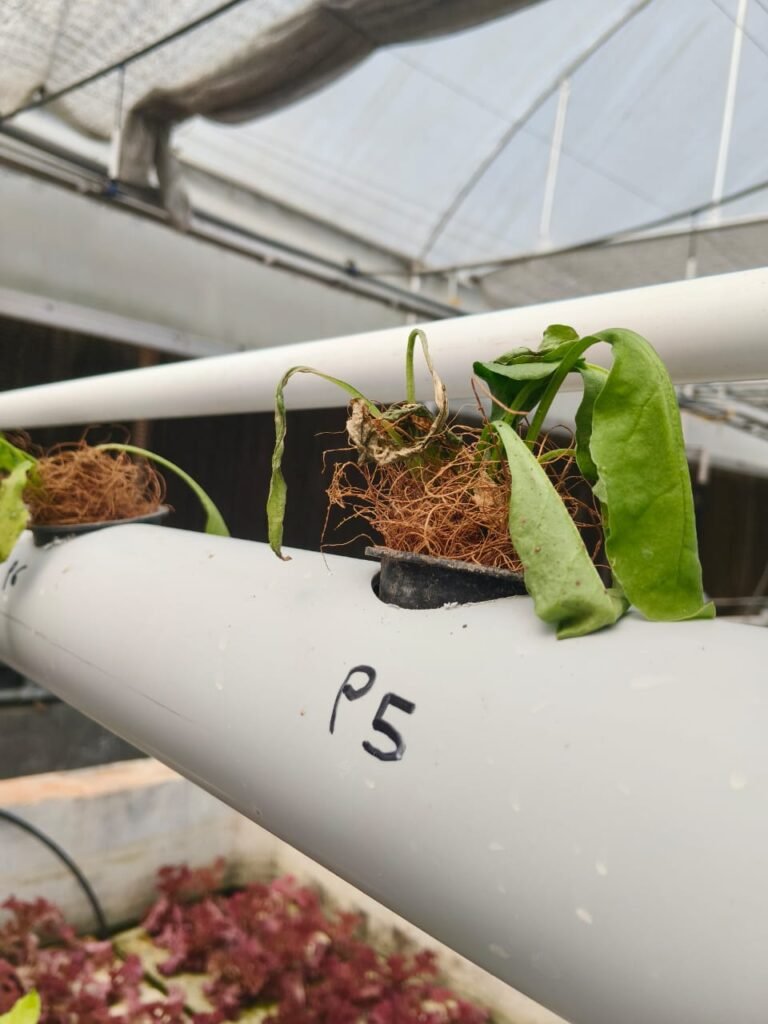
- Layer 3: EC 2.2 – 2.3 → deficiency symptoms (old leaf interveinal chlorosis).
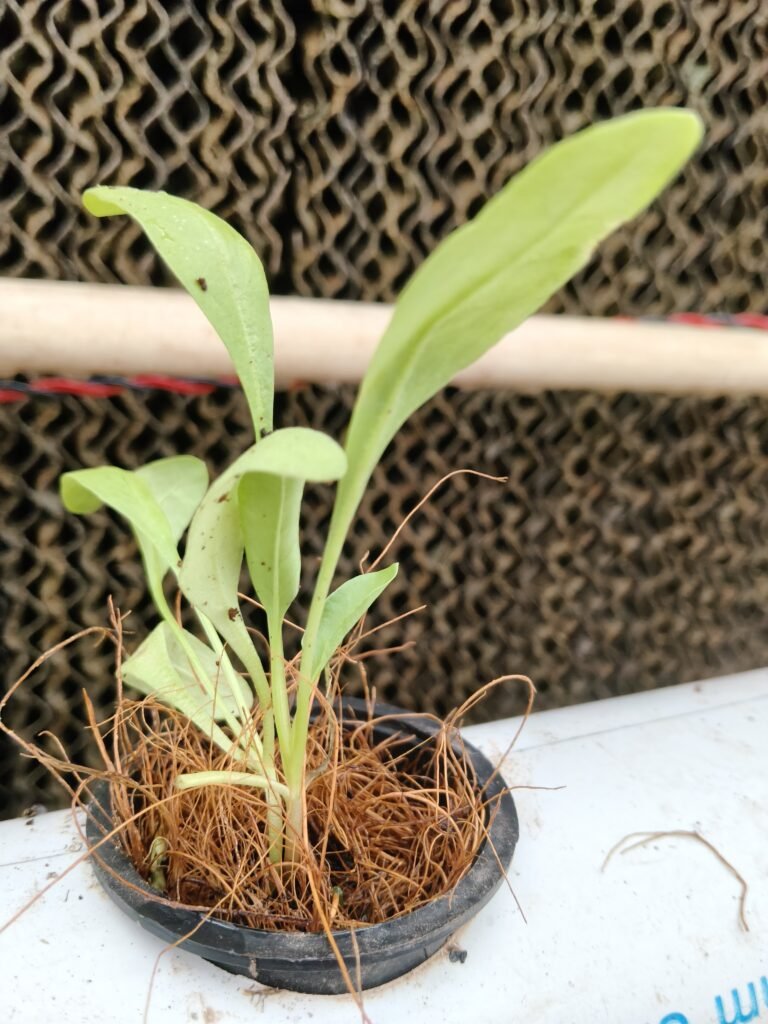
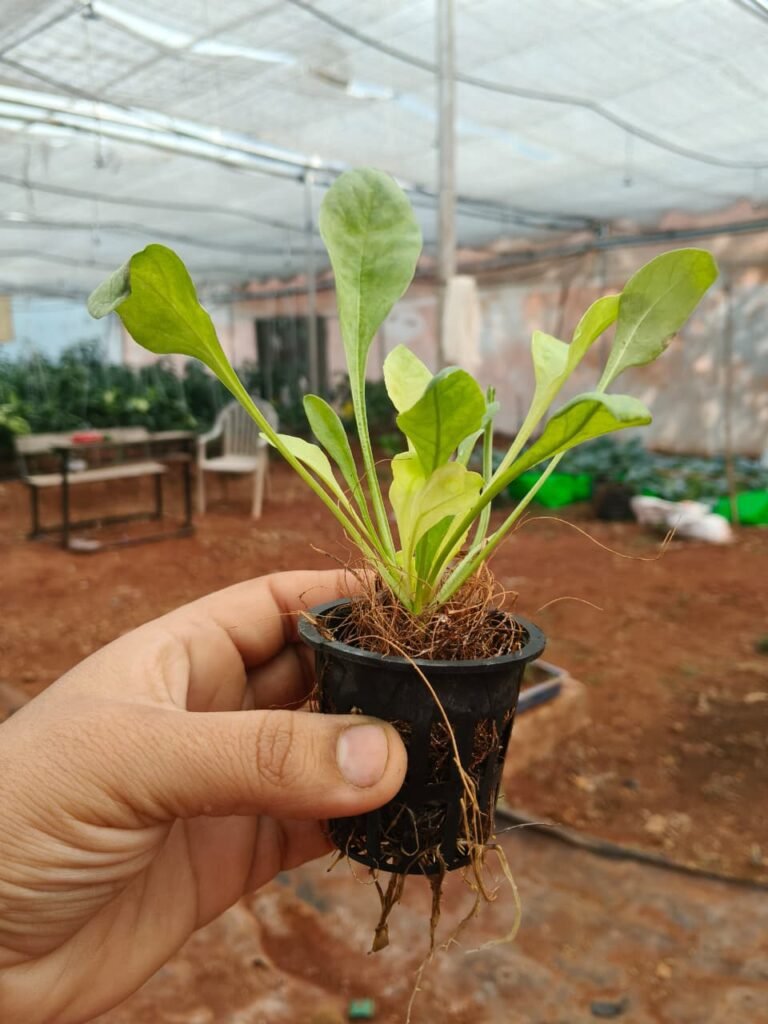
1st Week Observation Photograph
Why deficiency appears at higher EC?
- Nutrient Imbalance at High EC
- EC is just the total salt concentration, not the balance.
- If EC is raised mainly by Ca(NO₃)₂ or KNO₃, then Ca²⁺ and K⁺ ions increase.
- Both of these compete with Mg²⁺ for uptake at the root surface → so even if Mg is present, plants cannot absorb enough.
- Result = Mg deficiency symptoms at high EC.
- Osmotic Stress at Higher EC
- When EC rises above the optimal range for spinach, water and nutrient uptake slow down.
- Osmotic stress is the stress on plants that happens when the concentration of salts (EC) in the root zone is too high, making it difficult for roots to absorb water and nutrients through osmosis.
- High salts = low water uptake = plant stress.
- Roots face osmotic stress, which reduces the mobility of certain nutrients (like Mg, Ca, and micronutrients).
- pH + High EC Interaction
- At high EC, small pH fluctuations ( >6.2) reduce Mg solubility and absorption.
At higher EC, nutrient competition and osmotic stress → reduced Mg uptake → deficiency symptoms .
Interpretation :
- At EC 1.7–2.1 → balance is good, Mg uptake is fine.
- At EC 2.2–2.3 → excess Ca²⁺/K⁺ probably suppresses Mg uptake → visible Mg deficiency on old leaves.
Correction of Mg Deficiency Using Magnesium Sulphate
- Add MgSO₄ supplement → at EC 2.2–2.3, add extra 1–2 g per 20 L to prevent Mg lockout.
- Maintain pH ( 5.8–6.2).
8 Oct 2025
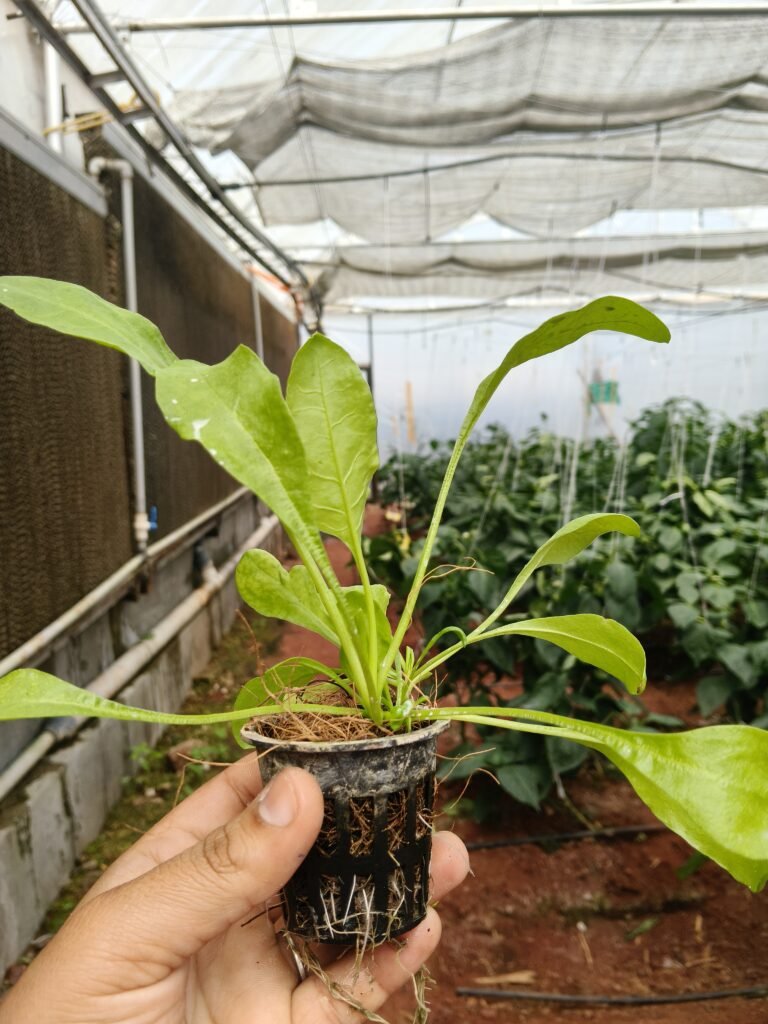
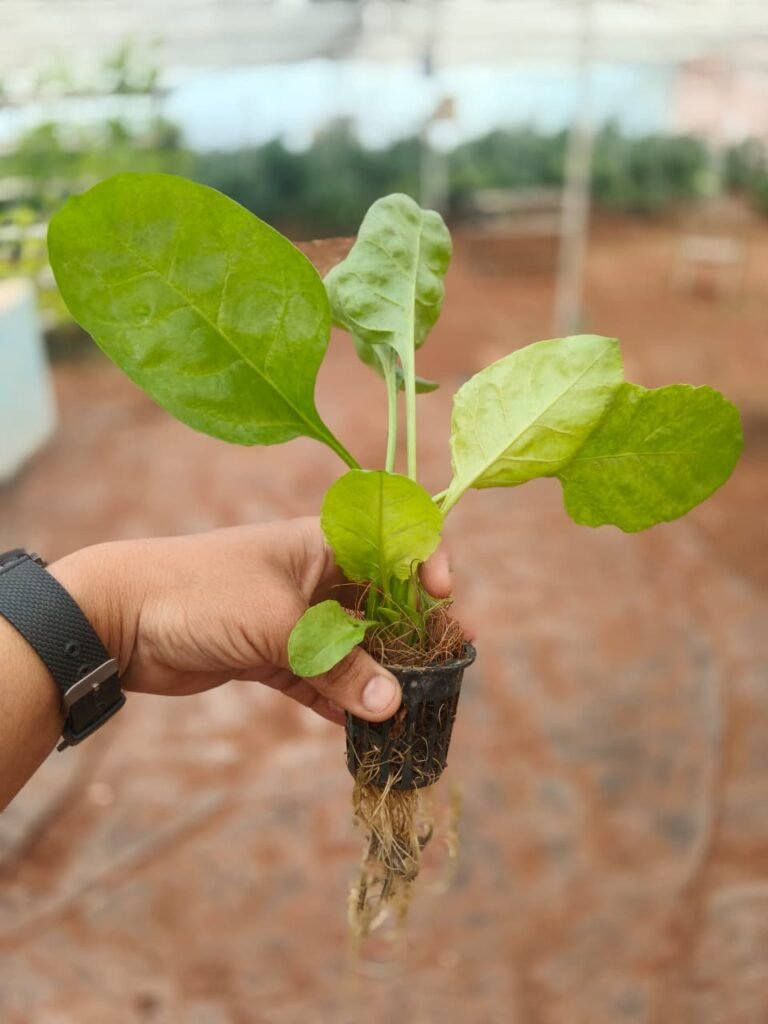
On 8th October, there was a discussion with Dixit sir about the spinach hydroponic EC experiment. In that discussion, it was observed that at an EC of 2.0–2.1 mS/cm, the plants showed very good growth and no deficiency symptoms were seen. It was concluded that this EC range is suitable for spinach. Now, we have decided to take the weight observations of plants from all three EC range systems.
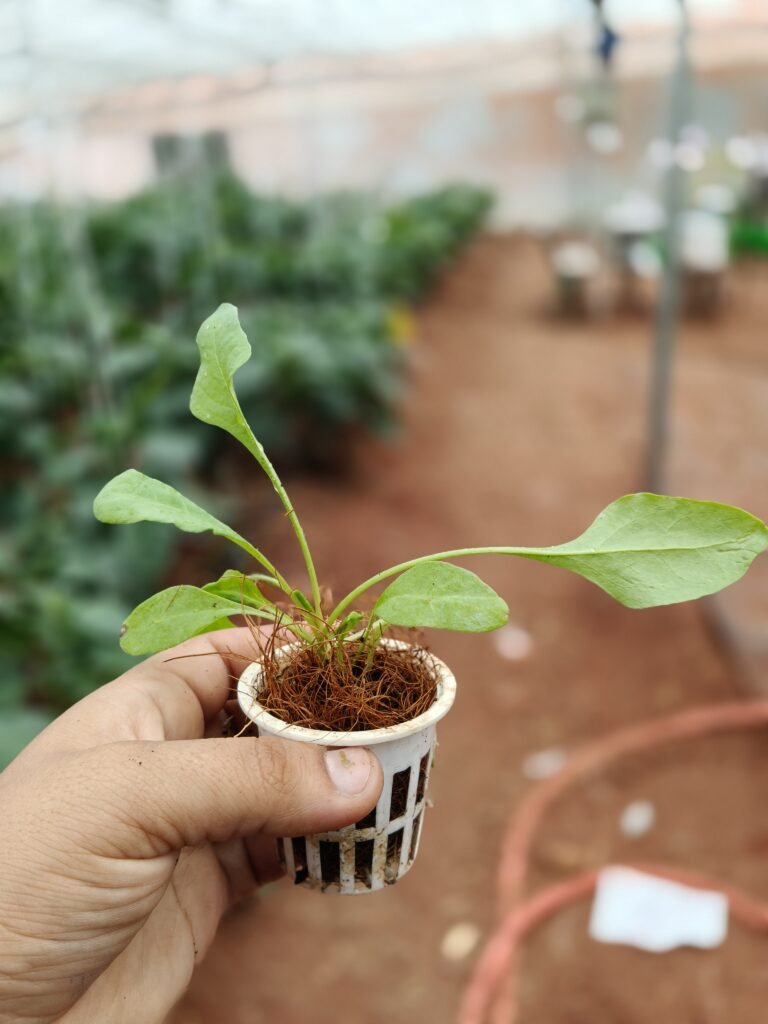
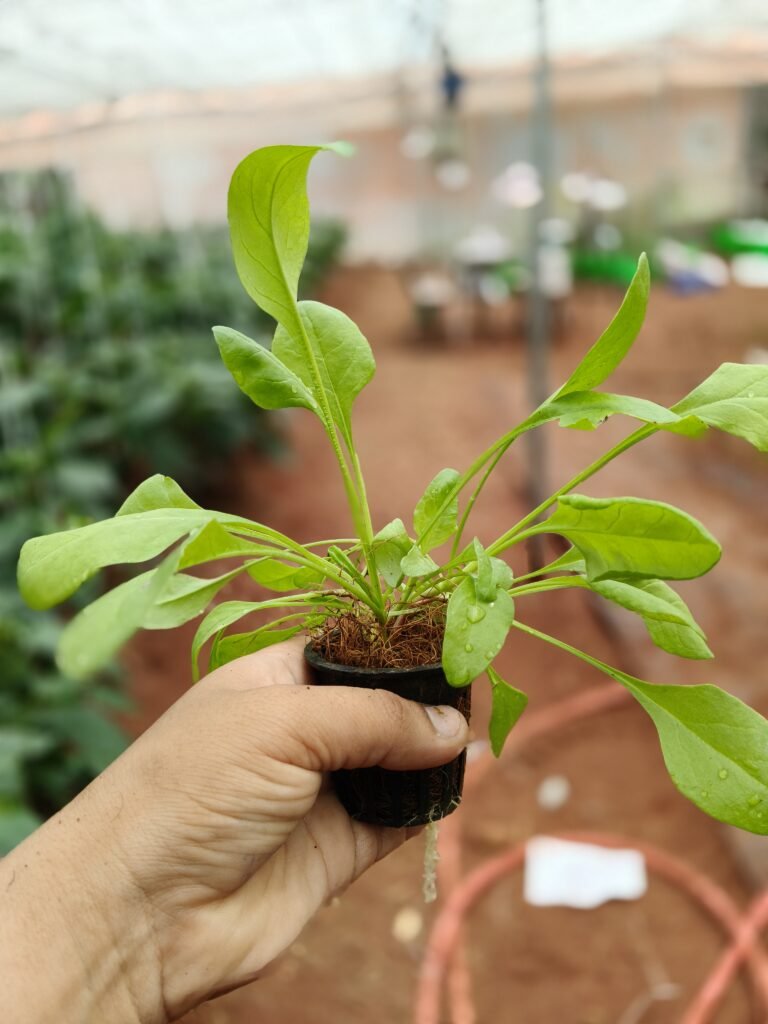
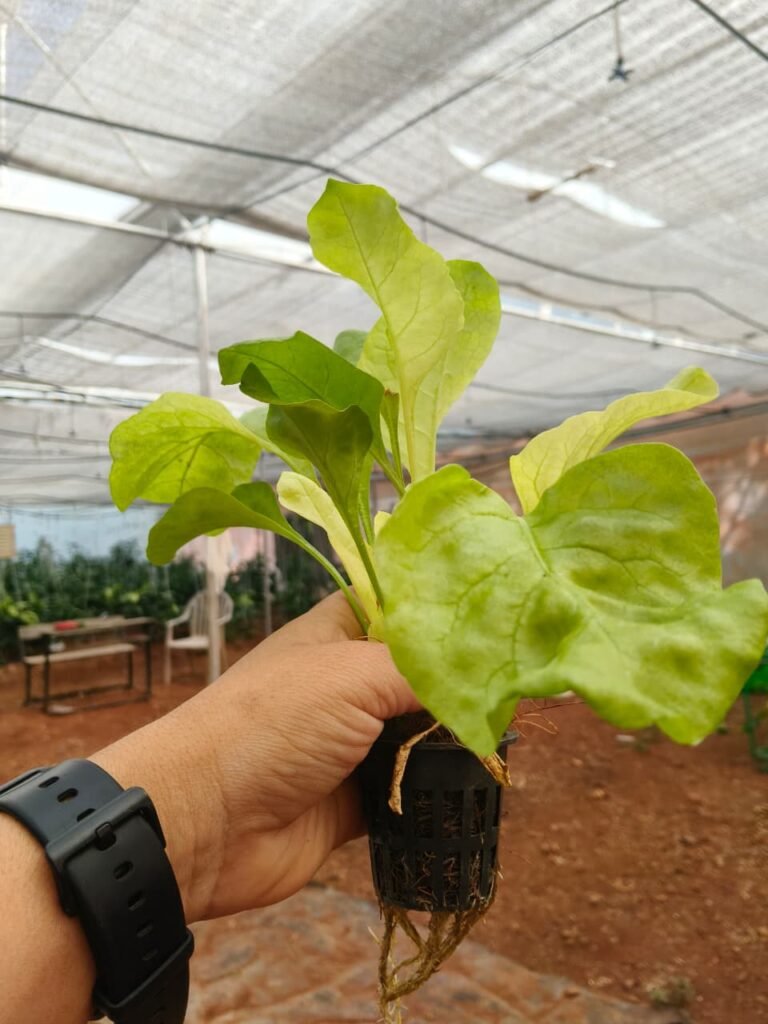
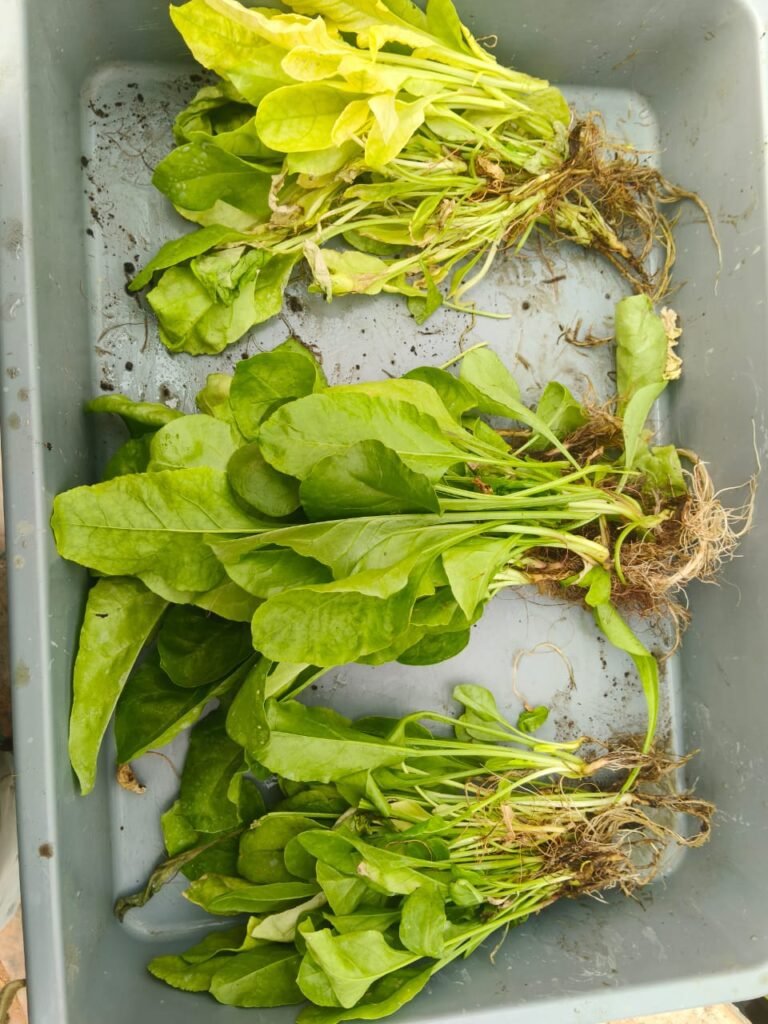
2 nd Week Observation Photograph
15 Oct 2025
Calculating the LOD of Spinach
(How much water is present in the spinach sample)
In simple terms, it shows the percentage of water that evaporates when the sample is dried.
Formula: LOD (%) = W₁ – W₂ / W₁ x 100
Where:
- W₁ = Fresh Weight (before drying)
- W₂ = Dry Weight (after drying)
Observations
| Sr. No. | EC Range (mS/cm) | Wet Wt. (Fresh Wt.) | Dry Wt. | LOD (%) |
|---|---|---|---|---|
| 1 | 1.7 – 1.9 | 70 g | 8 g | 88.57% |
| 2 | 2.0 – 2.1 | 137 g | 14 g | 89.78% |
| 3 | 2.2 – 2.3 | 57 g | 7 g | 87.71% |
Calculations
- EC 1.7 – 1.9 m S/cm = LOD (%) = 70 – 8 / 70 x 100 = 88.57 %
2. EC 2.0 – 2.1 m S/cm = LOD (%) = 137 – 14 / 137 x 100 = 89.78 %
3. EC 2.2 – 2.3 m S/cm = LOD (%) = 57 – 7 / 57 x 100 = 87.71 %
Conclusion :
The experiment on spinach grown under three EC ranges — 1.7–1.9 m S/cm, 2.0–2.1 m S/cm, and 2.2–2.3 m S/cm — showed clear variations in growth, nutrient balance, and moisture content (LOD).
- The highest LOD value (89.78%) was recorded at EC 2.0–2.1 mS/cm, indicating greater water retention and vigorous plant growth.
- At lower EC (1.7–1.9 mS/cm), plants grew normally but slightly slower, showing moderate moisture content (88.57%).
- At higher EC (2.2–2.3 mS/cm), plants exhibited magnesium deficiency symptoms (interveinal chlorosis on older leaves), due to nutrient competition and osmotic stress, with slightly reduced LOD (87.71%).
Hence, the optimum EC range for spinach in NFT hydroponics is 2.0–2.1 mS/cm, which ensures balanced nutrient uptake, healthy foliage, and ideal moisture levels for high-quality yield.
This study demonstrates how EC control directly influences plant physiology, nutrient availability, and overall productivity in hydroponic systems .
1 st Trial Report Link :
26 Oct 2025
On October 26, I showed Dixit Sir the final results of the spinach EC experiment. He was very happy with the observations and the outcome and asked me to repeat it to make sure the results are confirmed.
2-15 Nov 2025 – 4 Nov 2025
The EC experiment on spinach conducted during September–October was completed on 26th October. The experiment was checked by Ranjeet Sir and Dixit Sir, and the results were very good. I had written the conclusion of this experiment in the blog on 25th October. As per the suggestion of the sir, I am repeating this experiment. Earlier, the 3-layer NFT system was used for the Aster EC trial, for the spinach experiment, I have prepared a new 3-layer system.
5 Nov 2025
Objective of 2 nd Experiment :
In the first spinach EC experiment, magnesium (Mg) deficiency was observed at high EC ranges. EC measures the total salt concentration, not the nutrient balance. Increasing EC using Ca(NO₃)₂ or KNO₃ raises the levels of Ca²⁺ and K⁺ ions, which compete with Mg²⁺ at the root surface, leading to reduced magnesium uptake and visible deficiency symptoms.
To verify and confirm these results, a second EC experiment trial on spinach has been initiated.
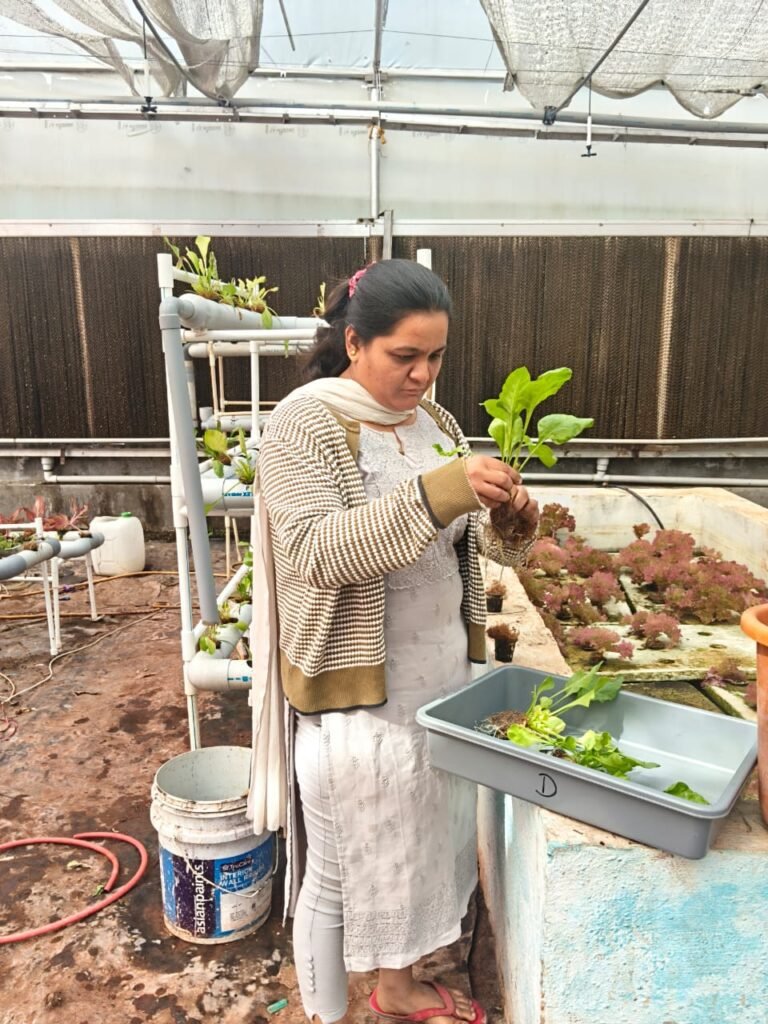
On 5th November, I transferred the spinach plants to the NFT hydroponic system. Each layer has 12 plants, making a total system capacity of 36 plants.
| Experiment Trial No. | EC Range |
| Experiment 1 | 1.7 – 1.8 mS/cm |
| Experiment 2 | 2.0 – 2.1 mS/cm |
| Experiment 3 | 2.2 -2.3 m S/cm |
Link of Spinach NFT Hydroponic Daily EC Maintenance sheet :
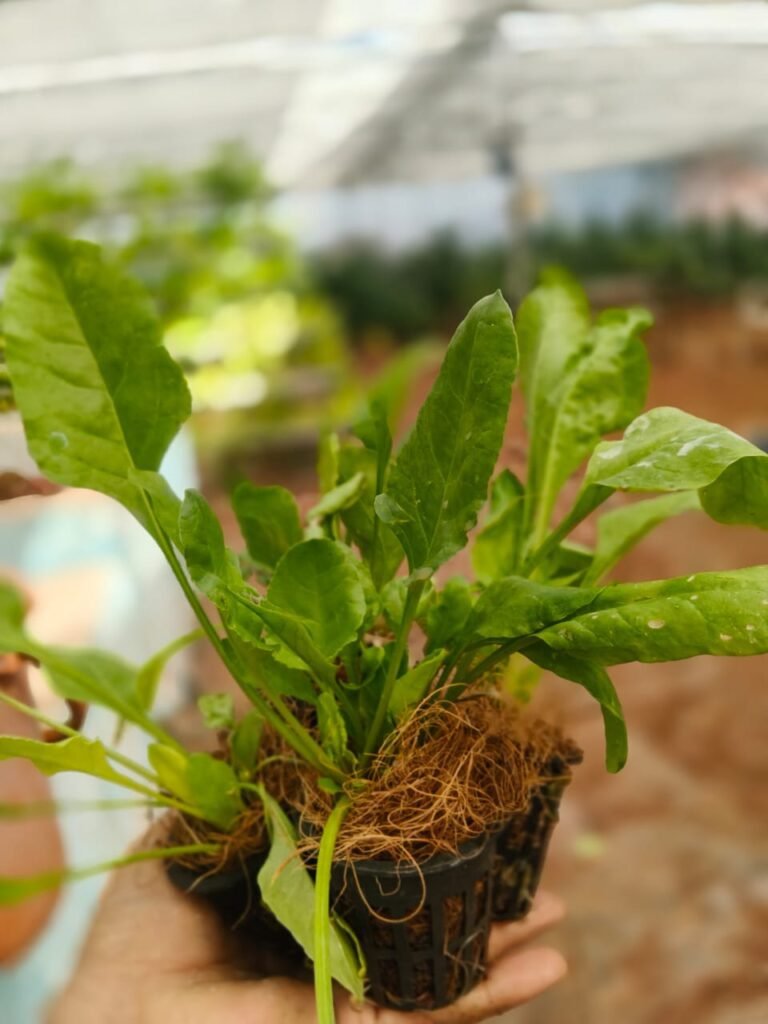
13 Nov 2025 (1st week Observation of spinach )
19 Nov 2025
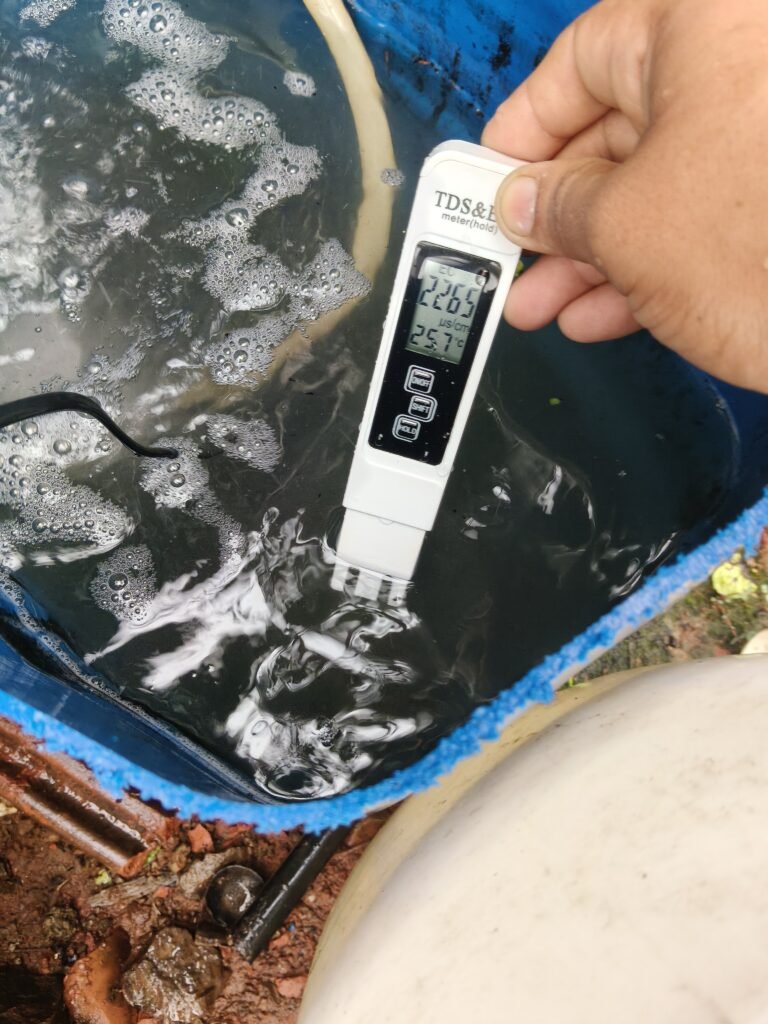
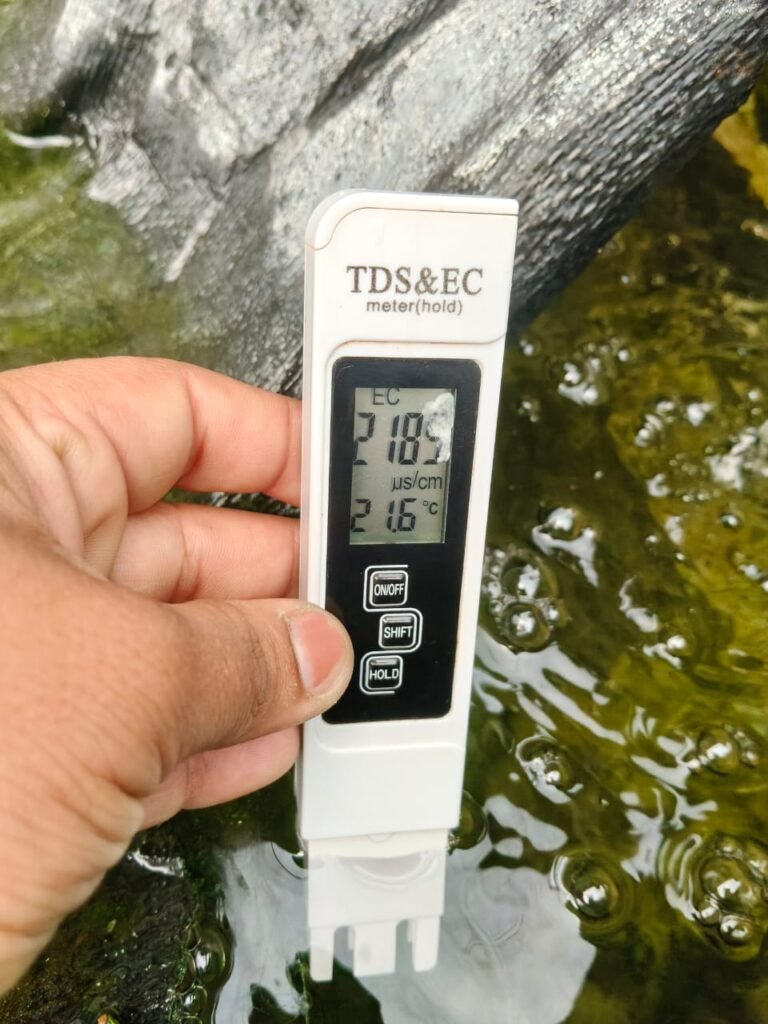
On 15th November, I checked the EC of the old and large NFT system in the polyhouse. The EC was maintained at 2.185 m S/cm. The system’s dosing and EC range (2.0–2.1 m S/cm) were maintained , based on the results obtained from the first spinach trial. The results are as follows :
27 Nov 2025 (2 nd week Observation of spinach)
| EC: 1.7 – 1.8 m S/cm : 1. Leaves appear light green and slightly pale. 2. Leaf size is comparatively smaller. 3. Growth seems slow. | EC: 2.0 – 2.1 m S/cm: 1. Leaves are broader and more open. 2. Color is healthy light–medium green. 3. Growth seems uniform. 4. Plant is showing balanced nutrient uptake. 5. Good vegetative growth and healthy leaf formation. | EC: 2.2 -2.1 m S/cm Plant is still healthy but starting to show initial signs of nutrient concentration stress |
5 Dec 2025
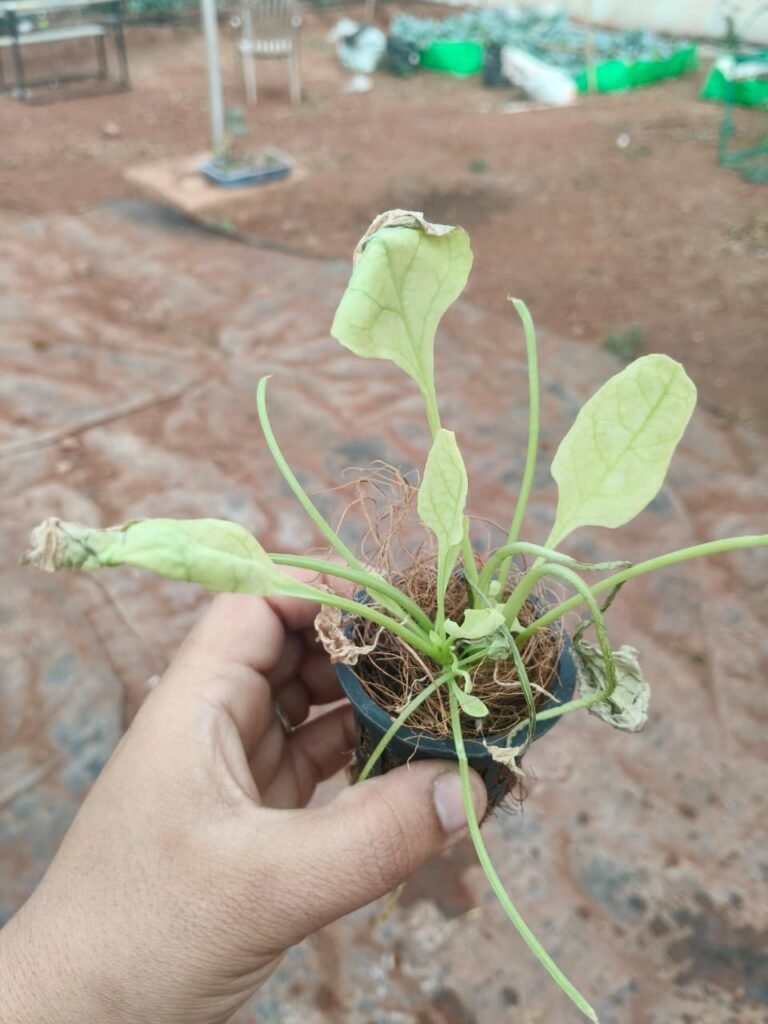
5 Dec Observation
- 1. EC = 1.8 – 1.9 m S/cm light green to yellowish leaves, indicating a possible nitrogen deficiency .
- 2. EC = 2.0 – 2.1 m S/cm healthy green leaves with good root growth — a sign of proper nutrition and oxygenation.
- 3. EC = 2.2 – 2.3 m S/cm wilting, pale, and slightly burnt leaf edges, which may result from high EC in the nutrient solution.
10 Dec 2025
On December 10, a discussion was held with Dixit Sir on Google Meet. It was decided to harvest Spinach EX. 2 and plant Aglaonema in the same system.
10 Dec 2025
| Treatment | EC Range (mS/cm) | Observation |
|---|---|---|
| T1 | 1.7 – 1.8 | Plants small but healthy; moderate green color |
| T2 | 2.0 – 2.1 | Plants vigorous, dark green leaves, best growth |
| T3 | 2.2 – 2.3 | Leaves slightly wilted, signs of nutrient stress. |
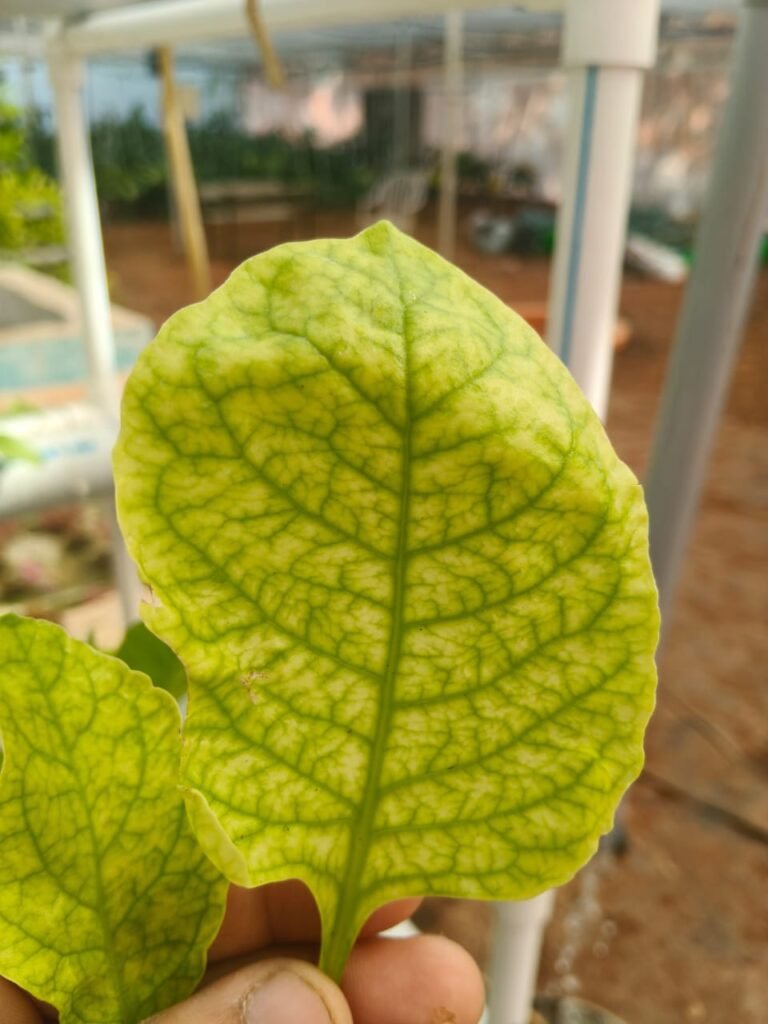
| Feature | Magnesium (Mg) Deficiency |
|---|---|
| Leaf Age Affected | Old / lower leaves first |
| Pattern | Broad yellowing between veins, sometimes entire leaf pale |
| Location on Plant | Lower part |
| Mobility in Plant | Mobile (moves from old to new leaves) |
| Cause in Hydroponics | Imbalance of Ca/K competing with Mg |
13 -14 Dec 2025
Harvesting of Spinach and LOD calculation
| EC – 1.8 -1.9 m S/cm | EC – 2.0 – 2.1 m S/cm | EC – 2.2 – 2.3 m S/cm |
| LOD: Fresh Weight – 72 gm Final Dry Wt. – 6 gm LOD = 91.67 % | LOD: Fresh Weight – 167 gm Final Dry Wt. – 14 gm LOD = 91.62 % | LOD: Fresh Weight – 63 gm Final Dry Wt. – 7 gm LOD = 88.89 % |
LOD = Fresh Wt. – Dry Wt. / Fresh Wt. X 100
Conclusion: Spinach EC Trial
The second EC experiment on spinach successfully verified the relationship between electrical conductivity (EC) levels and plant growth performance.
- Optimal EC Range:
The best growth and leaf development were observed at EC 2.0 – 2.1 mS/cm. Plants in this range showed vigorous growth, dark green leaves, balanced nutrient uptake, and healthy root systems. - Low EC (1.7 – 1.8 mS/cm) :
- At EC 1.7–1.8 mS/cm, plants survive and grow, but vegetative growth is limited and biomass accumulation is low
- Plants did grow, but growth rate was slower compared to the optimal EC (2.0–2.1 mS/cm).You would typically observe increase in height (elongation) but less vegetative development — meaning smaller, fewer, and thinner leaves.
- At low EC, the nutrient concentration in the solution is too low, so plants can’t take up enough nitrogen and other essential elements. As a result, spinach tries to stretch upward to search for more light and nutrients (slight height increase), but leaf size, color, and biomass remain low.
High EC (2.2 – 2.3 mS/cm):
Plants showed wilting, pale leaves, and leaf-edge burn, suggesting nutrient stress and reduced magnesium (Mg) uptake caused by competition from excess Ca²⁺ and K⁺ ions. - Magnesium Deficiency Confirmation:
At high EC (2.2–2.3 mS/cm), older leaves displayed interveinal chlorosis typical of Mg deficiency, confirming that elevated EC caused nutrient imbalance rather than improved nutrition. - Loss on Drying (LOD) Analysis :
| EC Range (m S/cm) | Fresh Wt. (g) | Dry Wt (g) | LOD (%) | Observation |
| 1.8 – 1.9 | 72 | 6 | 91.67 % | Low biomass, poor growth |
| 2.0 – 2.1 | 167 | 14 | 91.62 % | Highest biomass and healthy plants |
| 2.2 – 2.3 | 63 | 7 | 88.89 % | Stressed plants, low yield. |
Final Conclusion
Maintaining EC between 2.0 and 2.1 mS/cm provides the best nutrient balance and growth performance for spinach in NFT hydroponics.
EC levels above 2.3 mS/cm lead to nutrient imbalance and magnesium deficiency, while below 1.8 mS/cm result in nutrient insufficiency and slower growth.
Link of Final Report On Spinach Hydroponic:
https://docs.google.com/document/d/1rh2mD9dIs6nYZeYcnzk7pd60MbbskFEY/edit?usp=drivesdk&ouid=107343725097652602612&rtpof=true&sd=true


