Introduction
QGIS is a free and open-source Geographic Information System (GIS) software. It’s a versatile tool for viewing, editing, analyzing, and publishing geospatial data, allowing users to create maps, perform spatial analysis, and manage geographic information.
Key Features and Functions:
- Spatial Data Analysis
- Mapping and Visualization
- Data Management
- User-Friendly Interface
- Open-Source Nature
Common Uses:
- Mapping and Spatial Analysis: QGIS is widely used for creating maps, analyzing spatial data, and visualizing geographical information.
- Geospatial Data Management: It can be used to organize, manage, and analyze geospatial data from various sources.
- Scientific Research:QGIS is employed in scientific research for analyzing geographical data, modeling, and visualization.
- Education and Training:QGIS is a popular software for teaching and learning about GIS concepts and techniques.
- Government and Public Administration: It is used by government agencies for managing land use planning, resource management, and other spatial applications.
May 27 – May 31: Getting Coordinates and Preparing Data
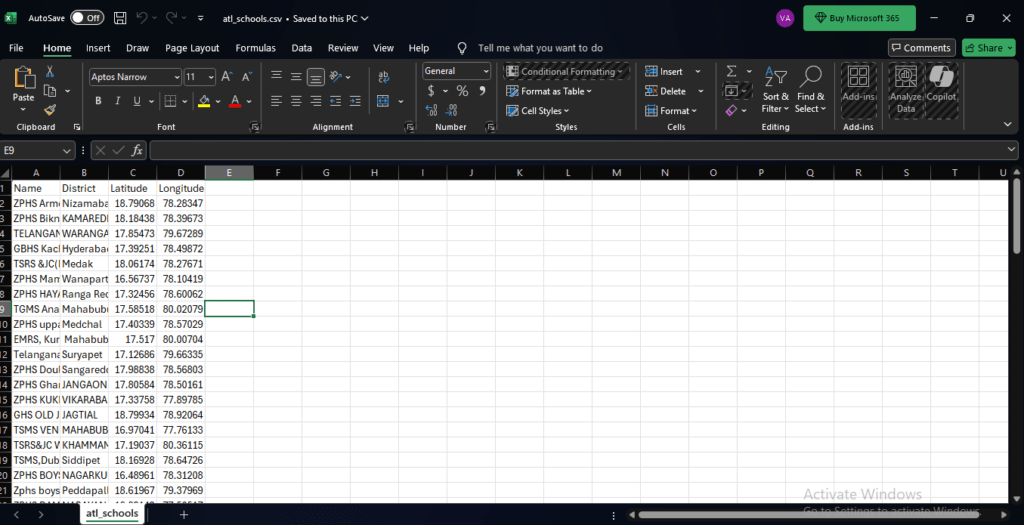
I started by collecting information about ATL schools, IBT schools, LCM schools, and different technology locations across India. These were all in Excel files without latitude and longitude. So, I used a website called EZ Geocode to convert school and tech addresses into proper coordinates. i needed accurate latitude and longitude to appear correctly on a map. I made sure each CSV was clean and properly formatted.
June 1 – June 4: QGIS Mapping and Layer Creation
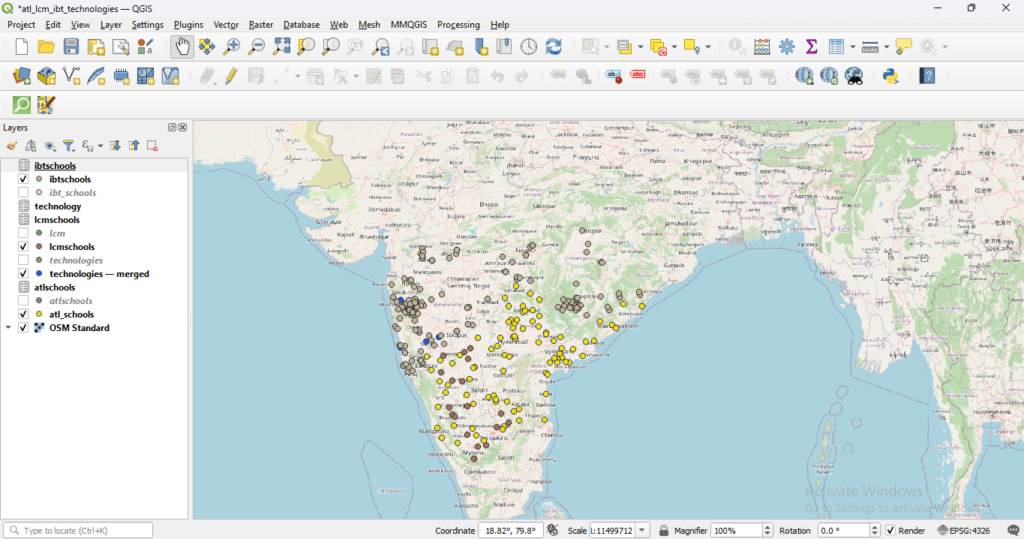
Using QGIS, I imported my CSV files and added them as separate layers on an OpenStreetMap base layer. I saved the QGIS project and exported each layer to a separate CSV so I could use them in the web app later. I saved Atl, Ibt, Lcm and technologies as separate layers in 4 projects and then combined it into one. Initially, this helped me visualize everything nicely and make sure the data was clean and organized. I used different layers and colors in QGIS for different types, which gave me a great visual understanding of the data.
June 5 – June 8: Planning the Full-Stack App
I had to build a website where anyone could search for a school or technology and instantly see its location on the map. The frontend was built using Vite + React + TypeScript. I focused on creating the backend using Python Flask and a lightweight database: SQLite.
Problems I faced:
- I didn’t know how to connect backend to frontend.
- I didn’t know how to structure backend files.
- CSV headers didn’t match table columns and gave errors.
How I solved it:
- I learned how to create routes in Flask.
- I created a
load_data.pyscript to insert CSV data into a SQLite database. - I normalized column names and carefully matched them to avoid loading issues.
June 9 – June 12: Backend Setup + API Building
I created API routes in Flask. Each route fetched data from SQLite and returned it as JSON. Then I updated the React frontend to fetch and display the number of schools or technologies found. Frontend couldn’t talk to the backend because of a CORS error. I fixed it by adding CORS(app) in my app.py.
This worked well until things started growing. As I added more data and wanted to allow file uploads, I ran into a few problems: Every time I added a new CSV or GeoJSON file, I had to run a script again (load_data.py) to update the database and it was getting complicated to manage local storage, APIs, and databases all at once. That’s when I decided to switch to firebase.
June 14:
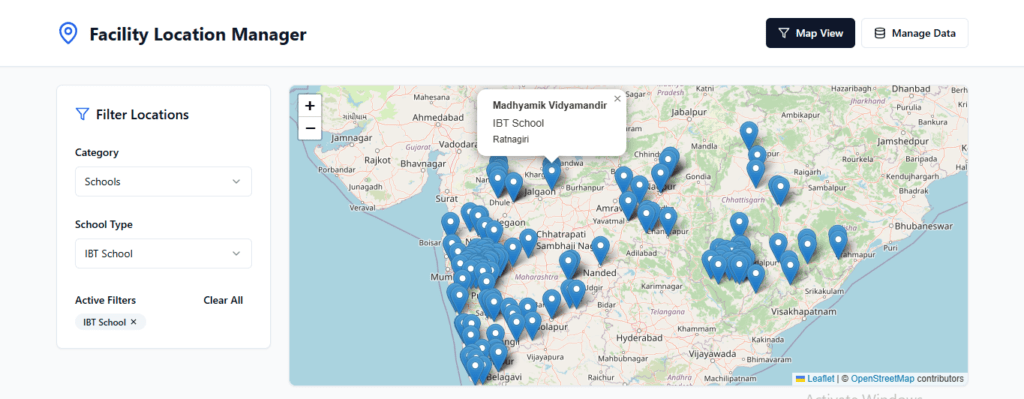
I wanted to show all these schools and technologies on a live map. So, I installed react-leaflet@4.2.1 (because latest version needs React 19, and I had React 18). Each data point was shown as a marker, and clicking it displayed details like name and address and also added a function to color-code each point based on its type, which made the map much easier to read.
June 15- June17
added a filter panel on the map so users could choose whether they wanted to see schools, technologies, or students. Clicking on a category would show a dropdown of specific types — like “Composter”, “ATL School”, or “Student”. Initially, only one or two options showed up because my dropdown logic wasn’t dynamic. I fixed that by automatically generating dropdown options based on whatever data existed in the app. This meant that if I added a new type like “EggIncubator_technology”, it would automatically show up in the filter options.
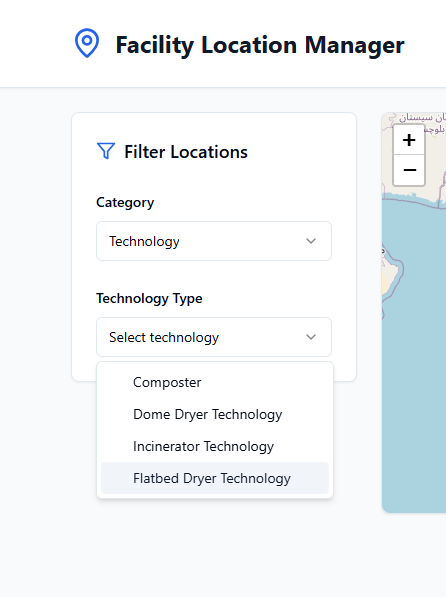
June 18- June 19
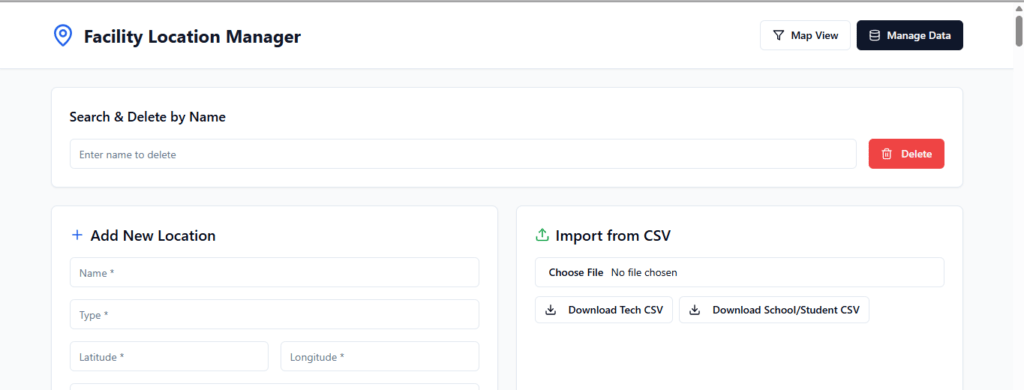
I focused on making it easier to manage data. I built a panel where I could upload CSVs, manually add new entries, or delete data by searching for a name. I also added pagination to avoid loading thousands of rows at once. For CSV uploads, I made sure that the file could contain either school data or technology data — and that it would automatically figure out where to store each row in Firebase based on the type.
June 20- June 21
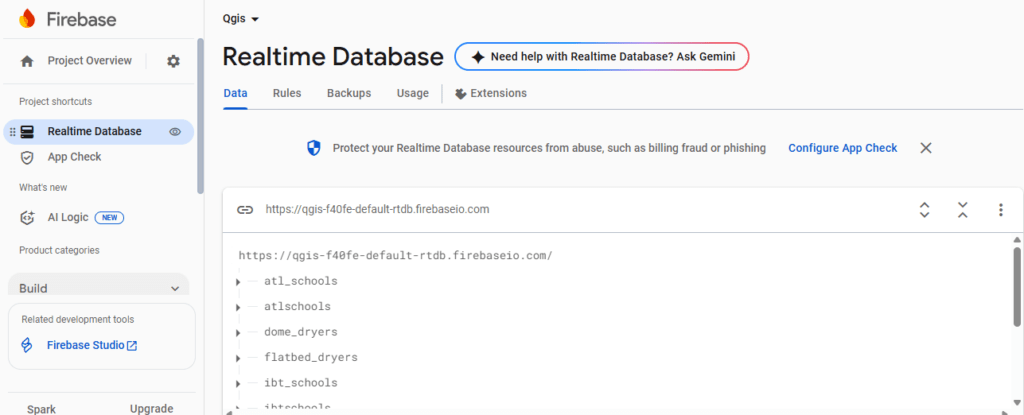
I used Firebase Realtime Database as the backend because it’s beginner-friendly and perfect for syncing data in real-time. I created a structure where each type of data (like ATL schools or technologies) would be saved under separate nodes in Firebase.
June 23
I created download buttons for sample CSVs, technology and one for schools/students, to help others upload data in the right format. I fixed a small issue where clicking on “Students” in the filter panel would open a form — I removed that so it just directly showed student markers on the map. I also tested uploading new technology types like “EggIncubator_technology”, and everything worked perfectly — the new type appeared in the dropdown, showed up on the map, and was stored correctly.
How to Upload Your Own Data to the Map
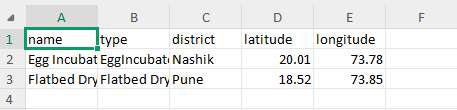
Step 1: Prepare Your CSV File
Your CSV file should contain these columns:
For technology
For Schools/Students

Step 2: Go to the “Manage Data” Tab
At the top-right of the site, switch to the “Manage Data“ tab by clicking the Manage Data button.
Step 3: Upload the CSV
- Scroll to the “Import from CSV” section.
- Click the file input and select your
.csvfile. - The app will automatically:
- Detect the
typecolumn. - Add the data to the correct section (school, student, or technology).
- Show the new points on the map (in the
Map Viewtab).
- Detect the
You can also manually add new locations and also delete a location by searching for the name in the search bar on the top.
Step 4: Verify Your Data
- Go to the Map View tab.
- Use the filter panel to select the category and type you uploaded.
- You should now see your points on the map with custom-colored markers and info popups.
Conclusion
This project began with geospatial mapping using QGIS, where CSV data of ATL, IBT, and LCM schools, various technologies, and student entries were imported and visualized as distinct layers on OpenStreetMap. QGIS helped in accurately verifying coordinates and categorizing data spatially.
Building on this foundation, a full-stack web application was developed to allow real-time interaction with the mapped data. Using React + TypeScript (frontend) and Firebase (backend), the app enables users to:
- Search and view location points on an interactive map
- Filter by type (e.g., ATL School, Composter)
- Add new data
- Upload CSV files
- Delete and manage entries dynamically
This project successfully integrates field data, geospatial analysis, and web-based visualization, making location data more accessible, manageable, and useful for decision-makers and the public.
