INTRODUCTION
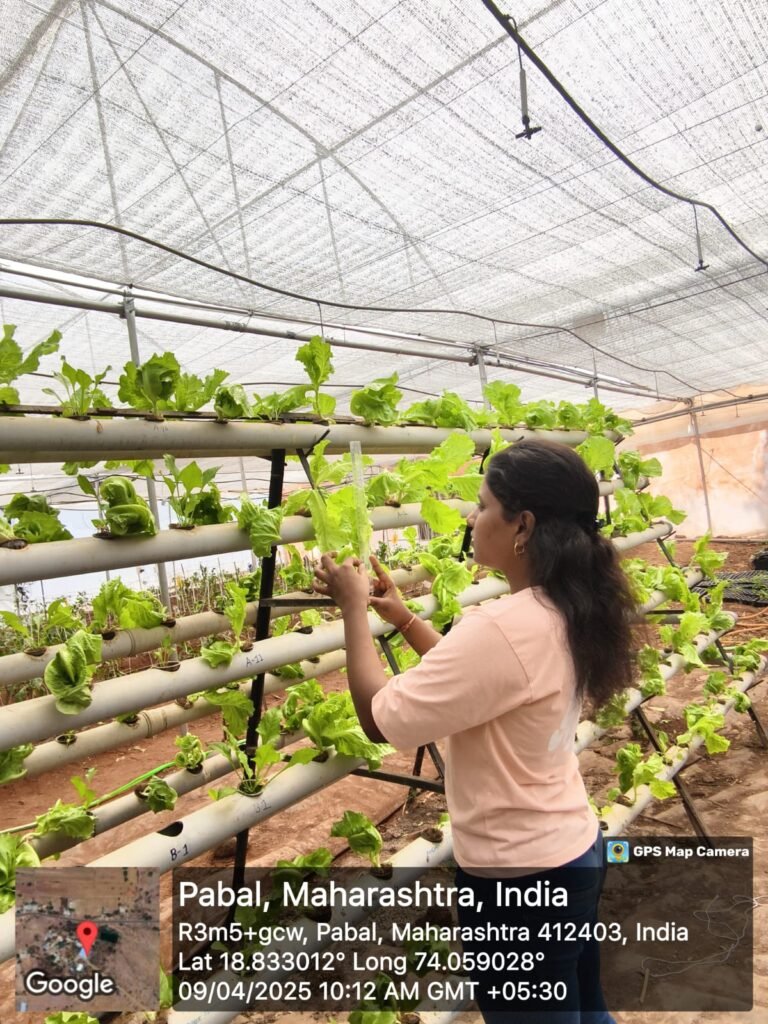
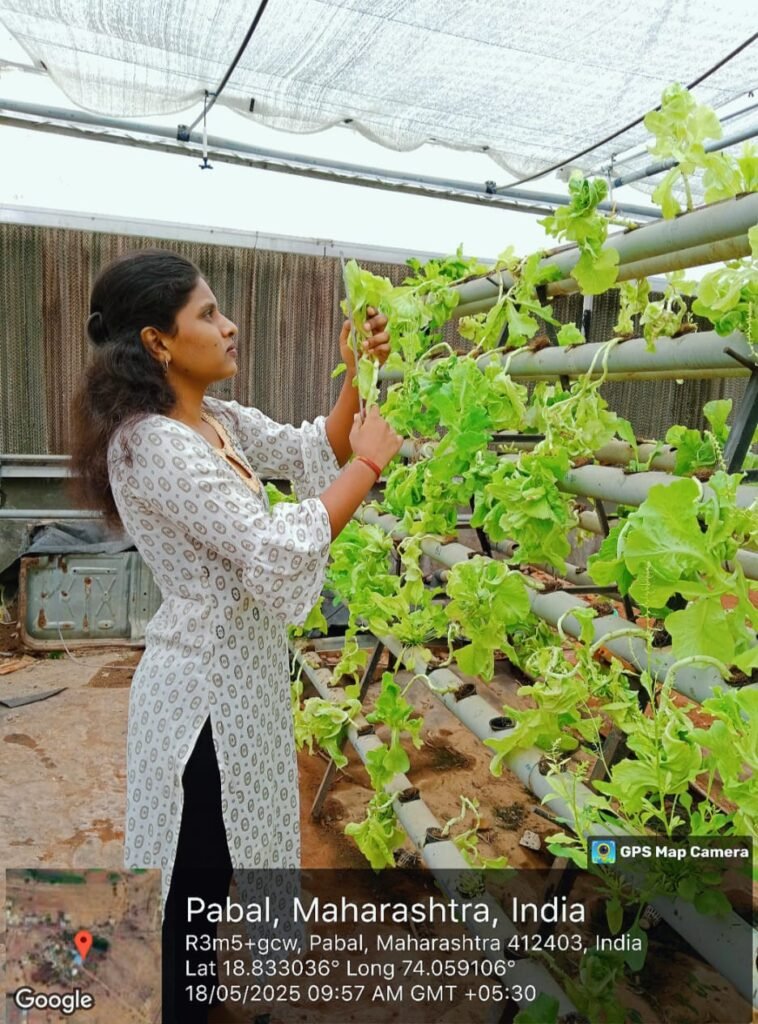
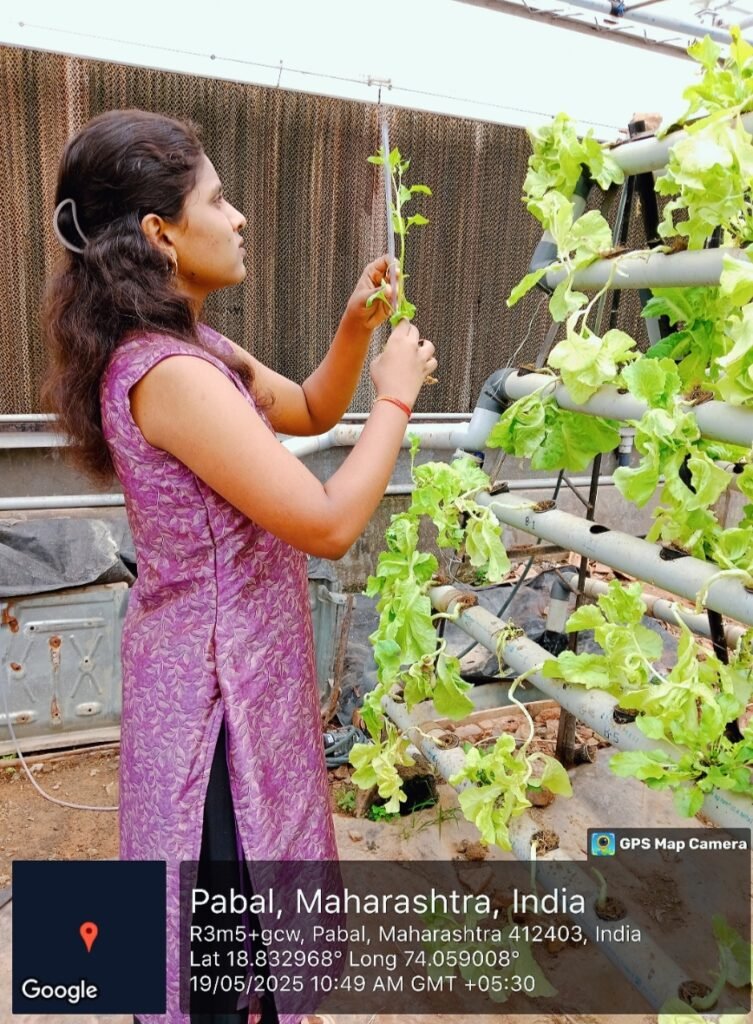
I worked with Raftech Solutions Pvt. Ltd. on a hydroponics project, where we conducted a trial of seaweed liquid on lettuce plants.
Hydroponics
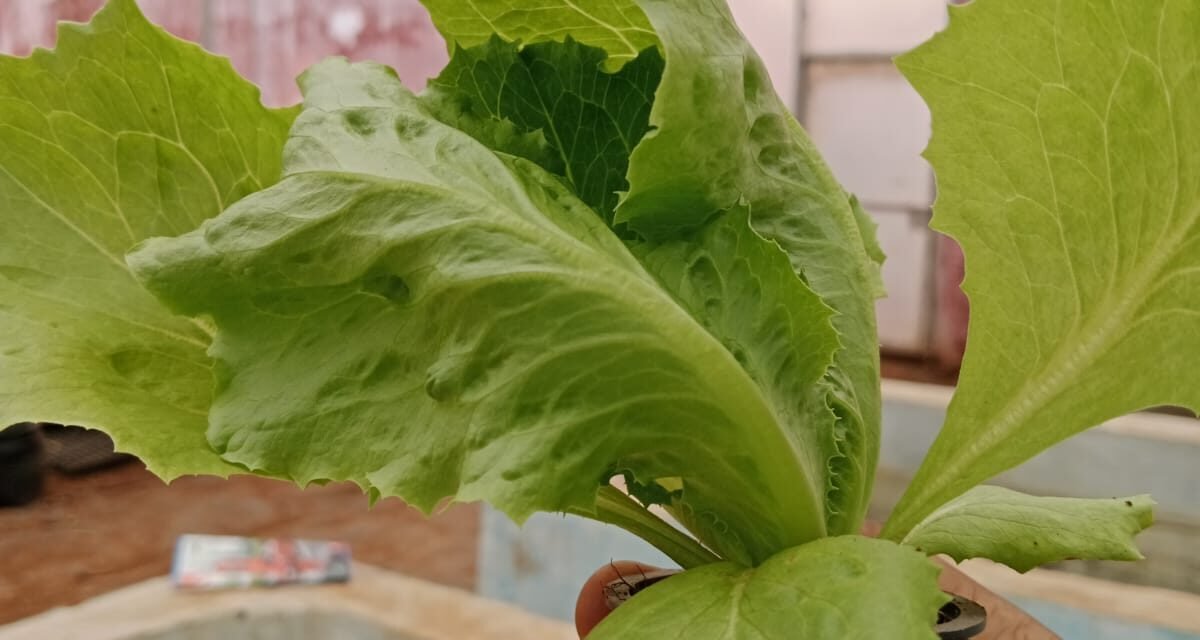
Hydroponics referred to a modern and efficient method of cultivating plants without the use of soil. Instead, plants were grown using nutrient-rich water solutions that provided all the essential minerals directly to the roots. This technique not only saved space but also used significantly less water compared to traditional farming, making it ideal for controlled environments and urban agriculture.
There were several types of hydroponic systems, each designed to optimize plant growth in different ways:
- Nutrient Film Technique (NFT)
- Deep Water Culture (DWC)
- Flood and Drain System (Ebb and Flow)
- Drip Irrigation System
- Aeroponics
- Vertical Hydroponics
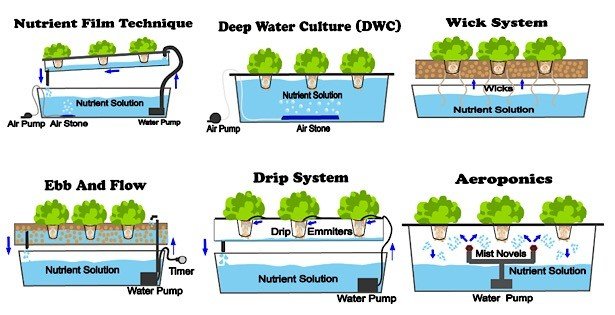
(Source : https://nosoilsolutions.com/6-different-types-hydroponic-systems/)
At Vigyan Ashram, two primary hydroponic systems had been implemented:
- Nutrient Film Technique (NFT)
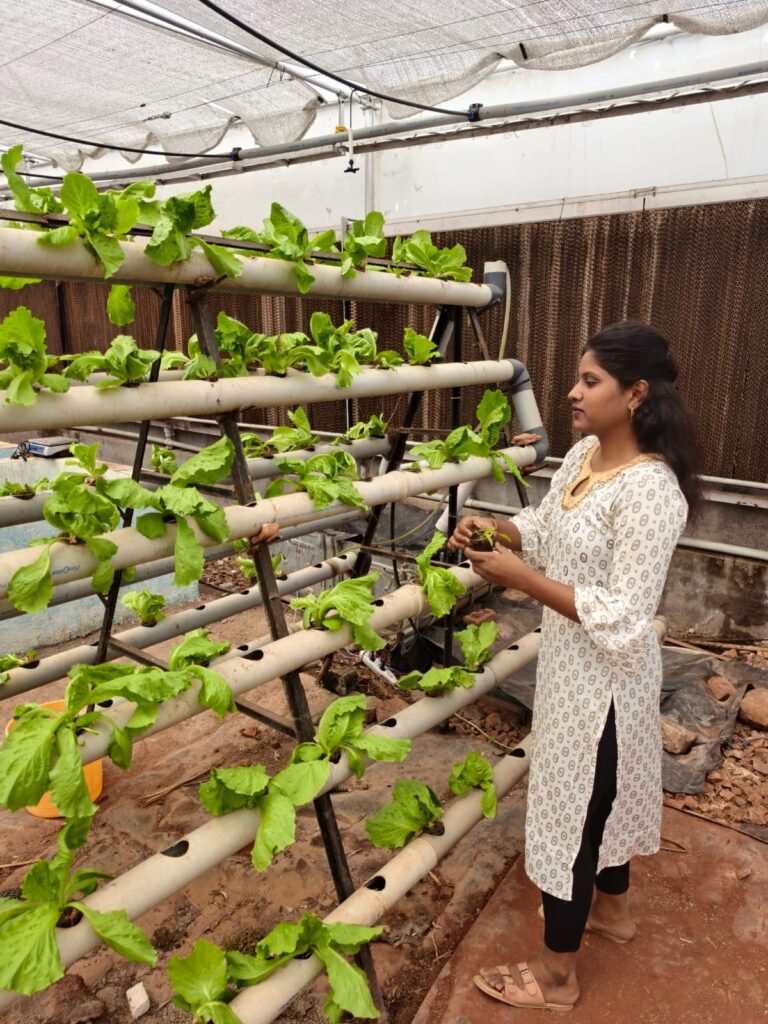
The Nutrient Film Technique involved a continuous, shallow stream of nutrient-rich water flowing through sloped channels. The bare roots of the plants were suspended within these channels, allowing them to absorb nutrients efficiently. This constant flow created a thin “film” of water that ensured the roots received both oxygen and nutrients simultaneously. The system was recirculating, making it water-efficient and ideal for leafy greens and herbs.
- Deep Water Culture (DWC)
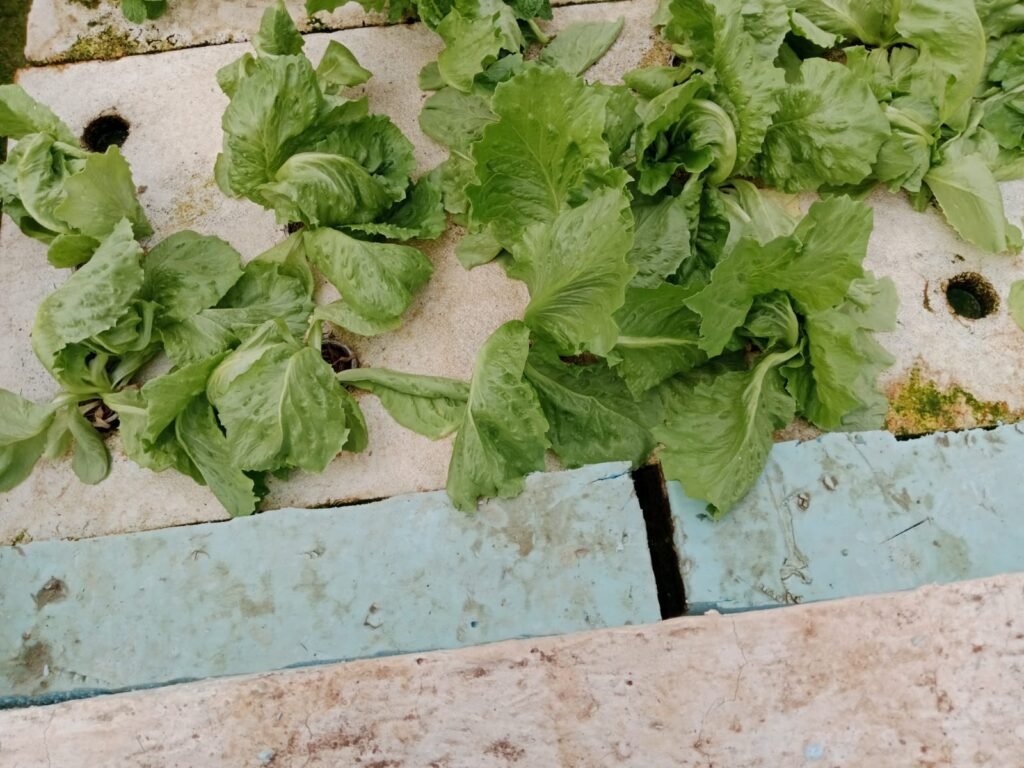
Also known as the floating raft system, the Deep Water Culture method utilized long, water-filled canals with a depth of approximately 20 cm. plants were placed in net pots fitted into holes in these rafts. The roots were submerged directly in the oxygenated nutrient solution, promoting rapid and healthy growth. This method was particularly effective for growing lettuce and other fast-growing vegetables.
Need of project:
1. Land Shortage: Urbanization is reducing available farmland. Hydroponics allows food to be grown vertically in small spaces—even indoors—making it perfect for cities.
2. Water Crisis: Traditional farming wastes a lot of water. Hydroponics uses much less by recycling nutrient-rich water, which is crucial in drought-prone or water-scarce regions.
3. Climate Challenges: Floods, droughts, and unpredictable weather are making traditional farming unreliable. Hydroponics is done in controlled environments, so it’s not affected by external climate conditions
4. Faster & Higher Yield: Hydroponic systems help plants grow faster and produce more, which is important to meet global food demand.
5. Food Security: In places with poor soil or harsh climates, hydroponics makes it possible to grow fresh vegetables and herbs locally, reducing dependency on imports.
6. Sustainable Living: With more people turning to eco-friendly lifestyles, hydroponics supports sustainable food production, especially in urban homes.
Objectives :
To evaluate the nutrient uptake capacity of lettuce plants by calculating,
- EC
- Flow of water
- Dissolved oxygen
- Synergistic effect
- Nutrient antagonism
- pH
This involves how lettuce absorbs various nutrients under controlled conditions, providing insights into optimizing growth and improving nutrient management strategies.
2. To design hydroponics with low cost effective system.
3. To understand nutrient deficiencies in hydroponics and how to identify and correct them.
METHODOLODY
1. To evaluate the impact of various fertilizers on the plant growth, an experiment can be designed where different fertilizers are applied in separately. This approach allows for the assessment of how each fertilizer influences plant development under controlled conditions.
2. By tracking parameters such as plant height, root height by using scale and weight by using digital weighing balance, it becomes possible to evaluate the effectiveness of each fertilizer and determine which one promotes better growth for each type of plant.
26/03/2025
We explored hydroponics and its various techniques. We then calculated the dimensions of the fertilizer tank required to determine its capacity and the quantity of water it would hold.
Total tank capacity=500 lit
Tank Available Water= 142.31 lit
We required 200 lit of water so added the 57.61 lit of water in tank A
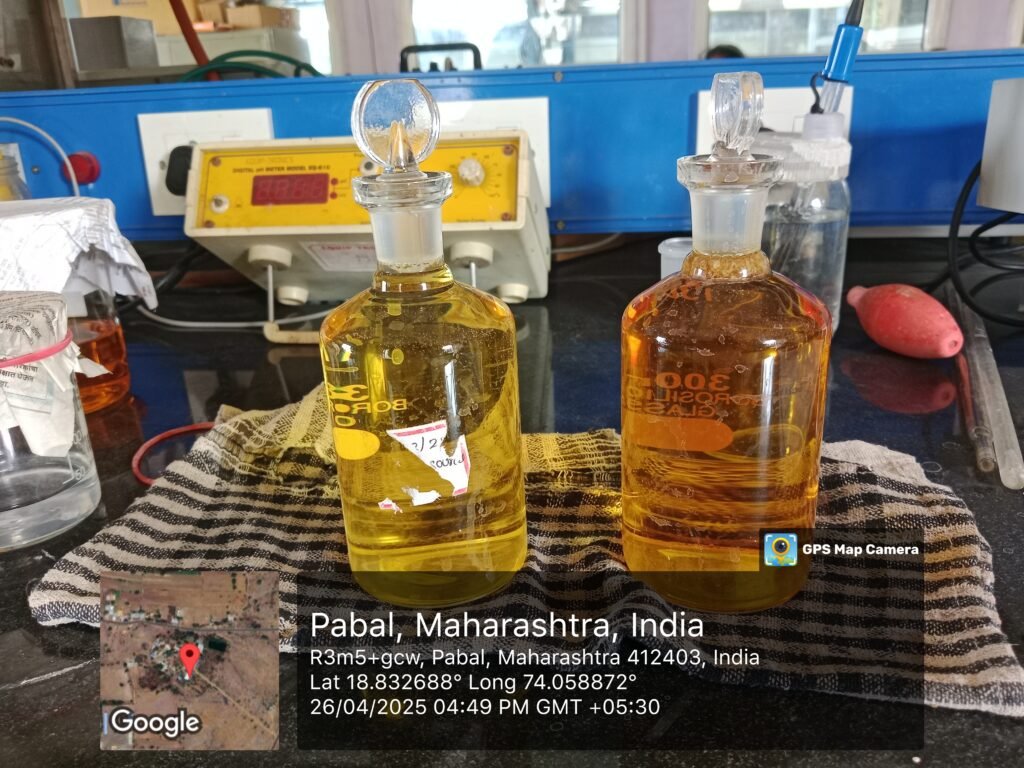
One tank served as the control (tank A), where only chemical fertilizer was applied. The other tank was used for the trial (tank B), in which both chemical fertilizer and seaweed liquid were applied. This setup allowed for a comparison of the effects of the seaweed liquid in addition to the chemical fertilizer.


We required to added 65.9 lit of water in tank B.
28/03/2025
We examined the difference between Deep Water Culture (DWC) and Nutrient Film Technique (NFT), in hydroponic systems.
Deep Water Culture (DWC):
DWC is a hydroponic method where plant roots are fully submerged in a nutrient-rich solution. Key characteristics include:
- Root Submersion: Plant roots are entirely immersed in the nutrient solution, ensuring continuous access to water and nutrients.
- Oxygenation: To prevent root suffocation, the solution is aerated using air pumps or diffusers, delivering oxygen directly to the roots.
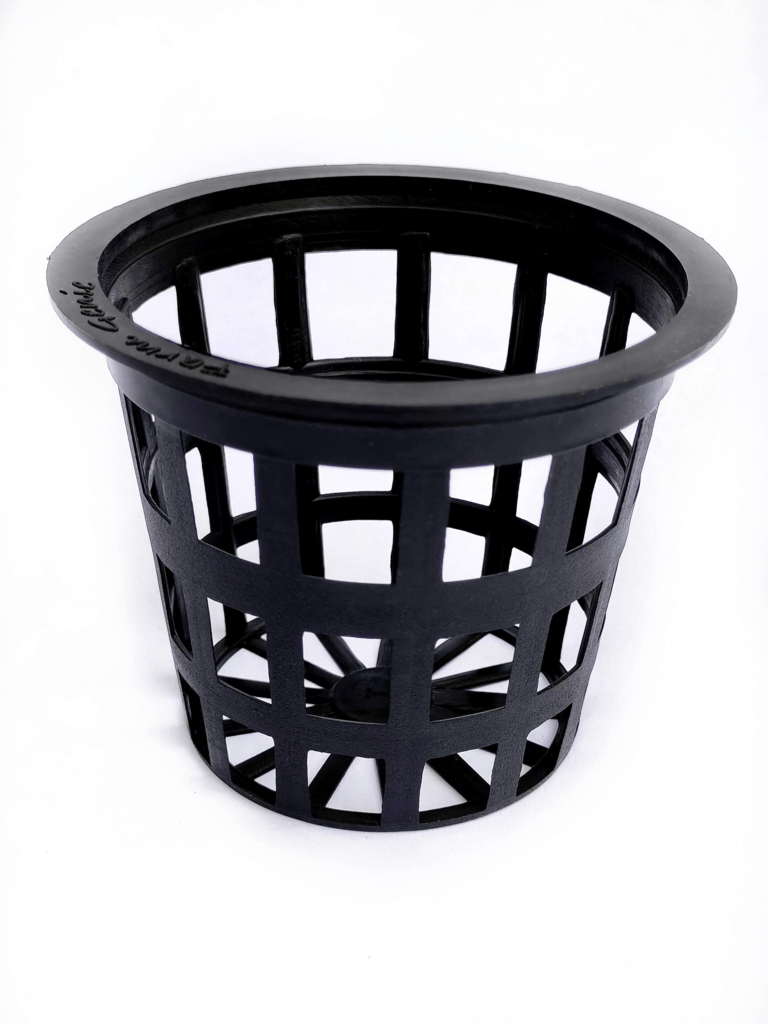
- System Simplicity: DWC is straightforward to set up and maintain, requiring a reservoir, air pump, and net pots to support the plants.
- Plant Suitability: Ideal for various plants, including leafy greens and larger fruiting plants, due to the constant availability of nutrients and oxygen.
Nutrient Film Technique (NFT):
NFT involves a thin, continuous flow of nutrient solution over plant roots, providing nutrients and oxygen. Key features include:
- Nutrient Flow: A shallow stream of nutrient solution circulates over the roots, ensuring they receive necessary nutrients while being partially exposed to air.
- System Components: Typically consists of sloped channels, a reservoir, and a pump to circulate the nutrient solution.
- Water and Nutrient Efficiency: The continuous flow minimizes water and nutrient wastage, promoting efficiency.
- Plant Suitability: Best suited for small plants with shallow root systems, such as lettuce and herbs.
Key Differences:
- Root Environment: DWC provides a fully submerged root system, while NFT offers a shallow nutrient film with partial root exposure to air.
- System Dependency: DWC relies on aeration for oxygen delivery, whereas NFT depends on continuous pump operation to circulate the nutrient solution.
- Plant Compatibility: DWC supports a broader range of plants, including larger species, due to its stable nutrient and oxygen supply.
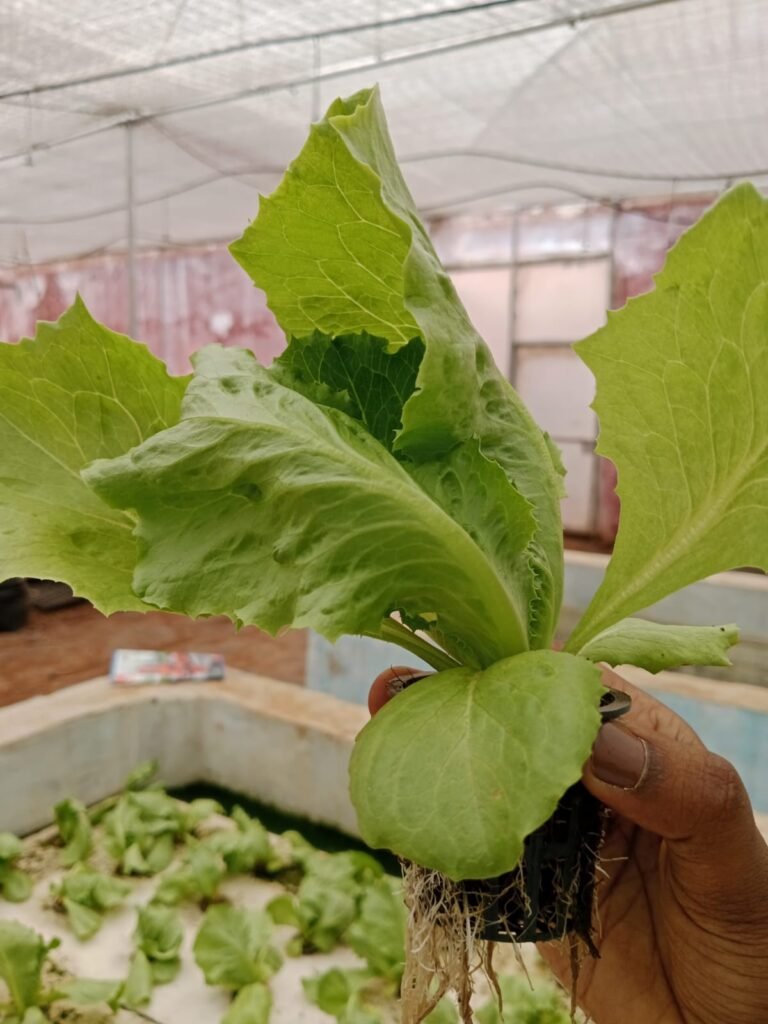
We also planted spinach in both Tank A and Tank B. In each tank, we planted 30 spinach plants, making a total of 60 plants. The planting was done carefully. The net cup and coco coir was used for plantation of spinach.

29/03/2025
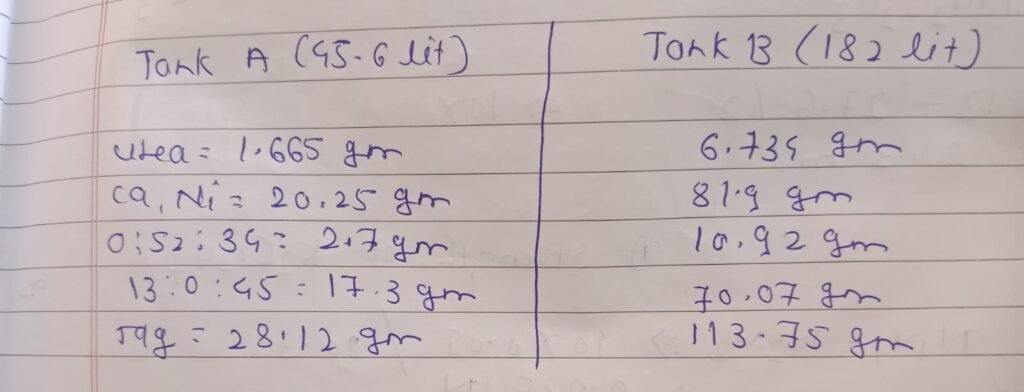
We added an equal amount of fertilizer to both tanks to ensure uniform nutrient availability for the plants. The fertilizer was measured carefully using a digital scale to maintain consistency in concentration. After mixing, the solutions in both tanks were thoroughly stirred to ensure even distribution of nutrients before being supplied to the plants.
Chemical fertilizer dosing
- Urea = 7.400 gm
- Calcium Nitrate =90 gm
- 13:00:45 = 77 gm
- EDTA Magnesium = 125 gm
- 00:52:34 = 12 gm
- Micronutrient =133 gm
30/03/2025
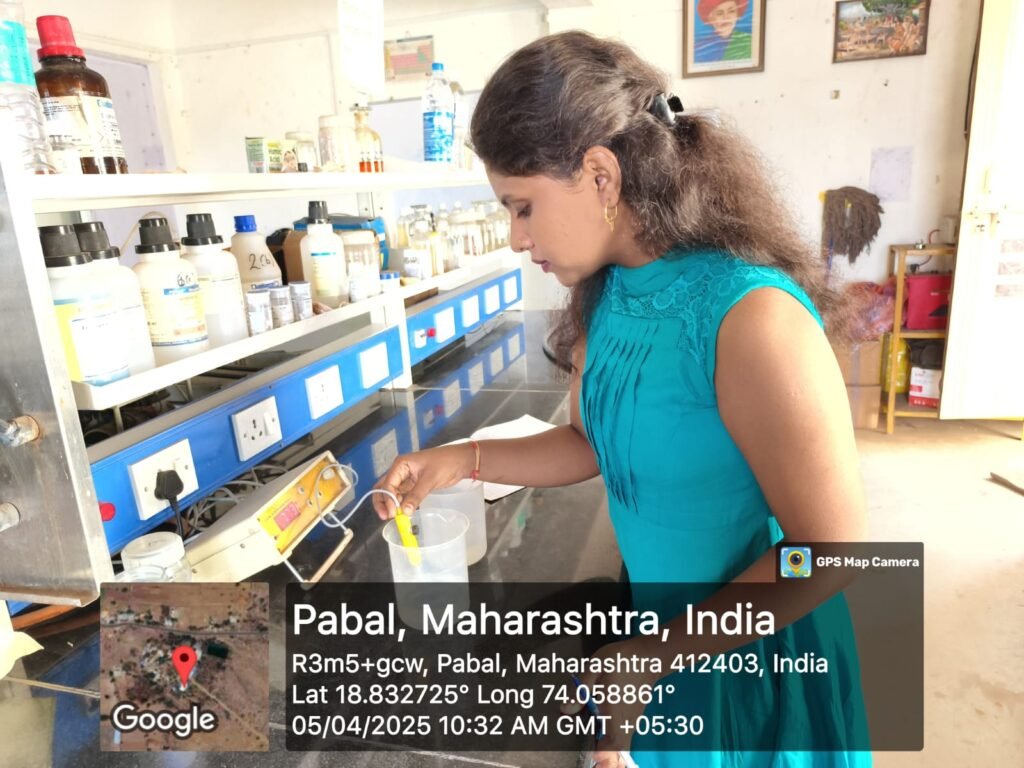
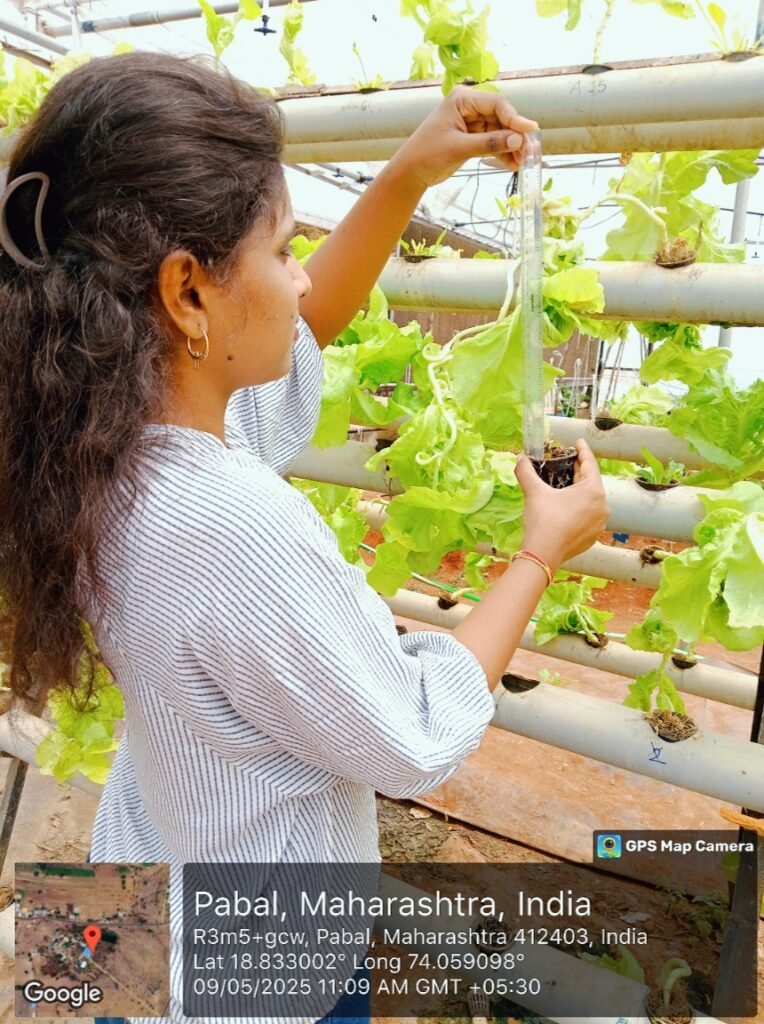
We measured the electrical conductivity (EC) and pH of the nutrient solution used for the plants. After recording these values, we proceeded to assess various growth parameters of the plants, including root length, height, and weight . The weight of the plants was determined by carefully uprooting them, removing excess moisture, and using a digital balance to obtain accurate measurements. These observations helped us evaluate the influence of nutrient conditions on plant development.

pH of tank A= 7.75 (lack of iron ,mg, boron) (use phosphoric acid or nitric acid to maintain pH)
(ideal pH range 5.5-6.5)
pH of tank B = 7.81
EC of tank A =1857
EC of tank B = 1857
https://docs.google.com/spreadsheets/d/1vdhNR58SrOovoDO2pfUE9YoDR1ut5Q3aW6iwfZ2cgqs/edit?usp=sharing
02/03/2025
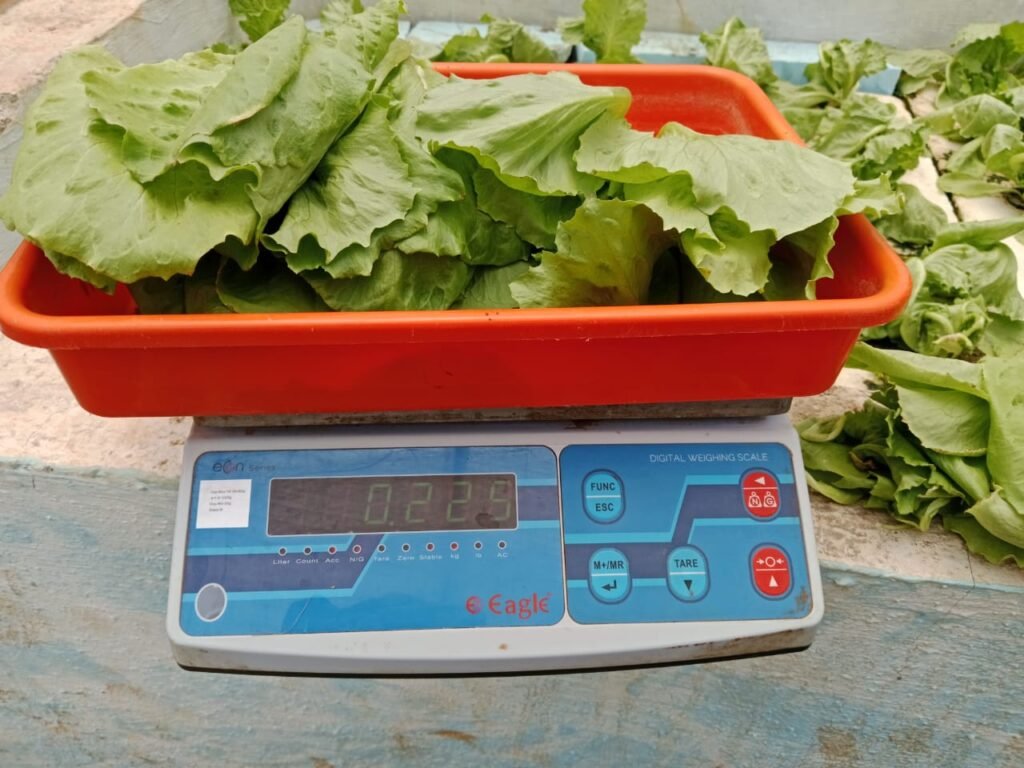
We recorded the growth data of the lettuce plants. We measured the height of each plant using a scale from the base to the topmost leaf to ensure accuracy. Additionally, we assessed the fresh weight of the plants by carefully uprooting them, gently removing excess soil and moisture, and weighing them using a digital balance. These measurements were documented to monitor the overall growth .


TANK A
EC = 1965
pH = 8.16
TANK B
EC = 1965
pH = 8.02
03/04/2025
We filled the gaps in the deep water culture system because the presence of those gaps had led to increased algae growth. The uncovered sections of the water surface allowed light to penetrate, which promoted the algae. By sealing the gaps, we aimed to limit light exposure and suppress further algal development.


04/04/2025

We recorded the growth data of the lettuce plants. We measured the height of each plant using a scale from the base to the topmost leaf to ensure accuracy. Additionally, we assessed the fresh weight of the plants by carefully uprooting them, gently removing excess soil and moisture, and weighing them using a digital balance. These measurements were documented to monitor the overall growth .
We also record the data of spinach plant its weight by using weighing balance , root height and vegetation growth using scale .
TANK A
EC = 1997
pH = 7.74
TANK B
EC = 1997
pH = 7.41
05/04/2025
We recorded the growth data of the lettuce plants. We measured the height of each plant using a scale from the base to the topmost leaf to ensure accuracy. Additionally, we assessed the fresh weight of the plants by carefully uprooting them, gently removing excess soil and moisture, and weighing them using a digital balance. These measurements were documented to monitor the overall growth .

07/04/2025
We recorded the growth data of the lettuce plants. We measured the height of each plant using a scale from the base to the topmost leaf to ensure accuracy. Additionally, we assessed the fresh weight of the plants by carefully uprooting them, gently removing excess soil and moisture, and weighing them using a digital balance. These measurements were documented to monitor the overall growth .

we also calculated the height of spinach plant , weight of spinach plant and root height of spinach plant .
After that we proceeded to fill the fertilizer tank with 200 liters of clean water. Before adding the water, we measured and recorded the electrical conductivity (EC) and pH values in both the fertilizer tank. Once the water was added, we rechecked the EC and pH to monitor any changes and ensure the nutrient balance remained within the optimal range for plant growth.
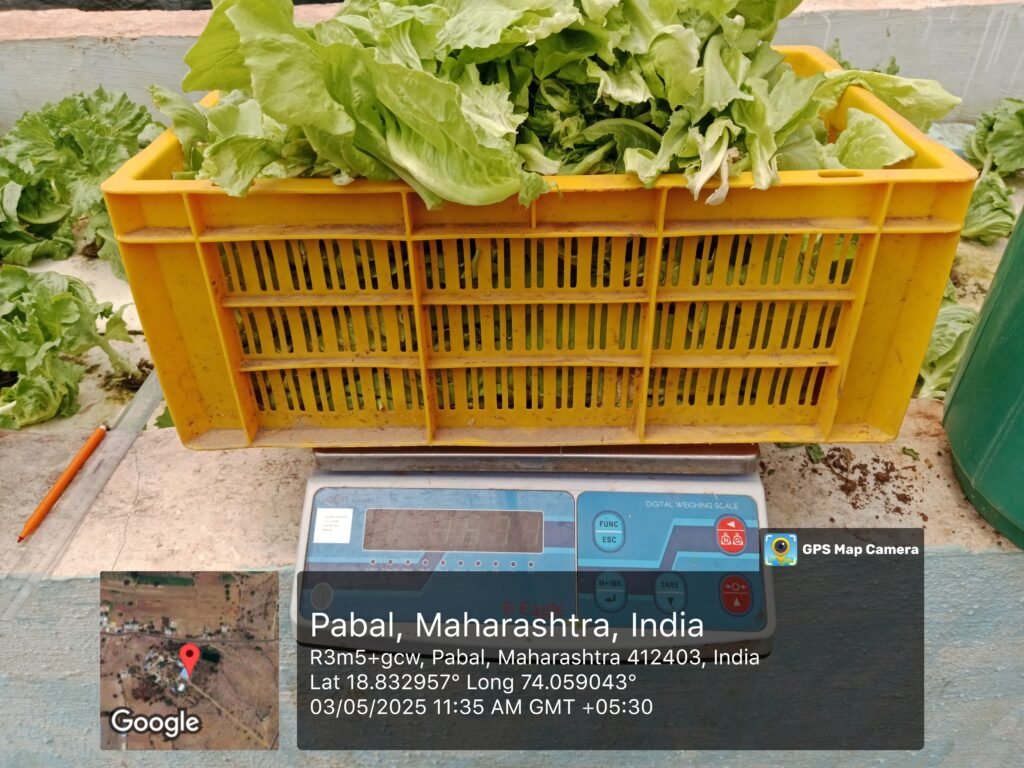
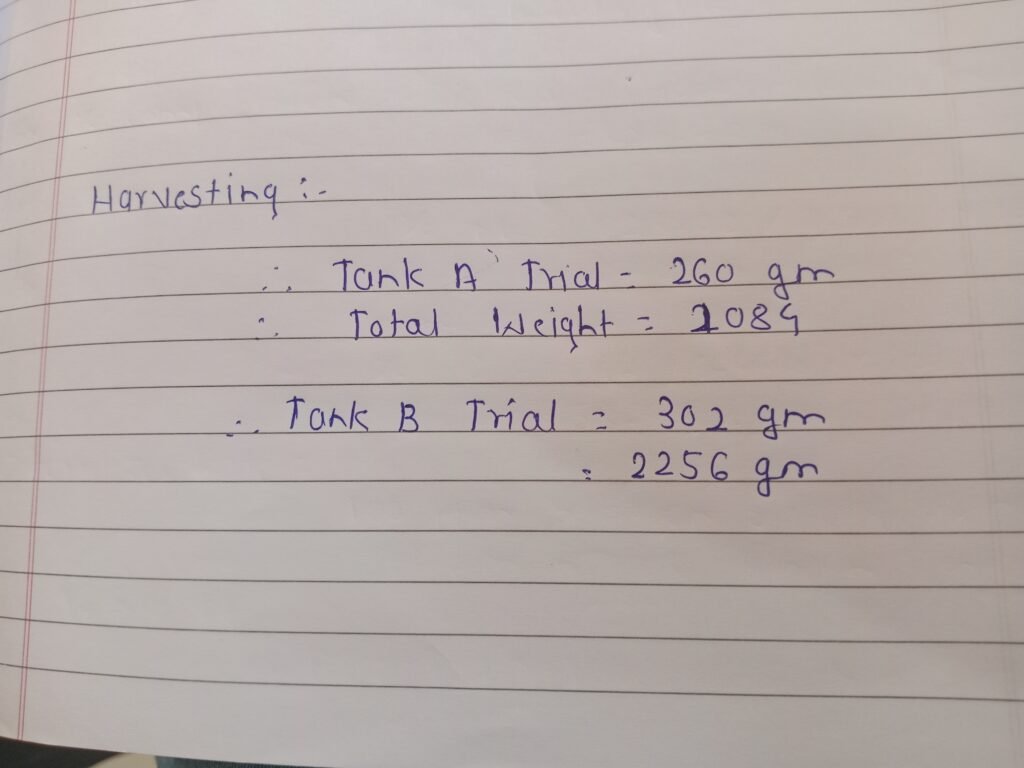
After that we carried out the harvesting of lettuce from Tank A. Each head of lettuce was weighed carefully to determine the fresh yield. We compared the measured weight with the expected yield to the losses.
EC and pH of water before added the water
TANK A
EC = 2325 pH= 7.85
TANK B
EC = 2325 pH= 7.50
EC and pH of water after added the water
TANK A
EC = 1462 pH = 8.04
TANK B
EC = 1620 pH = 7.94
08/04/2025
we carried out the harvesting of lettuce from Tank B. Each head of lettuce was weighed carefully to determine the fresh yield. We compared the measured weight with the expected yield to the losses.

The differences in the weights of the plants grown in Tank A and Tank B were calculated.

09/04/2025
we recorded the growth data of the lettuce plants. We measured the height of each plant using a scale from the base to the topmost leaf to ensure accuracy. Additionally, we assessed the fresh weight of the plants by carefully uprooting them, gently removing excess soil and moisture, and weighing them using a digital balance. These measurements were documented to monitor the overall growth.
we also calculated the height of spinach plant , weight of spinach plant and root height of spinach plant .
I also made the graph of recorded data of the lettuce plant.
1. Weight of plants grown in A tank vs Weight of plants grown in B tank.

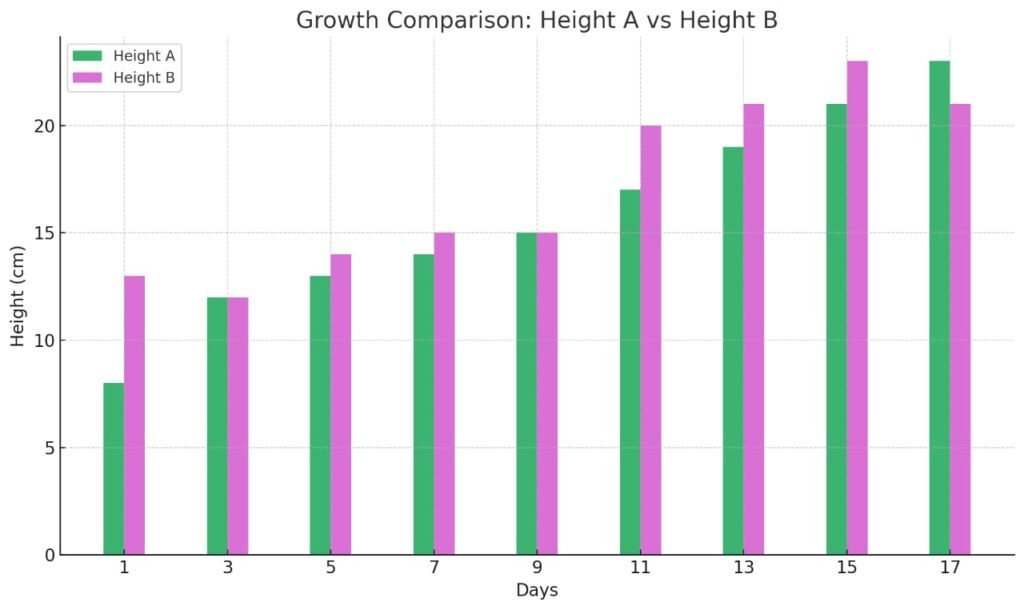
2. Height of plants grown in the A tank vs Height of plant grown in the B tank.
3. Roots of plants grown in the tank A vs Root of plants grown in tank B.

11/04/2025
On that day, I calculated the t-test to determine the difference in plant growth between Tank A and Tank B. I used the recorded data to compare their average weights and analyzed whether the difference was statistically not significant.

Conclusion
We conducted a t-test to determine whether there was a significant difference in the growth of plants between Tank A and Tank B. After performing the statistical analysis, we found that the difference in plant growth between the two tanks was not statistically significant. This meant that there was no statistically significant difference in the growth of plants between tank A and tank B.
12/04/2025
We recorded the growth data of the lettuce plants. We measured the height of each plant using a scale from the base to the topmost leaf to ensure accuracy. Additionally, we assessed the fresh weight of the plants by carefully uprooting them, gently removing excess soil and moisture, and weighing them using a digital balance. These measurements were documented to monitor the overall growth.
A Google Meet call was conducted by Akshay Jadhav Sir and Ranjeet Sir, during which they discussed the schedule and composition for the next dose of fertilizer.

We also calculated the height of spinach plant , weight of spinach plant and root height of spinach plant .
TANK A
EC =1388
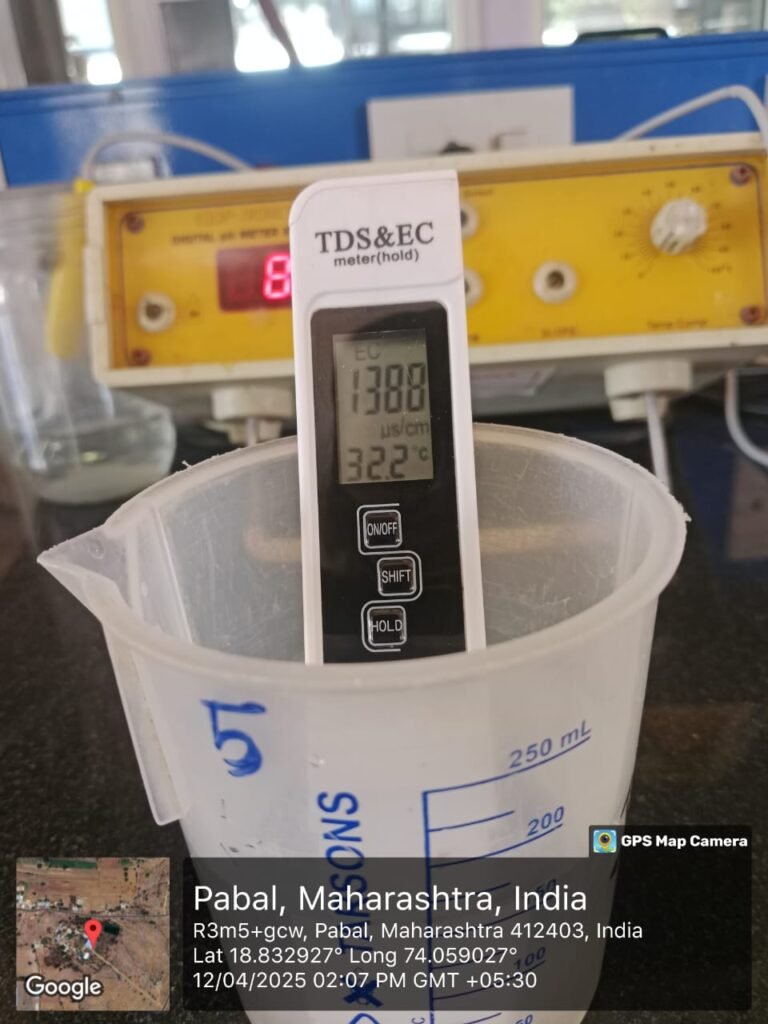
pH =8.38

TANK B
EC =1153
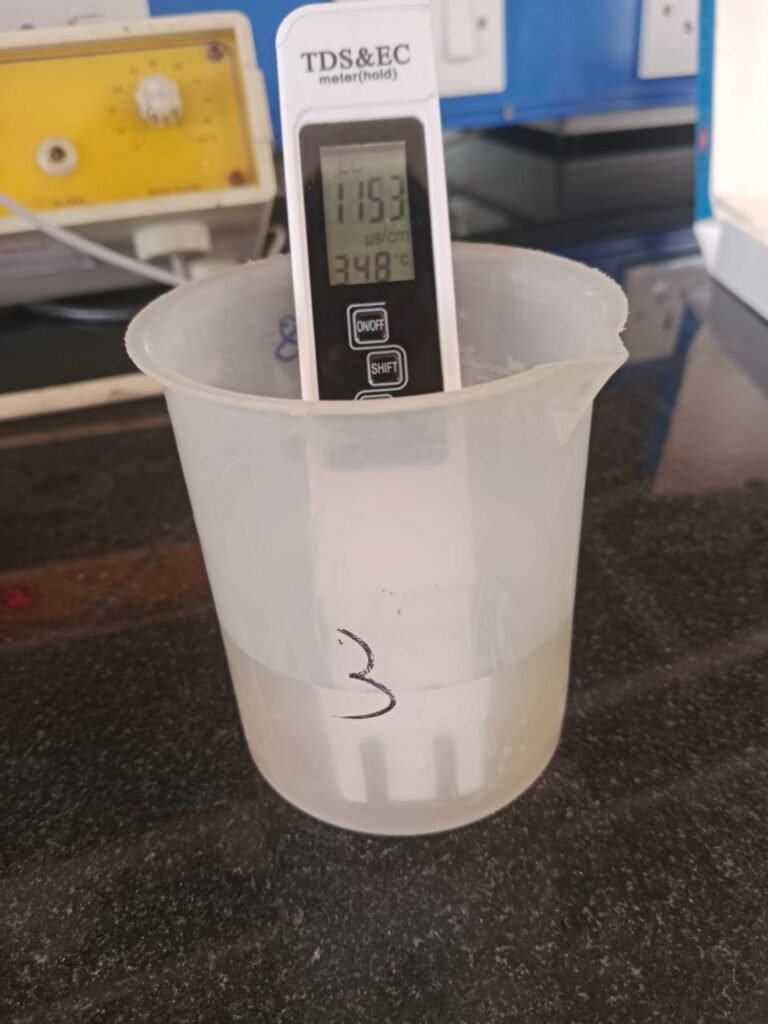
pH =8.45

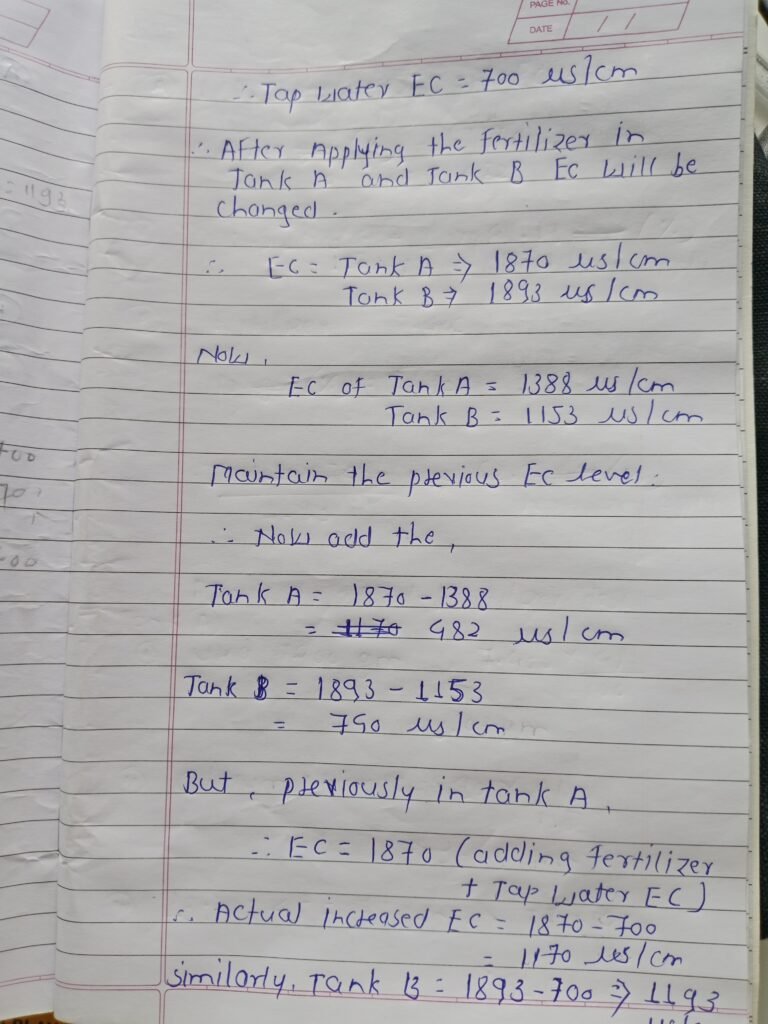
13/04/2025
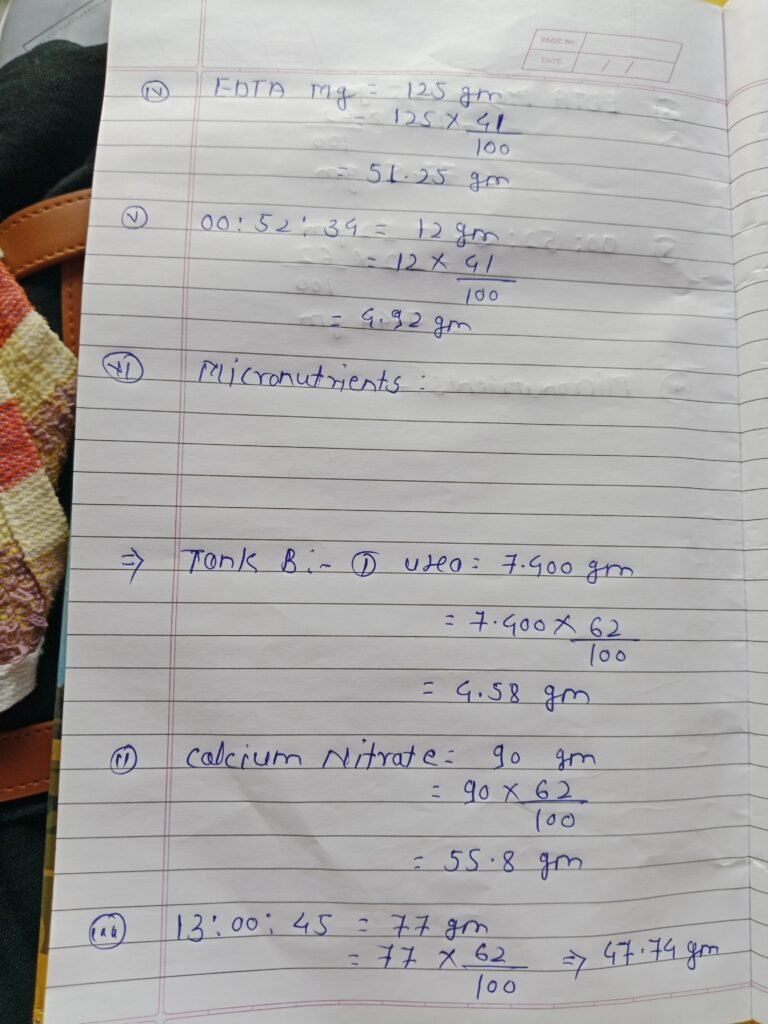
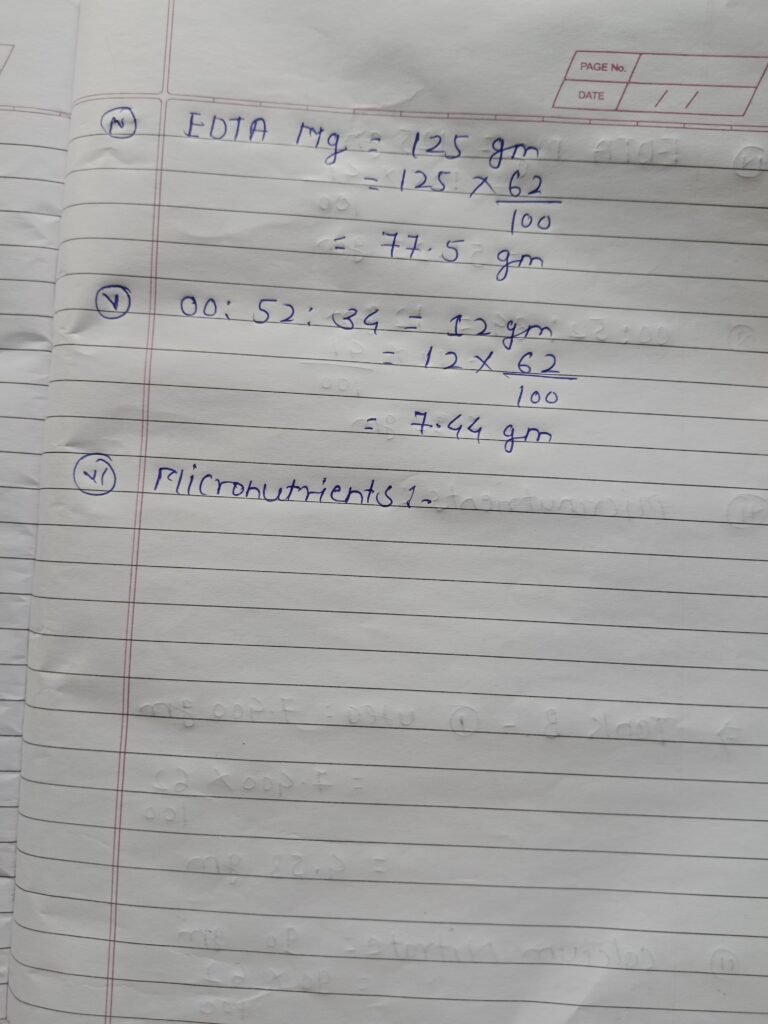
The fertilizer was added to 100 liters of water, ensuring it was thoroughly mixed to achieve an even distribution. We added an equal amount of fertilizer to both tanks to ensure uniform nutrient availability for the plants. The fertilizer was measured carefully using a digital scale to maintain consistency in concentration. After mixing, the solutions in both tanks were thoroughly stirred to ensure even distribution of nutrients before being supplied to the plants.
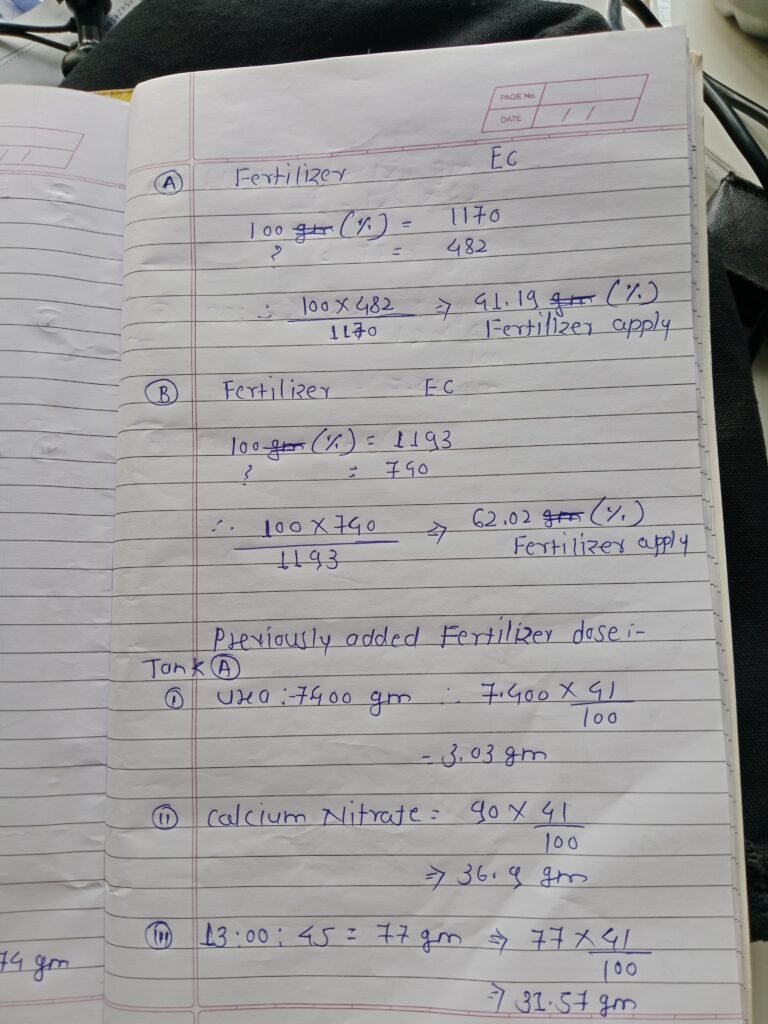
Urea = 3700 gm
Calcium Nitrate =45 gm
13:00:45 = 38.5 gm
EDTA Magnesium = 62.5 gm
00:52:34 = 6 gm
Micronutrient = 100gm
We had our weekly review meeting with Abhijeet Sir, during which we discussed the progress of ongoing tasks, addressed any challenges faced by us.
https://docs.google.com/spreadsheets/d/1vdhNR58SrOovoDO2pfUE9YoDR1ut5Q3aW6iwfZ2cgqs/edit?usp=sharing
14/04/2025
We recorded the growth data of the lettuce plants. We measured the height of each plant using a scale from the base to the topmost leaf to ensure accuracy. Additionally, we assessed the fresh weight of the plants by carefully uprooting them, gently removing excess soil and moisture, and weighing them using a digital balance. These measurements were documented to monitor the overall growth.
15/04/2025
We conducted a series of measurements to evaluate the growth characteristics of spinach plants. Initially, we recorded key growth parameters of the spinach plants, including the total plant weight, plant height, root length. The weights were measured using a digital weighing balance to ensure accuracy.
We measured the electrical conductivity (EC) and pH of both tanks before the addition of fertilizer. After adding the respective fertilizers to each tank, we remeasured the EC and pH levels to observe any changes. The differences in EC and pH values before and after fertilization were then calculated to determine the impact of the added nutrients on the solution’s composition.
TANK A
EC = 1494 pH = 8.14
TANK B
EC = 1434 pH = 7.98
16/04/2025
We recorded the growth data of the lettuce plants. We measured the height of each plant using a scale from the base to the topmost leaf to ensure accuracy. Additionally, we assessed the fresh weight of the plants by carefully uprooting them, gently removing excess soil and moisture, and weighing them using a digital balance. These measurements were documented to monitor the overall growth.

17/04/2025
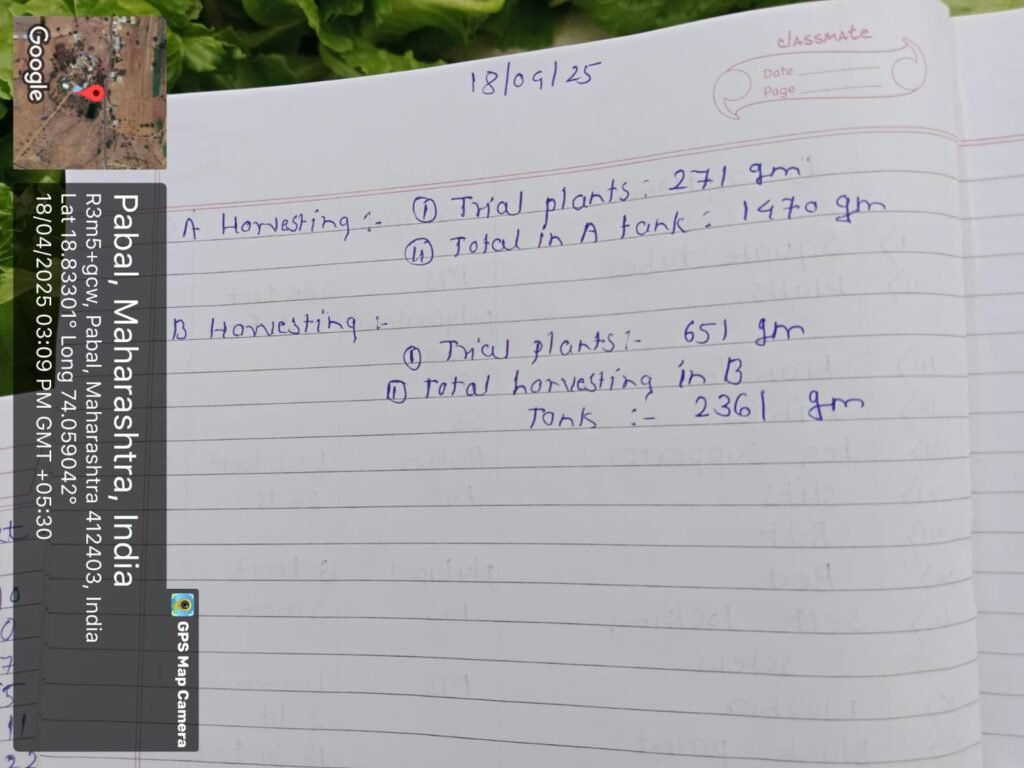
we carried out the harvesting of lettuce from Tank A. Each head of lettuce was weighed carefully to determine the fresh yield. We compared the measured weight with the expected yield to the losses.
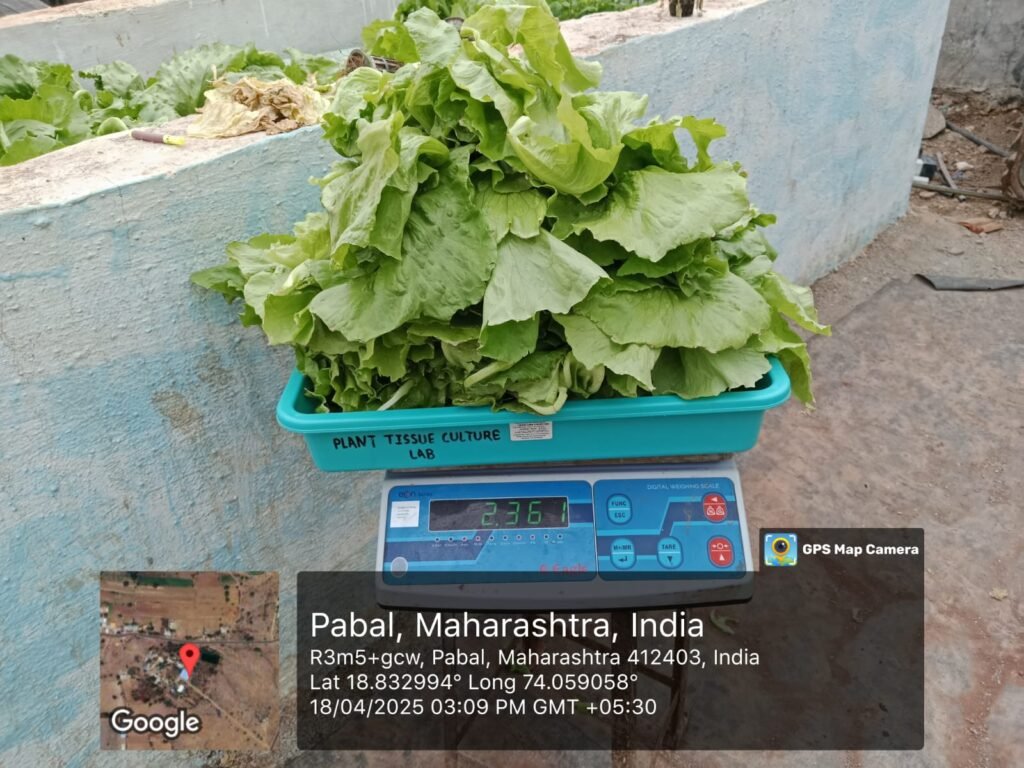
18/04/2025
we carried out the harvesting of lettuce from Tank B. Each head of lettuce was weighed carefully to determine the fresh yield. We compared the measured weight with the expected yield to the losses.

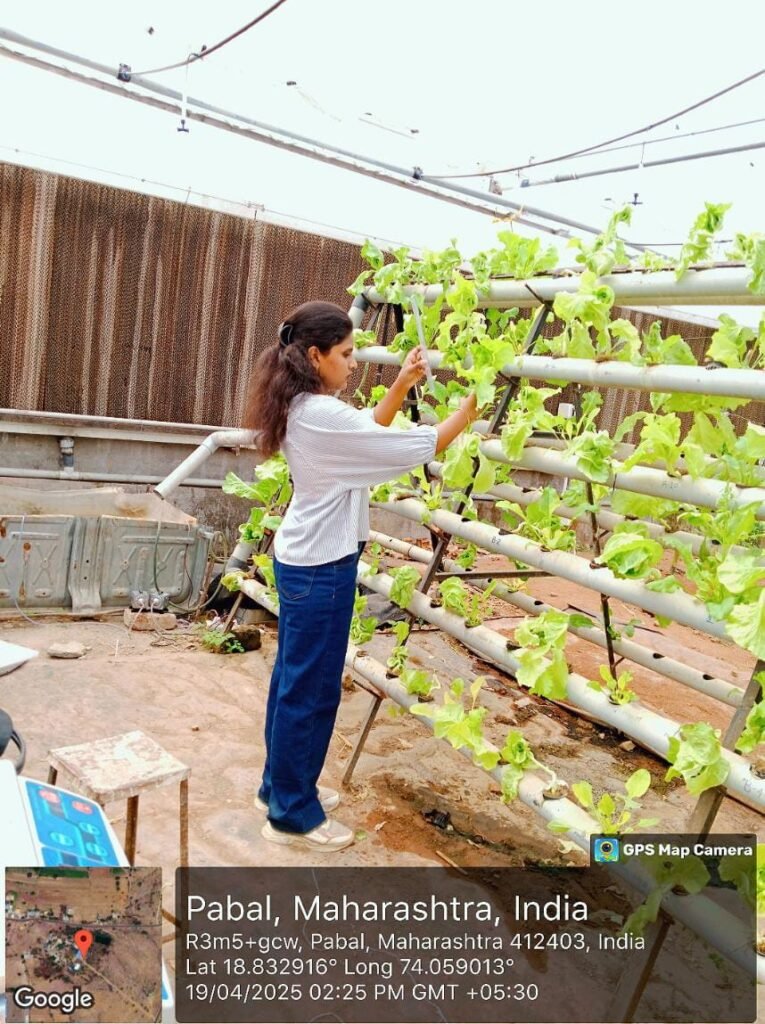
19/04/2025
We recorded the growth data of the lettuce plants. We measured the height of each plant using a scale from the base to the topmost leaf to ensure accuracy. Additionally, we assessed the fresh weight of the plants by carefully uprooting them, gently removing excess soil and moisture, and weighing them using a digital balance. These measurements were documented to monitor the overall growth.
https://docs.google.com/spreadsheets/d/1vdhNR58SrOovoDO2pfUE9YoDR1ut5Q3aW6iwfZ2cgqs/edit?usp=sharing
20/04/2025
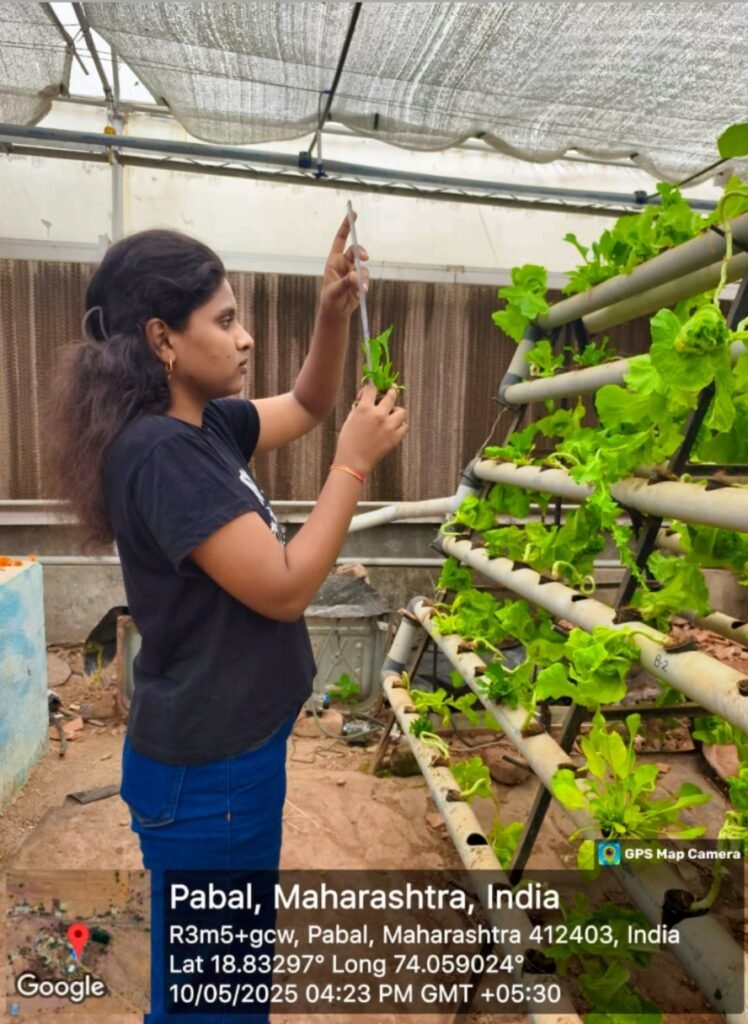
We recorded the growth data of the spinach plants. We measured the height of each plant using a scale from the base to the topmost leaf to ensure accuracy. Additionally, we assessed the fresh weight of the plants by carefully uprooting them, gently removing excess soil and moisture, and weighing them using a digital balance. These measurements were documented to monitor the overall growth.
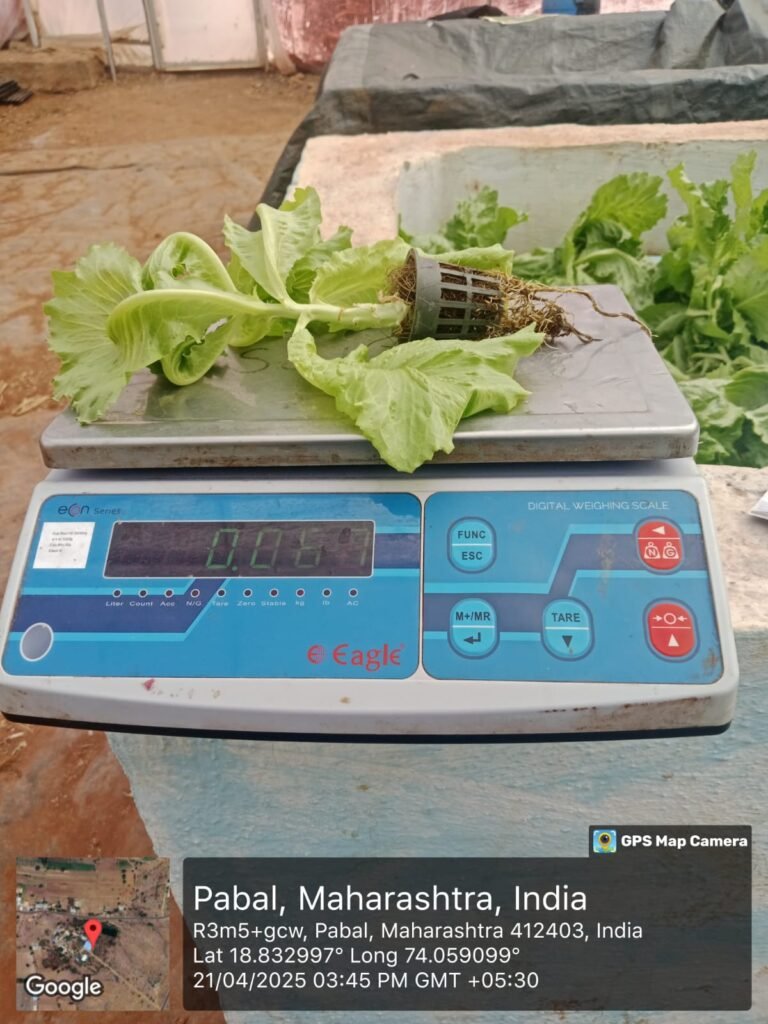
21/04/2025
We recorded the growth data of the lettuce plants. We measured the height of each plant using a scale from the base to the topmost leaf to ensure accuracy. Additionally, we assessed the fresh weight of the plants by carefully uprooting them, gently removing excess soil and moisture, and weighing them using a digital balance. These measurements were documented to monitor the overall growth.
Water was added to both tanks until the water level in each tank reached 200 liters.
Added water : TANK A = 3 cm
TANK B = 5 cm
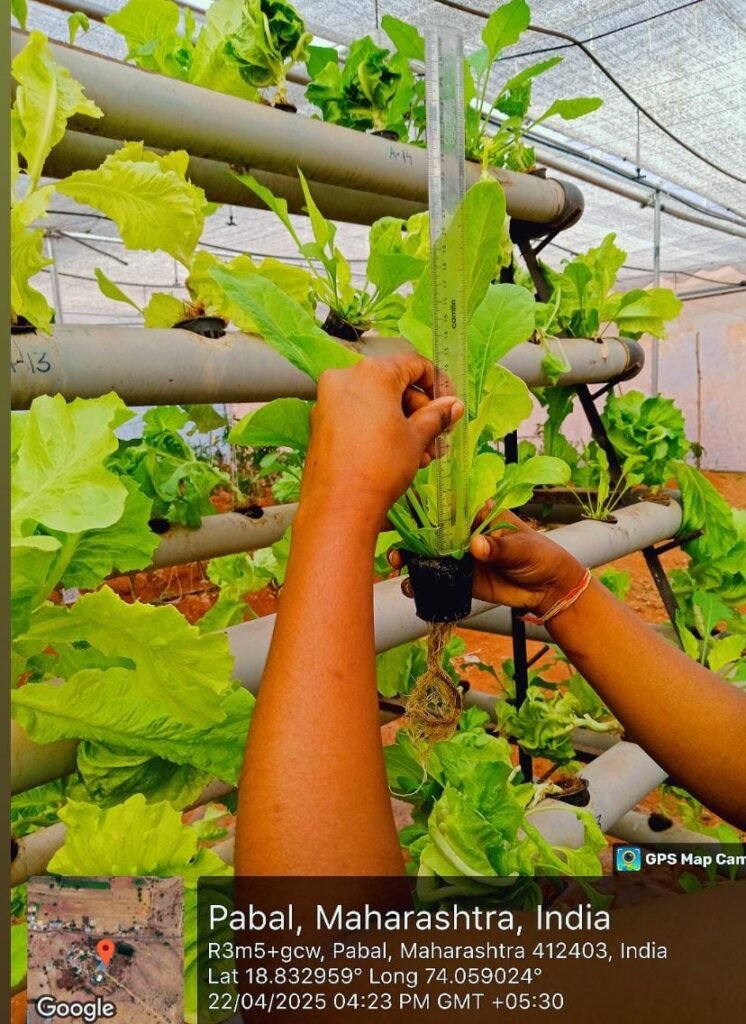
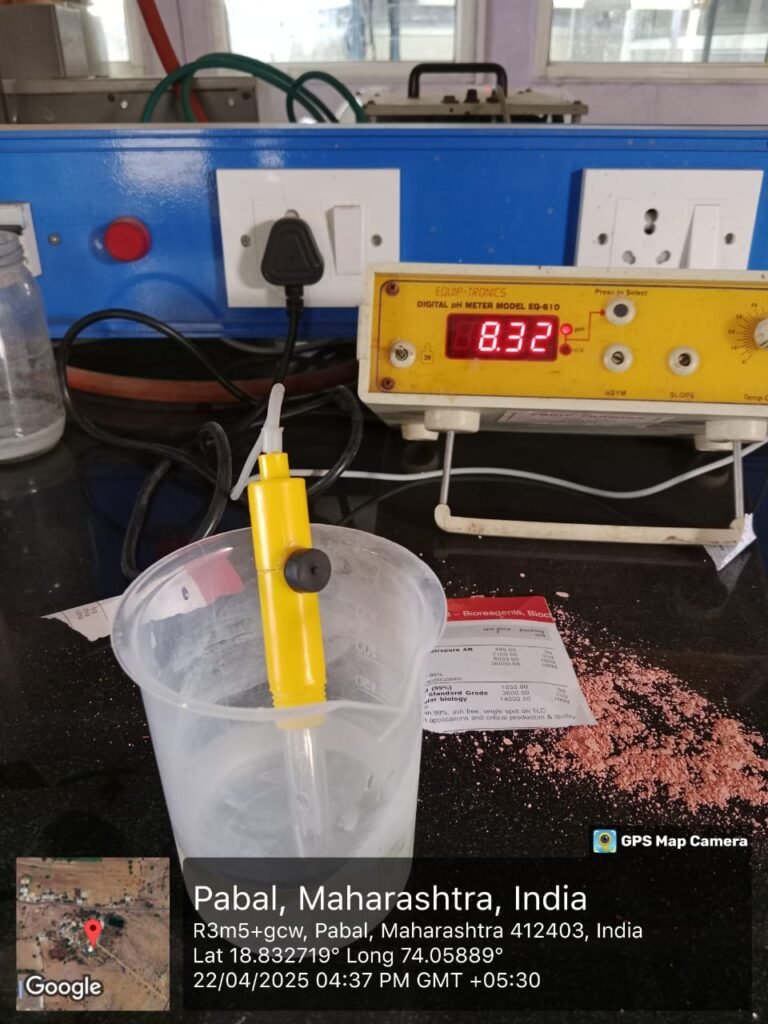
22/04/2025
We recorded the growth data of the spinach plants. We measured the height of each plant using a scale from the base to the topmost leaf to ensure accuracy. Additionally, we assessed the fresh weight of the plants by carefully uprooting them, gently removing excess soil and moisture, and weighing them using a digital balance. These measurements were documented to monitor the overall growth.
TANK A
EC = 1869
pH = 8.65
TANK B
EC = 1511
pH = 8.32
23/04/2025
We recorded the growth data of the lettuce plants. We measured the height of each plant using a scale from the base to the topmost leaf to ensure accuracy. Additionally, we assessed the fresh weight of the plants by carefully uprooting them, gently removing excess soil and moisture, and weighing them using a digital balance. These measurements were documented to monitor the overall growth.
Water was added to both tanks until the water level in each tank reached 200 liters.
45 liter of water added in tank A
185 liter of water in tank B.
Also calculated EC and pH of both tanks A and B,
TANK A
EC = 1700 pH = 8.14
TANK B
EC = 1080 pH = 7.98
25/04/2025
We recorded the growth data of the spinach plants. We measured the height of each plant using a scale from the base to the topmost leaf to ensure accuracy. Additionally, we assessed the fresh weight of the plants by carefully uprooting them, gently removing excess soil and moisture, and weighing them using a digital balance. These measurements were documented to monitor the overall growth.
The fertilizer was added to tank A and tank B, ensuring it was thoroughly mixed to achieve an even distribution. We added an equal amount of fertilizer in both tanks to ensure uniform nutrient availability for the plants. The fertilizer was measured carefully using a digital scale to maintain consistency in concentration. After mixing, the solutions in both tanks were thoroughly stirred to ensure even distribution of nutrients before being supplied to the plants.
Also added 800 ml of seaweed liquid in tank B.
After dosing EC and pH,
TANK A
EC = 1714 pH = 8.32
TANK B
EC = 1530 pH = 8.18
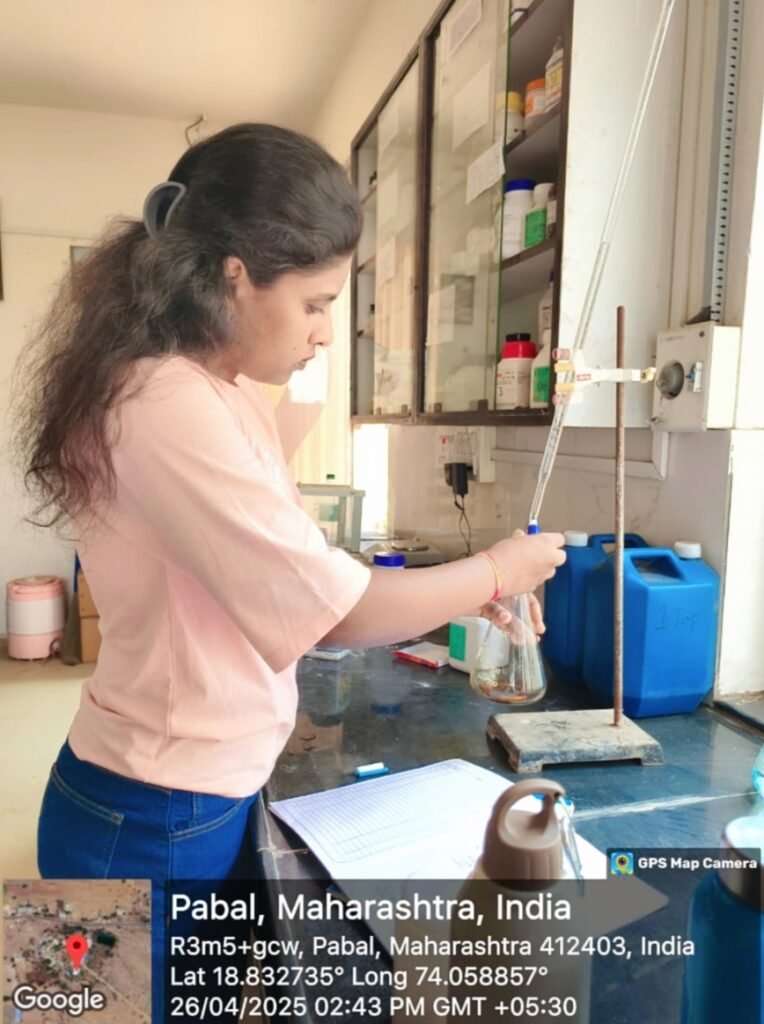
26/04/2025
We recorded the growth data of the lettuce plants. We measured the height of each plant using a scale from the base to the topmost leaf to ensure accuracy. Additionally, we assessed the fresh weight of the plants by carefully uprooting them, gently removing excess soil and moisture, and weighing them using a digital balance. These measurements were documented to monitor the overall growth.
The dissolved oxygen in both water tanks was determined. The oxygen in the water was measured.
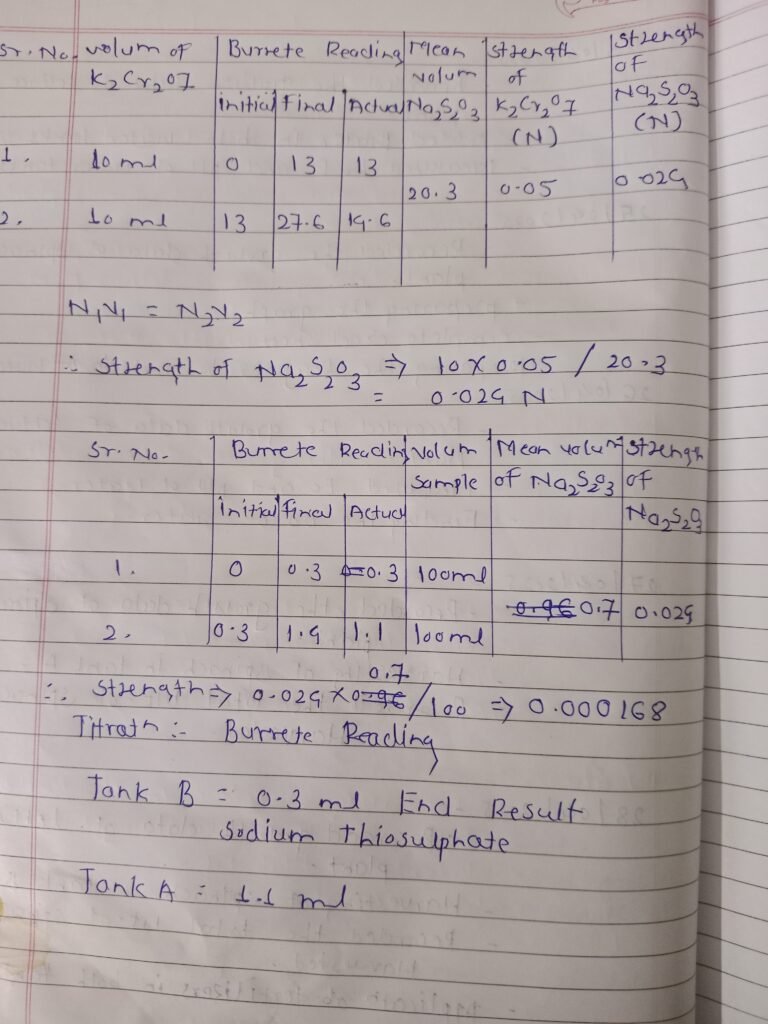

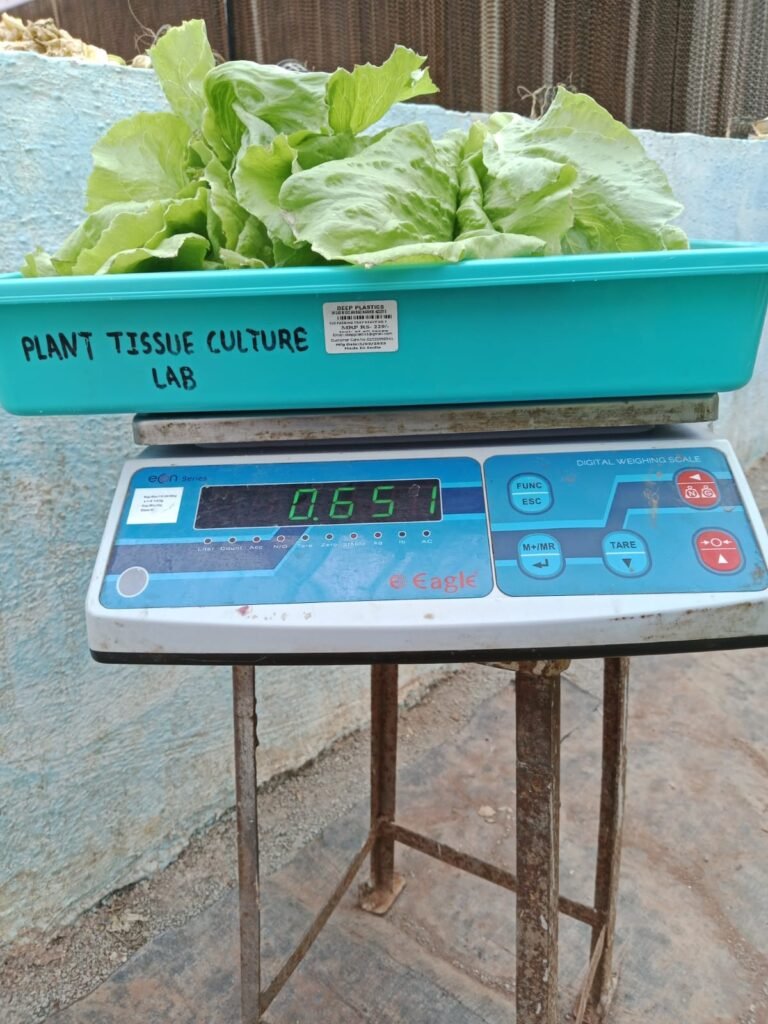
27/04/2025
we carried out the harvesting of Spinach from Tank A and B. Each head of lettuce was weighed carefully to determine the fresh yield. We compared the measured weight with the expected yield to the losses.
TANK A harvesting = 650gm
TANK B harvesting = 718 gm
28/04/2025
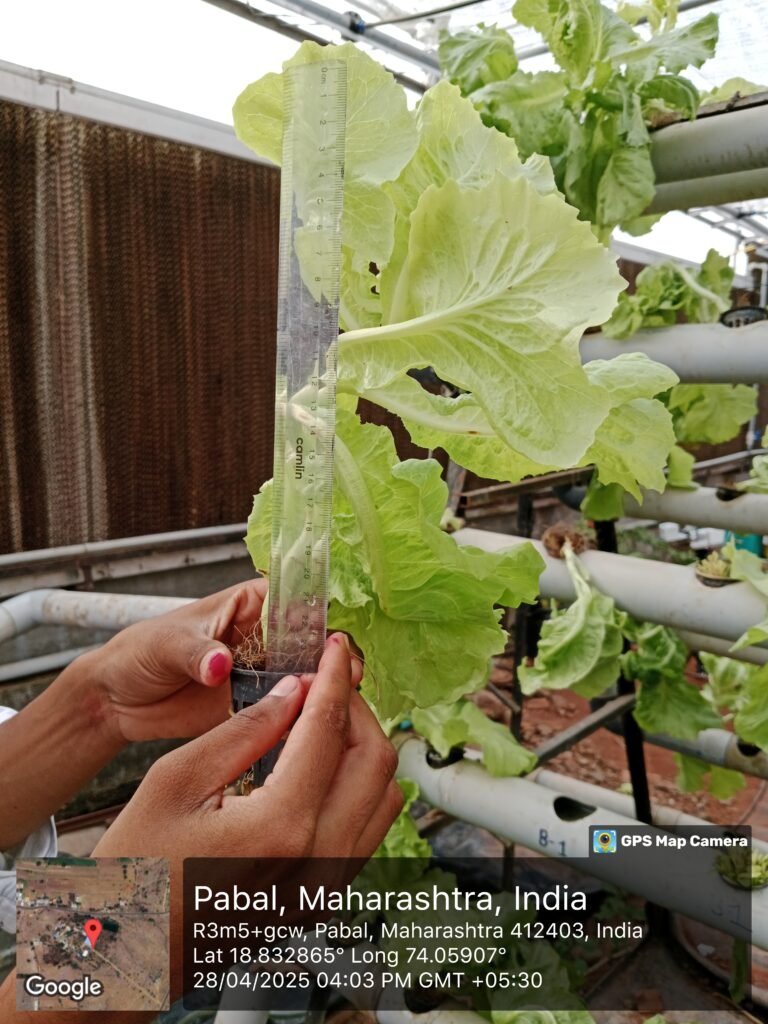
We recorded the growth data of the lettuce plants. We measured the height of each plant using a scale from the base to the topmost leaf to ensure accuracy. Additionally, we assessed the fresh weight of the plants by carefully uprooting them, gently removing excess soil and moisture, and weighing them using a digital balance. These measurements were documented to monitor the overall growth.
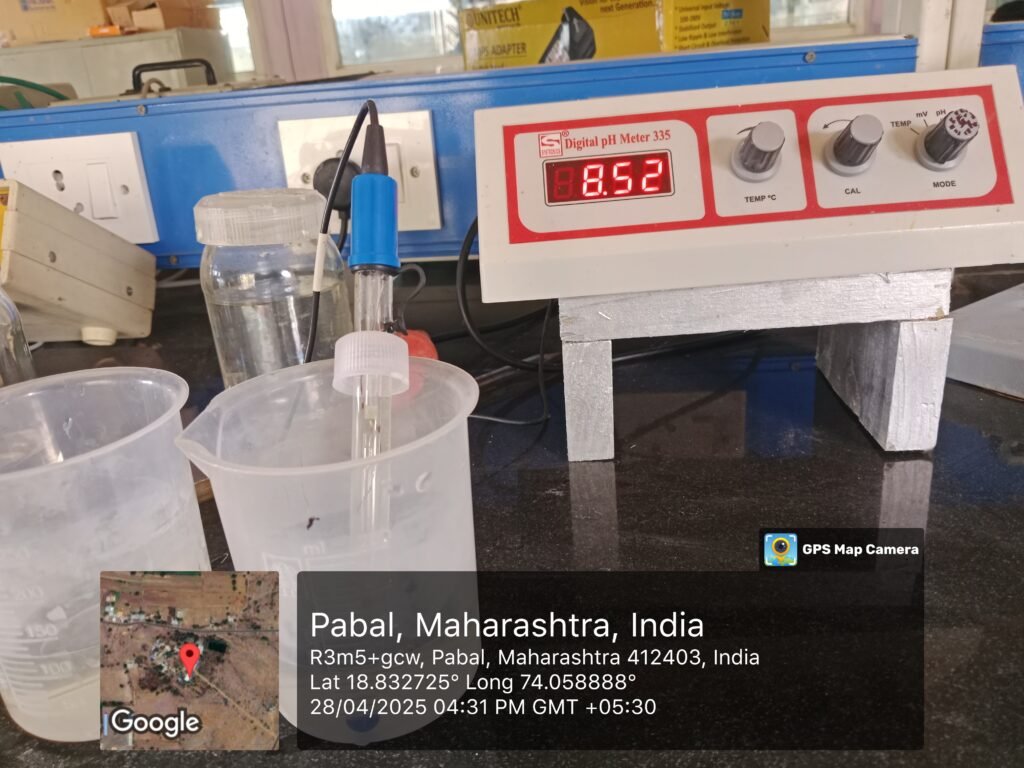
Also measured EC and pH of both tanks,
TANK A
EC = 1826
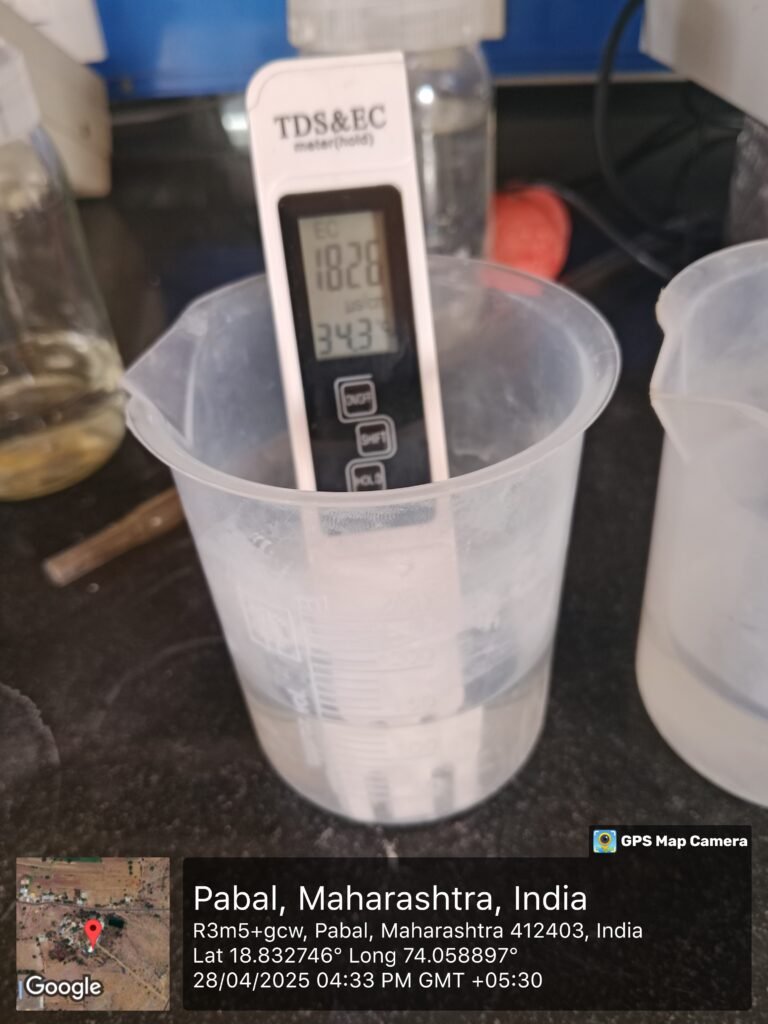
pH = 8.45
TANK B
EC = 1543
pH = 8.52
29/04/2025
We recorded the growth data of the Spinach plants. We measured the height of each plant using a scale from the base to the topmost leaf to ensure accuracy. Additionally, we assessed the fresh weight of the plants by carefully uprooting them, gently removing excess soil and moisture, and weighing them using a digital balance. These measurements were documented to monitor the overall growth.
30/04/2025
We recorded the growth data of the lettuce plants. We measured the height of each plant using a scale from the base to the topmost leaf to ensure accuracy. Additionally, we assessed the fresh weight of the plants by carefully uprooting them, gently removing excess soil and moisture, and weighing them using a digital balance. These measurements were documented to monitor the overall growth.
02/05/2025
We recorded the growth data of the Spinach plants. We measured the height of each plant using a scale from the base to the topmost leaf to ensure accuracy. Additionally, we assessed the fresh weight of the plants by carefully uprooting them, gently removing excess soil and moisture, and weighing them using a digital balance. These measurements were documented to monitor the overall growth.
03/05/2025
we carried out the harvesting of lettuce from Tank A and B. Each head of lettuce was weighed carefully to determine the fresh yield. We compared the measured weight with the expected yield to the losses.
04/05/2025
We recorded the growth data of the Lettuce plants. We measured the height of each plant using a scale from the base to the topmost leaf to ensure accuracy. Additionally, we assessed the fresh weight of the plants by carefully uprooting them, gently removing excess soil and moisture, and weighing them using a digital balance. These measurements were documented to monitor the overall growth.
Measured EC and pH of both water tanks,
TANK A
EC = 1845
pH = 8.57
TANK B
EC = 1551
pH = 8.64
05/05/2025
We recorded the growth data of the Spinach plants. We measured the height of each plant using a scale from the base to the topmost leaf to ensure accuracy. Additionally, we assessed the fresh weight of the plants by carefully uprooting them, gently removing excess soil and moisture, and weighing them using a digital balance. These measurements were documented to monitor the overall growth.
06/05/2025
We recorded the growth data of the Lettuce plants. We measured the height of each plant using a scale from the base to the topmost leaf to ensure accuracy. Additionally, we assessed the fresh weight of the plants by carefully uprooting them, gently removing excess soil and moisture, and weighing them using a digital balance. These measurements were documented to monitor the overall growth.
Measured EC and pH of both water tanks,
TANK A
EC =2115
pH =8.60
TANK B
EC =1554
pH =8.69
07/05/2025
We recorded the growth data of the Spinach plants. We measured the height of each plant using a scale from the base to the topmost leaf to ensure accuracy. Additionally, we assessed the fresh weight of the plants by carefully uprooting them, gently removing excess soil and moisture, and weighing them using a digital balance. These measurements were documented to monitor the overall growth.
https://docs.google.com/spreadsheets/d/1vdhNR58SrOovoDO2pfUE9YoDR1ut5Q3aW6iwfZ2cgqs/edit?usp=sharing
09/05/2025
We recorded the growth data of the Lettuce plants. We measured the height of each plant using a scale from the base to the topmost leaf to ensure accuracy. Additionally, we assessed the fresh weight of the plants by carefully uprooting them, gently removing excess soil and moisture, and weighing them using a digital balance. These measurements were documented to monitor the overall growth.
Measured EC and pH of both water tanks,
TANK A
EC = 2173
pH = 8.73
TANK B
EC = 2173
pH =8.67
10/05/2025
We recorded the growth data of the Spinach plants. We measured the height of each plant using a scale from the base to the topmost leaf to ensure accuracy. Additionally, we assessed the fresh weight of the plants by carefully uprooting them, gently removing excess soil and moisture, and weighing them using a digital balance. These measurements were documented to monitor the overall growth.
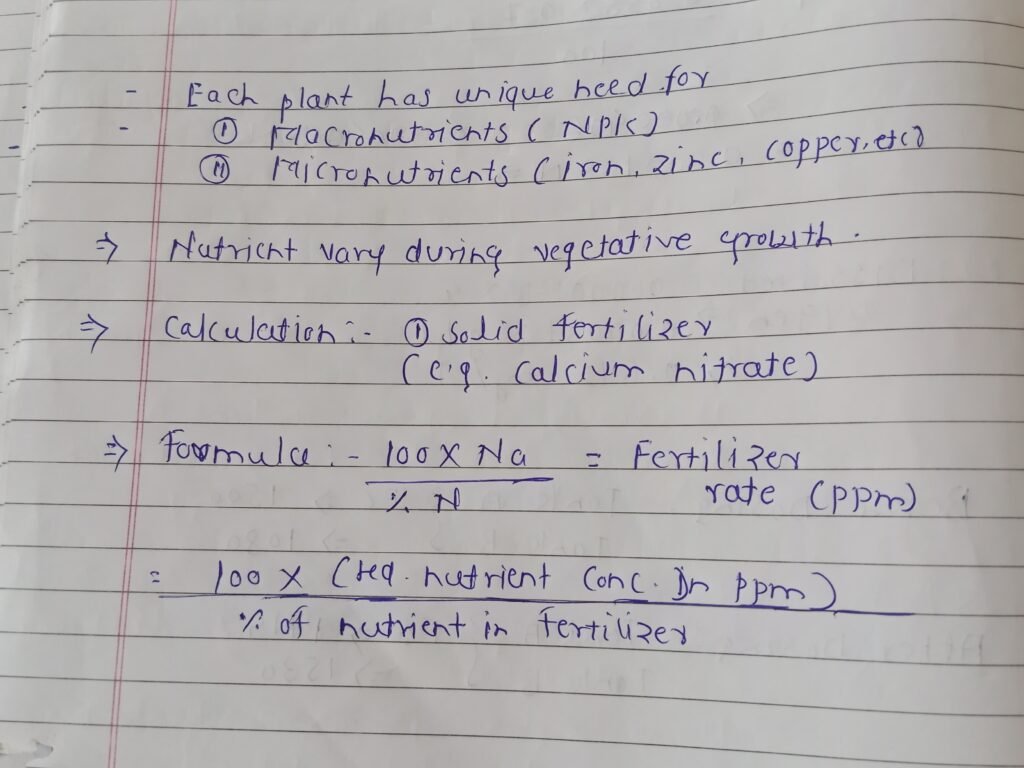
Calculated the standard nutrient requirements of the lettuce plant and identified the different fertilizers used for growing lettuce in hydroponics.
11/05/2025
We recorded the growth data of the Lettuce plants. We measured the height of each plant using a scale from the base to the topmost leaf to ensure accuracy. Additionally, we assessed the fresh weight of the plants by carefully uprooting them, gently removing excess soil and moisture, and weighing them using a digital balance. These measurements were documented to monitor the overall growth.
Added water to the DWC tank and turned on the bubbler.
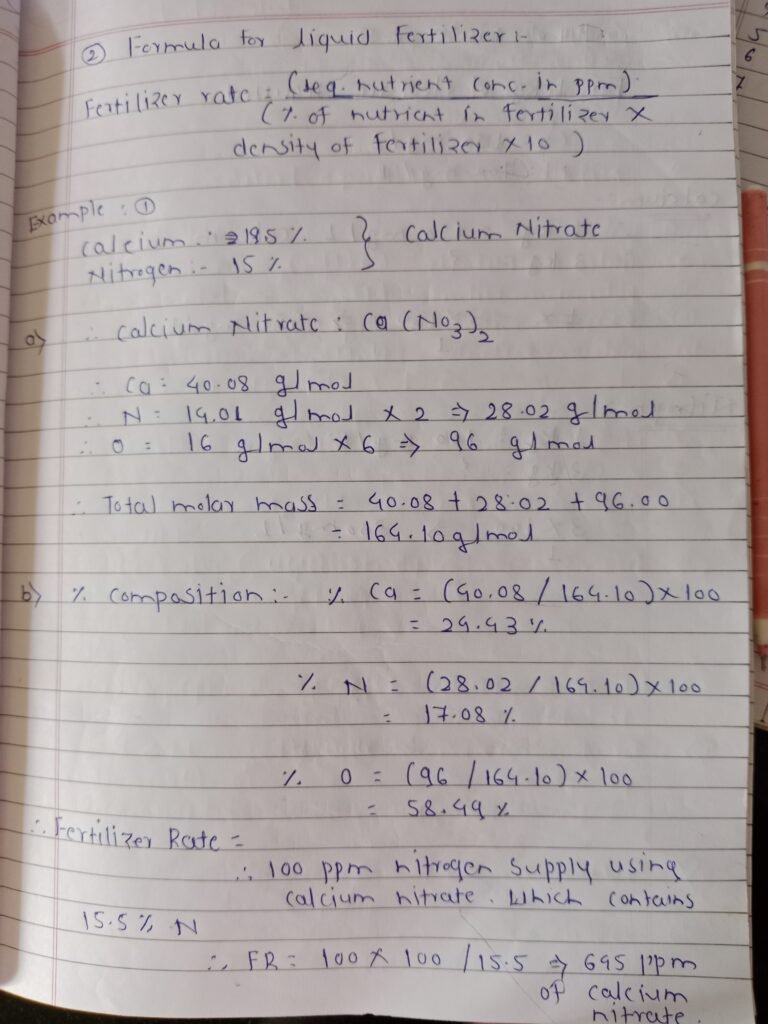
Found the formulas of different solid and liquid fertilizers and find out the fertilizer rate.
12/05/2025
We recorded the growth data of the spinach plants. We measured the height of each plant using a scale from the base to the topmost leaf to ensure accuracy. Additionally, we assessed the fresh weight of the plants by carefully uprooting them, gently removing excess soil and moisture, and weighing them using a digital balance. These measurements were documented to monitor the overall growth.
Measured EC and pH of both water tanks,
TANK A
EC = 1967
pH = 8.62
TANK B
EC = 1586
pH = 8.70
we carried out the harvesting of lettuce from DWC tank . Each head of lettuce was weighed carefully to determine the fresh yield.
DWC tank harvesting = 1966 gm
13/05/2025
We recorded the growth data of the Lettuce plants. We measured the height of each plant using a scale from the base to the topmost leaf to ensure accuracy. Additionally, we assessed the fresh weight of the plants by carefully uprooting them, gently removing excess soil and moisture, and weighing them using a digital balance. These measurements were documented to monitor the overall growth.
planted the mint into DWC tank.
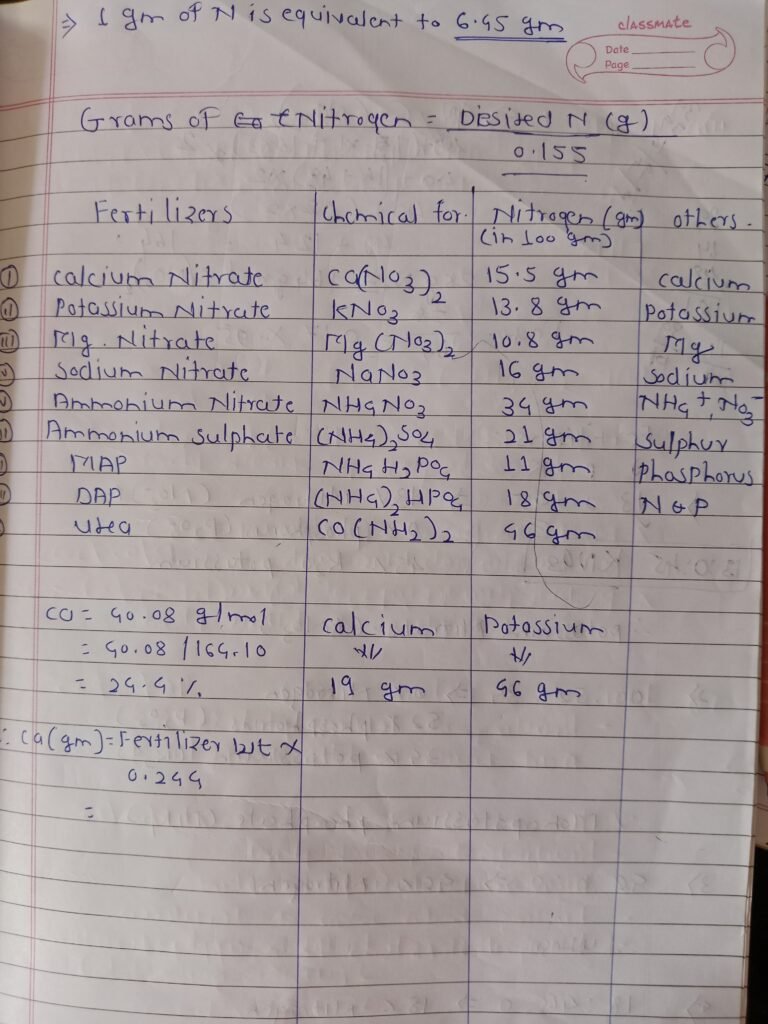
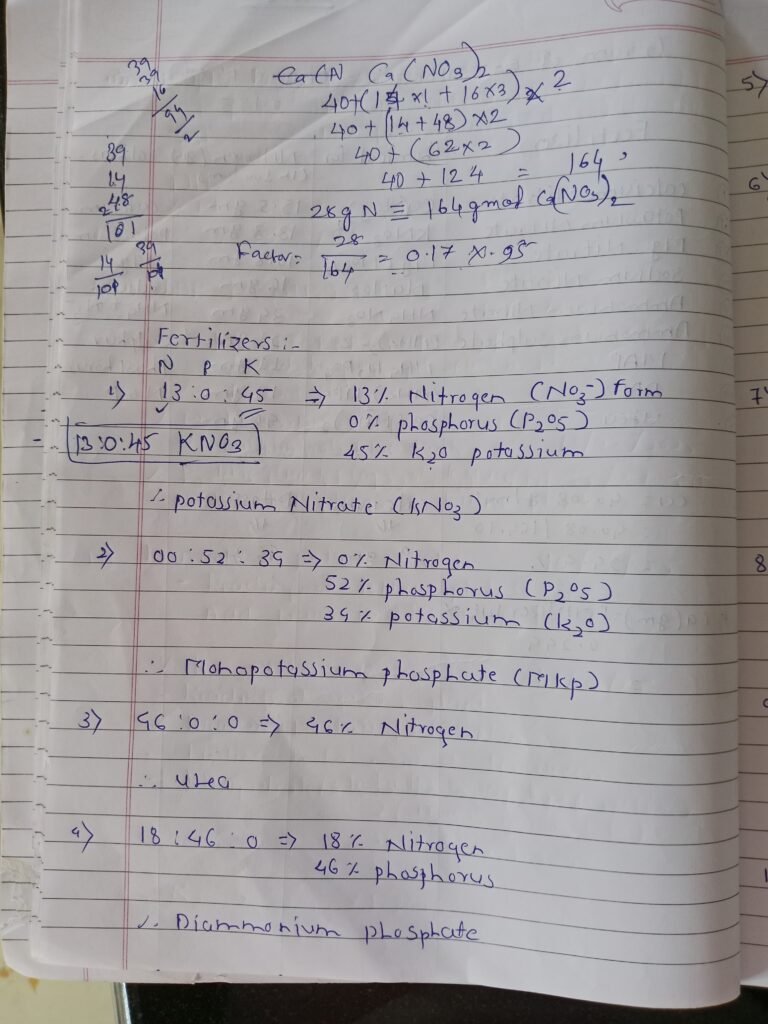
Found the different fertilizer with their chemical formulas and amount of nitrogen present in that fertilizers.
14/05/2025
We recorded the growth data of the spinach plants. We measured the height of each plant using a scale from the base to the topmost leaf to ensure accuracy. Additionally, we assessed the fresh weight of the plants by carefully uprooting them, gently removing excess soil and moisture, and weighing them using a digital balance. These measurements were documented to monitor the overall growth.
Water was added to both tanks until the water level in each tank reached 200 liters.
190 liter of water added in tank A
76 liter of water in tank B.
16/05/2025
We recorded the growth data of the Lettuce plants. We measured the height of each plant using a scale from the base to the topmost leaf to ensure accuracy. Additionally, we assessed the fresh weight of the plants by carefully uprooting them, gently removing excess soil and moisture, and weighing them using a digital balance. These measurements were documented to monitor the overall growth.
Found the fertilizers that were available in the market included various types such as nitrogenous, phosphatic, potassic, complex (NPK), micronutrient.
17/05/2025
Calculated the molar mass of the fertilizer that was used in hydroponics.
We recorded the growth data of the spinach plants. We measured the height of each plant using a scale from the base to the topmost leaf to ensure accuracy. Additionally, we assessed the fresh weight of the plants by carefully uprooting them, gently removing excess soil and moisture, and weighing them using a digital balance. These measurements were documented to monitor the overall growth.
18/05/2025
We recorded the growth data of the lettuce plants. We measured the height of each plant using a scale from the base to the topmost leaf to ensure accuracy. Additionally, we assessed the fresh weight of the plants by carefully uprooting them, gently removing excess soil and moisture, and weighing them using a digital balance. These measurements were documented to monitor the overall growth.
Measured EC and pH of both water tanks,
TANK A
EC = 1483
pH = 8.26
TANK B
EC = 1628
pH = 8.71
19/05/2025
We recorded the growth data of the spinach plants. We measured the height of each plant using a scale from the base to the topmost leaf to ensure accuracy. Additionally, we assessed the fresh weight of the plants by carefully uprooting them, gently removing excess soil and moisture, and weighing them using a digital balance. These measurements were documented to monitor the overall growth.
We successfully germinated new lettuce seeds by placing them in a moist paper towel and keeping them in a warm, dark environment for several days until they sprouted.
Tray capacity =127 plants
Total no. Of trays = 3
The total number of seeds planted was = 127 *3
= 381 plants
20/05/2025
We recorded the growth data of the lettuce plants. We measured the height of each plant using a scale from the base to the topmost leaf to ensure accuracy. Additionally, we assessed the fresh weight of the plants by carefully uprooting them, gently removing excess soil and moisture, and weighing them using a digital balance. These measurements were documented to monitor the overall growth.
The fertilizer was added to tank A and tank B, ensuring it was thoroughly mixed to achieve an even distribution. We added an equal amount of fertilizer in both tanks to ensure uniform nutrient availability for the plants. The fertilizer was measured carefully using a digital scale to maintain consistency in concentration. After mixing, the solutions in both tanks were thoroughly stirred to ensure even distribution of nutrients before being supplied to the plants.
21/05/2025
We recorded the growth data of the spinach plants. We measured the height of each plant using a scale from the base to the topmost leaf to ensure accuracy. Additionally, we assessed the fresh weight of the plants by carefully uprooting them, gently removing excess soil and moisture, and weighing them using a digital balance. These measurements were documented to monitor the overall growth.
Measured EC and pH of both water tanks,
TANK A
EC =1483
. pH =8.26
TANK B
EC =1628
pH =8.71
23/05/2025
We recorded the growth data of the lettuce plants. We measured the height of each plant using a scale from the base to the topmost leaf to ensure accuracy. Additionally, we assessed the fresh weight of the plants by carefully uprooting them, gently removing excess soil and moisture, and weighing them using a digital balance. These measurements were documented to monitor the overall growth.
A t-test was conducted to assess whether there was a significant difference in the weights of lettuce plants grown under two different conditions.
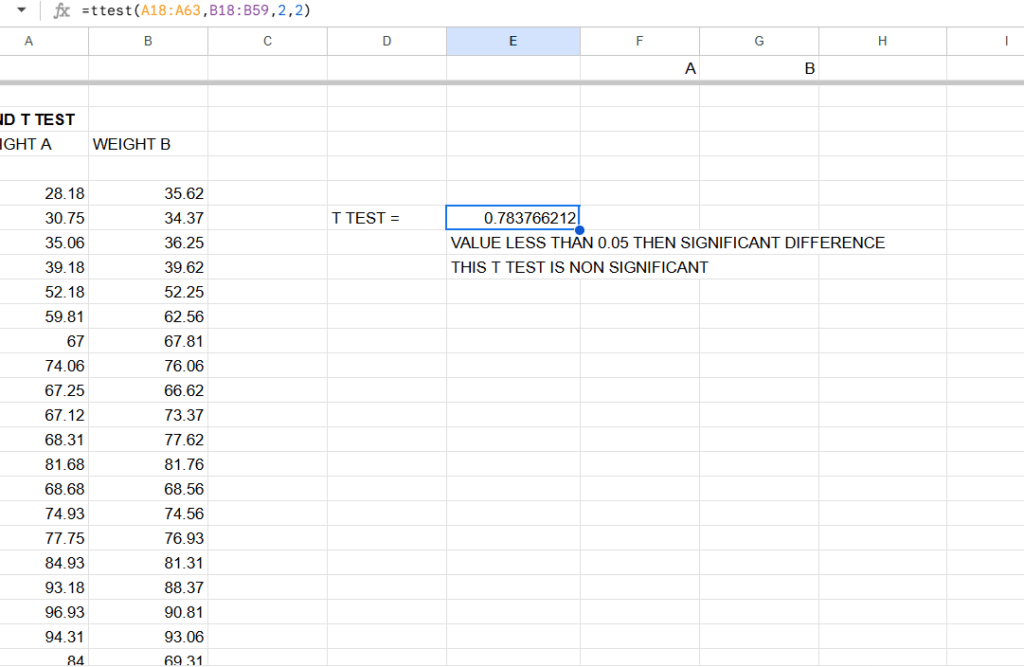
Conclusion
Based on the statistical analysis, it was concluded that the weight differences observed between the two groups of lettuce plants were statistically not significant. This finding implies that the conditions under which the plants were grown had no measurable impact on their growth.
24/05/2025
We recorded the growth data of the spinach plants. We measured the height of each plant using a scale from the base to the topmost leaf to ensure accuracy. Additionally, we assessed the fresh weight of the plants by carefully uprooting them, gently removing excess soil and moisture, and weighing them using a digital balance. These measurements were documented to monitor the overall growth.
A t-test was conducted to assess whether there was a significant difference in the Heights of lettuce plants grown under two different conditions.
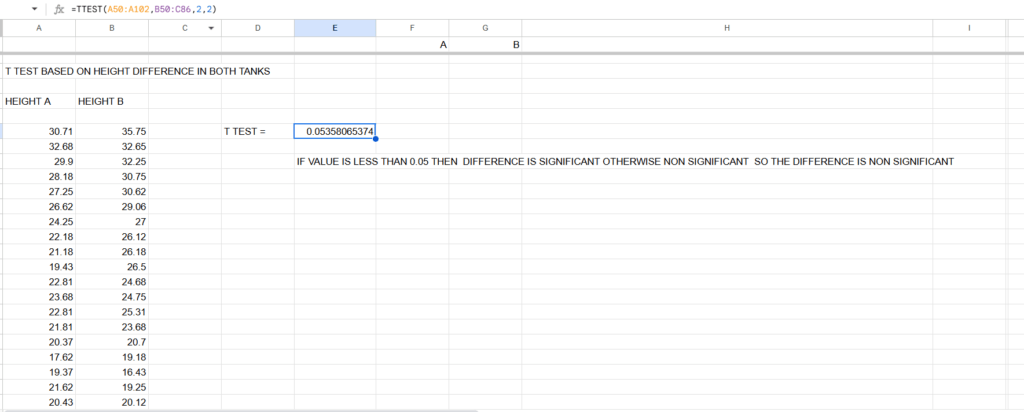
Conclusion
Based on the statistical analysis, it was concluded that the weight differences observed between the two groups of lettuce plants were statistically not significant. This finding implies that the conditions under which the plants were grown had no measurable impact on their growth.
25/05/2025
We recorded the growth data of the lettuce plants. We measured the height of each plant using a scale from the base to the topmost leaf to ensure accuracy. Additionally, we assessed the fresh weight of the plants by carefully uprooting them, gently removing excess soil and moisture, and weighing them using a digital balance. These measurements were documented to monitor the overall growth.
A t-test was conducted to assess whether there was a significant difference in the Roots of lettuce plants grown under two different conditions.
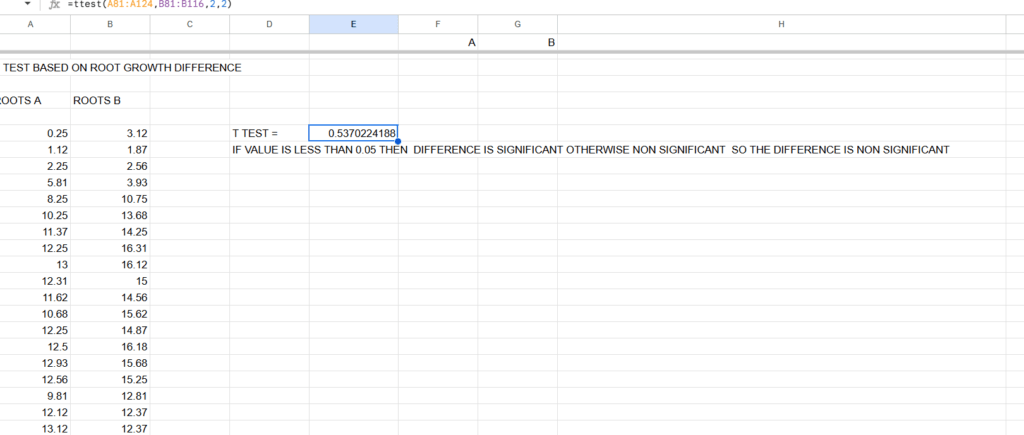
Conclusion
Based on the statistical analysis, it was concluded that the height differences observed between the two groups of lettuce plants were statistically significant. This finding implies that the conditions under which the plants were grown had a measurable impact on their growth, warranting further investigation into the specific factors contributing to this difference.
26/05/2025
We recorded the growth data of the spinach plants. We measured the height of each plant using a scale from the base to the topmost leaf to ensure accuracy. Additionally, we assessed the fresh weight of the plants by carefully uprooting them, gently removing excess soil and moisture, and weighing them using a digital balance. These measurements were documented to monitor the overall growth.
Measured EC and pH of both water tanks,
TANK A
EC =1967
pH =8.62
TANK B
EC =1586
pH =8.70
27/05/2025
Conclusion :
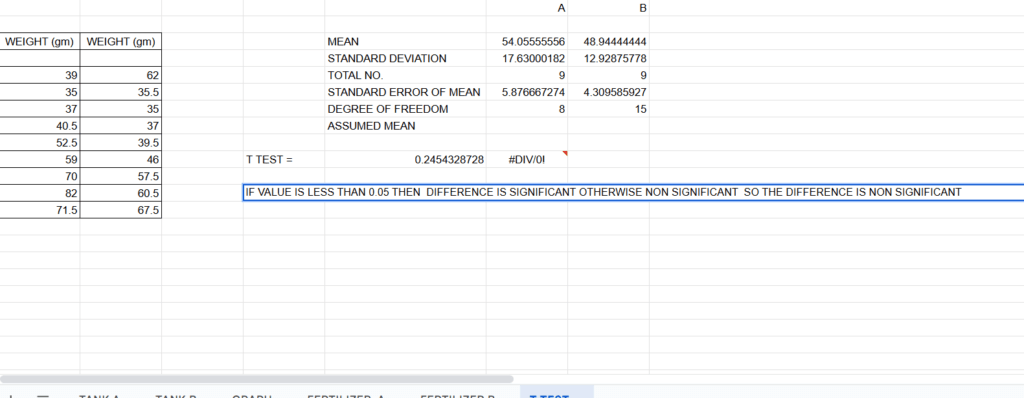
1. The independent samples t-test conducted on the weights of lettuce plants yielded a p-value of 0.783, which was greater than the significance level of 0.05. This indicated that the difference in plant weight between the control and treatment groups was not statistically significant.
2. The independent samples t-test conducted on the Heights of lettuce plants yielded a p-value of 0.053, which was same to the significance level of 0.05. This indicated that the difference in plant weight between the control and treatment groups was statistically significant.
3. The independent samples t-test conducted on the Roots of lettuce plants yielded a p-value of 0.131, which was greater than the significance level of 0.05. This indicated that the difference in plant weight between the control and treatment groups was not statistically significant.
30/05/2025
Prepared the note on the First Hydroponic Trial
We conducted the first trial of our hydroponic system to evaluate its performance and observe plant response under controlled conditions. During this trial, we prepared the nutrient solution according to the crop requirements and monitored the water parameters such as pH, EC (Electrical Conductivity), and temperature on a regular basis. The plants were carefully transplanted into the system, and their growth was observed daily. Fertilizer application was carried out based on EC readings to maintain nutrient balance. Additionally, we ensured proper aeration by installing bubblers to increase the dissolved oxygen levels in the water. This initial trial helped us understand the basic setup requirements, nutrient management, and plant response in a soilless growing environment.
01/06/2025
T-Test Conducted on Lettuce Yield
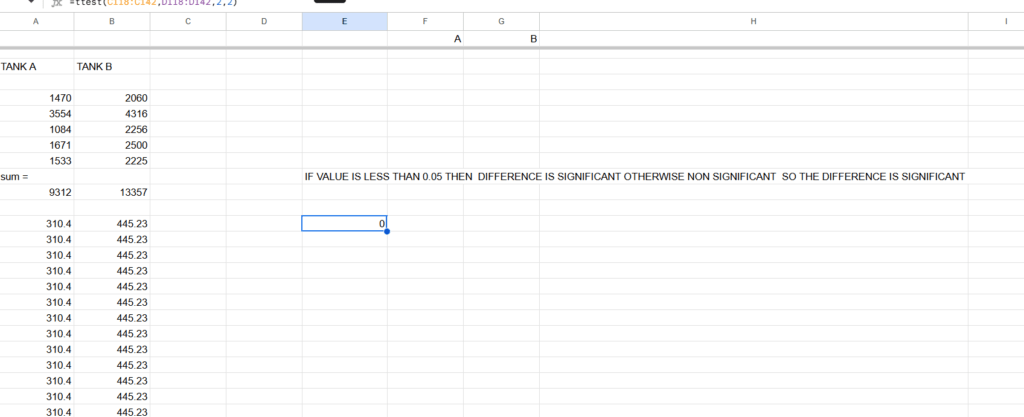
A t-test was conducted to statistically analyze the yield differences in lettuce grown under two different nutrient treatments. Lettuce plants were cultivated in two separate tanks: Tank A, which received only chemical fertilizers, and Tank B, which received a combination of chemical fertilizers and seaweed-based organic fertilizer.
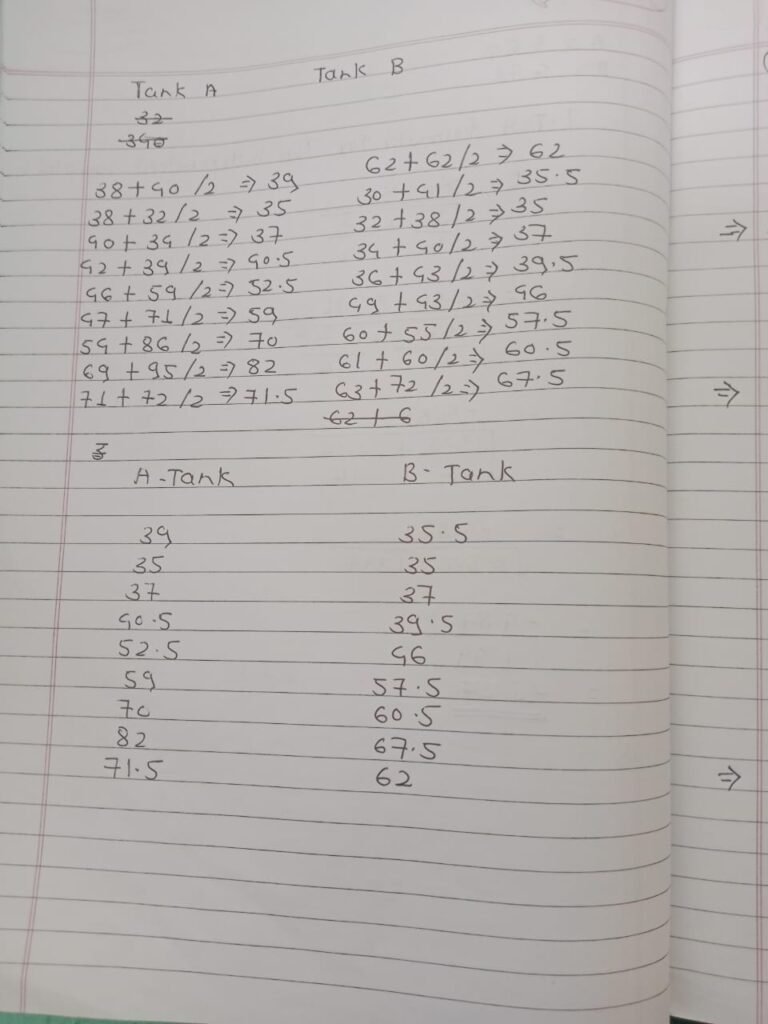
At the time of harvest, the fresh weight (yield) of lettuce from each tank was recorded. A total of 30 samples were collected from each treatment group. The average yield and standard deviation were calculated for both groups. The independent two-sample t-test was then applied to determine whether the difference in yield between the two treatments was statistically significant.
The null hypothesis stated that there was no significant difference in yield between the two groups, while the alternative hypothesis suggested that the yield differed due to the variation in nutrient treatment. Based on the calculated t-value and p-value, we interpreted the results accordingly. This statistical analysis helped validate the effect of seaweed fertilizer on crop yield performance in a hydroponic system.
02/06/2025
T-Test Conducted on Lettuce Yield first conclusion :
The t-test conducted to compare the lettuce yields between Tank A (chemical fertilizer only) and Tank B (chemical + seaweed fertilizer) revealed that the difference in yield was not statistically significant.
Although Tank B showed a higher average yield compared to Tank A, the difference was large. The p-value obtained from the test was greater than 0.05, which indicated that the observed variation in yield could have occurred by chance.
This result suggested that the addition of seaweed fertilizer did not have a significant impact on lettuce yield during the first trial. Other factors such as environmental conditions, plant variety, or trial duration may have influenced the outcome. Further trials may be needed to confirm any long-term effects of seaweed-based fertilizers on crop performance in hydroponic systems.
03/06/2025
Observation vs. T-Test Result on Lettuce Yield
Visually, a noticeable difference in lettuce yield was observed between Tank A and Tank B. The plants in Tank B, which received a combination of chemical and seaweed fertilizers, appeared healthier and produced slightly larger heads compared to those in Tank A, which received only chemical fertilizers. However, when the yield data were statistically analyzed using an independent t-test, the results showed no significant difference between the two treatments.
This contradiction between visual observation and statistical analysis prompted a review of the trial design. Upon investigation, it was found that the number of samples used for the t-test was too small to detect a meaningful difference. Due to the limited sample size, the statistical power of the test was reduced, which increased the likelihood of a Type II error—failing to detect a real difference when one actually exists.
Therefore, we concluded that the non-significant result of the t-test may not accurately reflect the true effect of the seaweed fertilizer. For future trials, it was decided to increase the number of replications and ensure a more robust data set to improve the reliability and accuracy of the statistical analysis.
04/06/2025
Sample Size Limitation and Plan for Revised T-Test
In the initial trial, we collected a total of 5 samples from each tank—Tank A (chemical fertilizer only) and Tank B (chemical + seaweed fertilizer).
This small sample size was identified as a key limitation in the statistical analysis. When the independent t-test was conducted using these samples, the results showed no significant difference in lettuce yield between the two treatments.Given the low number of samples, the statistical power of the test was insufficient to reliably detect actual differences. We recognized that such a limited dataset increases the risk of inaccurate conclusions, especially in biological experiments where natural variability is expected.
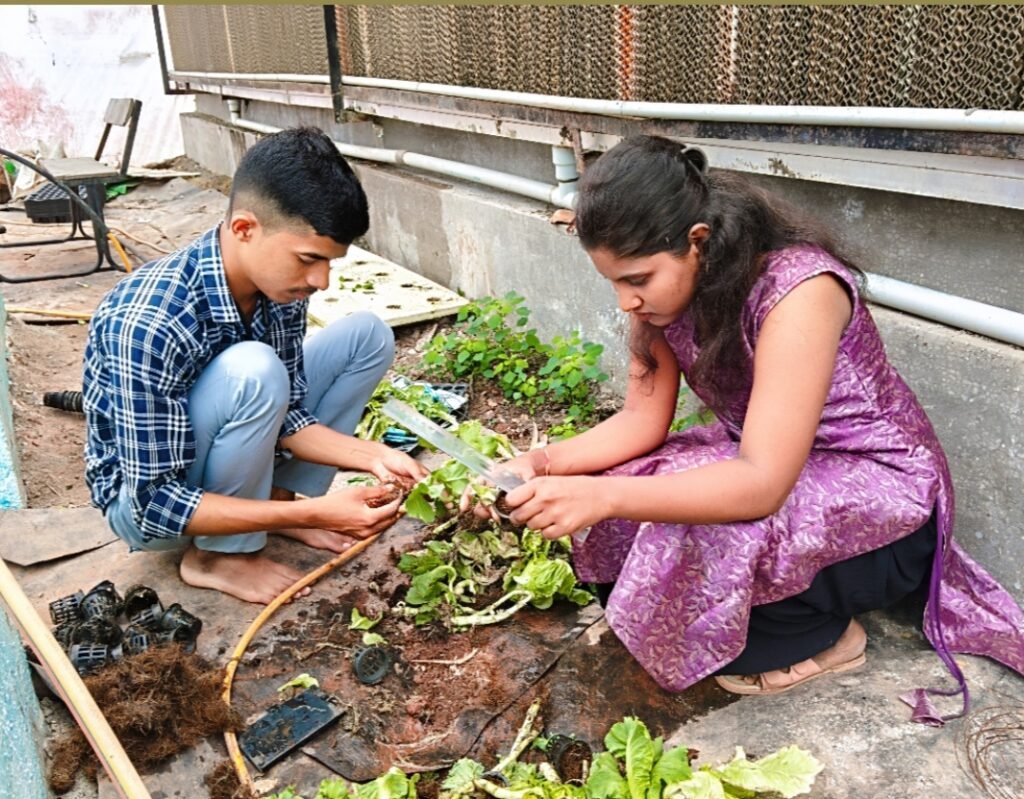
To address this issue, we decided to split each harvested sample into sub-samples in order to increase the total number of data points. By doing this, we aimed to expand the dataset without requiring additional full-sized harvests.
Once the sample size was effectively increased, we re-conducted the t-test with the new data set, expecting improved sensitivity and more reliable results.This adjustment allowed us to better evaluate the impact of the seaweed fertilizer treatment and draw conclusions with greater statistical confidence.
06/06/2025
We initially had 5 samples from each tank, which was insufficient to achieve statistical significance in the t-test. Therefore, we decided to split each of the 5 samples into 5 sub-samples, increasing the total number of samples to 25 for each tank. After this, we conducted the t-test again using the expanded dataset. This time, the results showed a statistically significant difference between the two tanks, indicating that the treatment had a measurable impact.
07/06/2025
We successfully completed all the t-tests for our experimental data. After analyzing the results, we observed clear trends and outcomes. Based on these, we prepared and finalized the concluding notes, which summarized the findings of each t-test and highlighted any statistically significant differences observed during the trials.
07/06/2025https://1drv.ms/w/c/a37be4bd92fb27ac/Ebwd4wC1cH1IpC4yXCz_QT8BGDmQk5jvfjLxhyUafYDVdg?e=rv9kB2
08/06/2025
After completing the previous trial, we moved on to our next phase of experimentation with lettuce. We placed an order for 447 lettuce seedlings from the nursery. Once the plants were delivered, we prepared both the NFT (Nutrient Film Technique) and DWC (Deep Water Culture) systems for transplantation.
The seedlings were then carefully transplanted into both systems to begin the new trial, aiming to compare plant performance and growth under each hydroponic method.
09/06/2025
We scheduled an online meeting with Prachi ma’am, who is also associated with Raftech Solutions Company. The purpose of the meeting was to guide her team on the concept and application of the t-test.
During the session, i explained the theoretical background of the t-test, its importance in experimental data analysis, and the step-by-step procedure to calculate it using sample data. We also demonstrated how to interpret the results to determine whether the observed differences between treatments were statistically significant.
10/06/2025
After receiving the lettuce seedlings from the nursery, we immediately began the transplantation process. The seedlings were carefully placed into net cups filled with a suitable growing medium to support their initial growth.
Before transplantation, we thoroughly cleaned and disinfected all the NFT (Nutrient Film Technique) and DWC (Deep Water Culture) tanks to ensure a hygienic environment for the new trial.
We then filled both NFT tanks with 200 liters of clean water each, and both DWC tanks with 1000 liters of water each.


Once the tanks were filled and the systems were functioning properly, we placed the lettuce plants into their respective systems to initiate the new hydroponic trial.
This setup marked the beginning of our next experimental phase focused on evaluating growth performance in different hydroponic conditions.
11/06/202
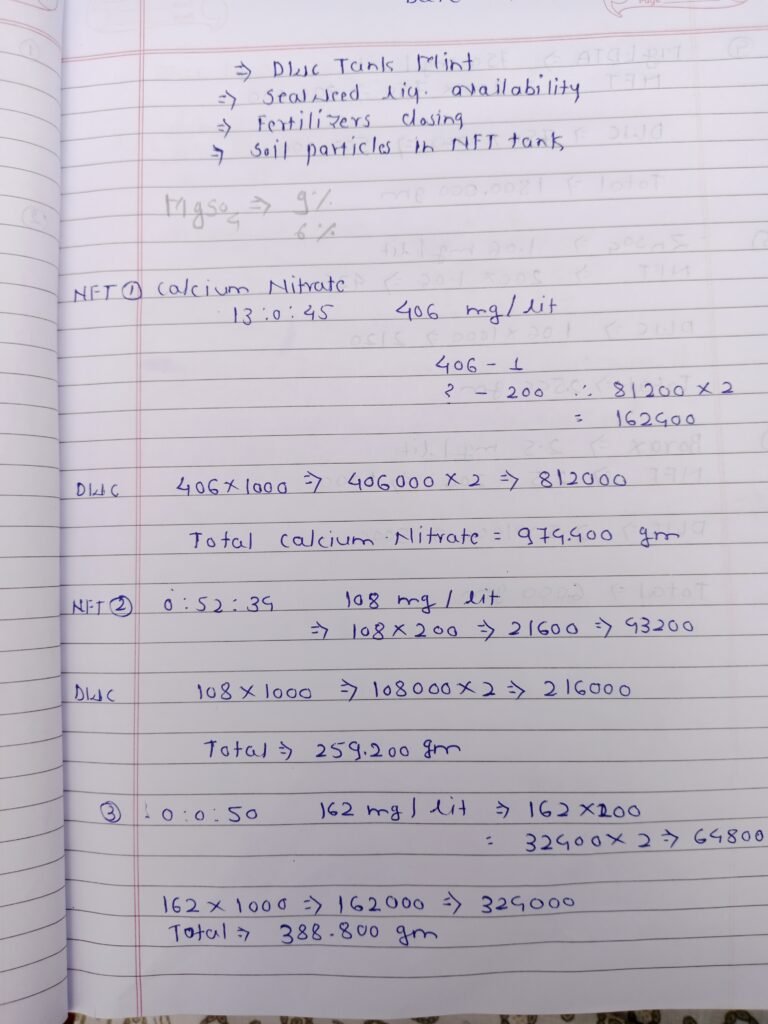
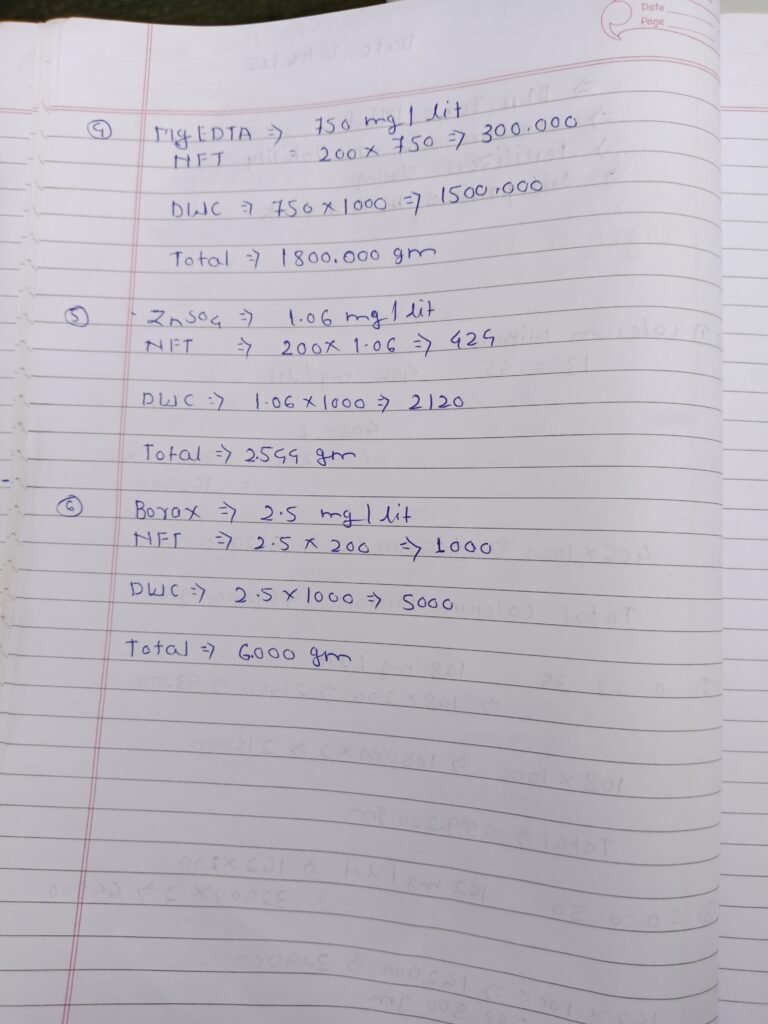
We purchased the required chemical fertilizers from the market to support the nutrient needs of the newly transplanted lettuce plants. The fertilizers included Magnesium Sulphate, Zinc Sulphate, Boron, and 0:0:50 (Potassium Sulphate).

After procurement, we calculated the appropriate dosage for each system based on the volume of water it contained—200 liters in each NFT tank and 1000 liters in each DWC tank.The fertilizers were then carefully applied to each system in proportionate amounts to ensure balanced nutrient availability.

13/06/2025
After nutrient application, we measured the Electrical Conductivity (EC) and pH levels of the water in all systems to confirm that the nutrient concentrations were within the optimal range for lettuce growth. These initial measurements helped us ensure a suitable growing environment at the start of the trial.
NFT
TANK A
EC = 1512
pH = 8.28
TANK B
EC = 1512
pH = 8.28
DWC
TANK A
EC = 1773
pH = 8.12
TANK B
EC = 1687
pH = 8.19
14/06/2025
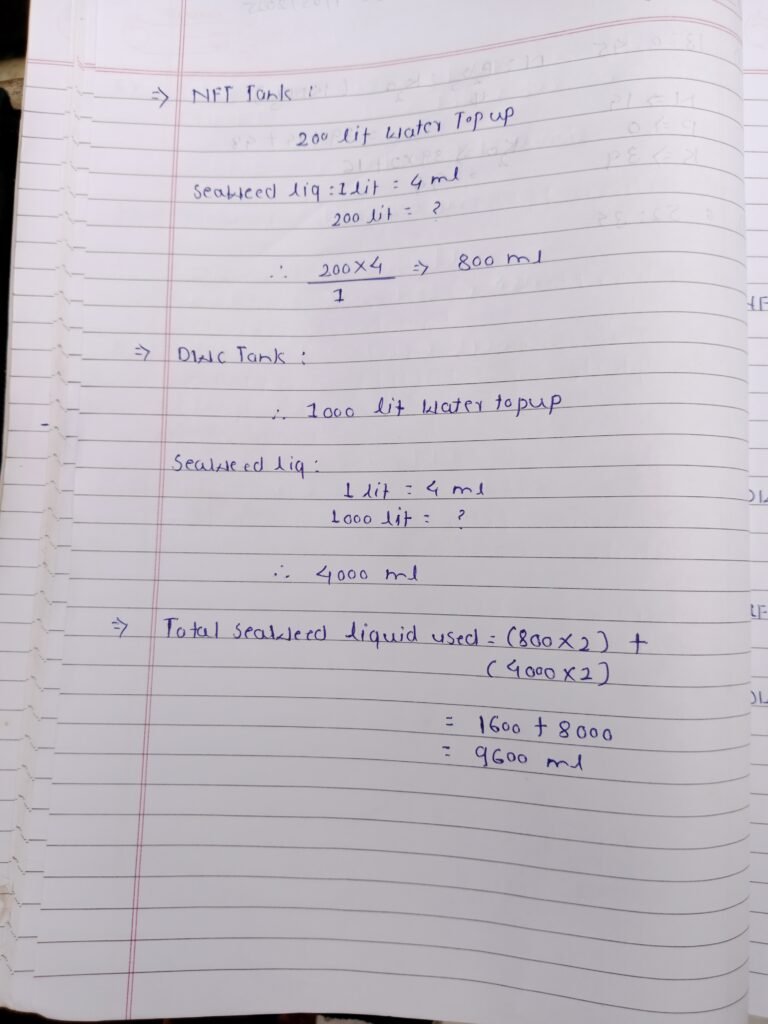
l calculated the amount of seaweed liquid fertilizer required for both the NFT (Nutrient Film Technique) and DWC (Deep Water Culture) hydroponic systems. The calculation was based on the volume of water in each system and the recommended dosage per liter.
16/06/2025
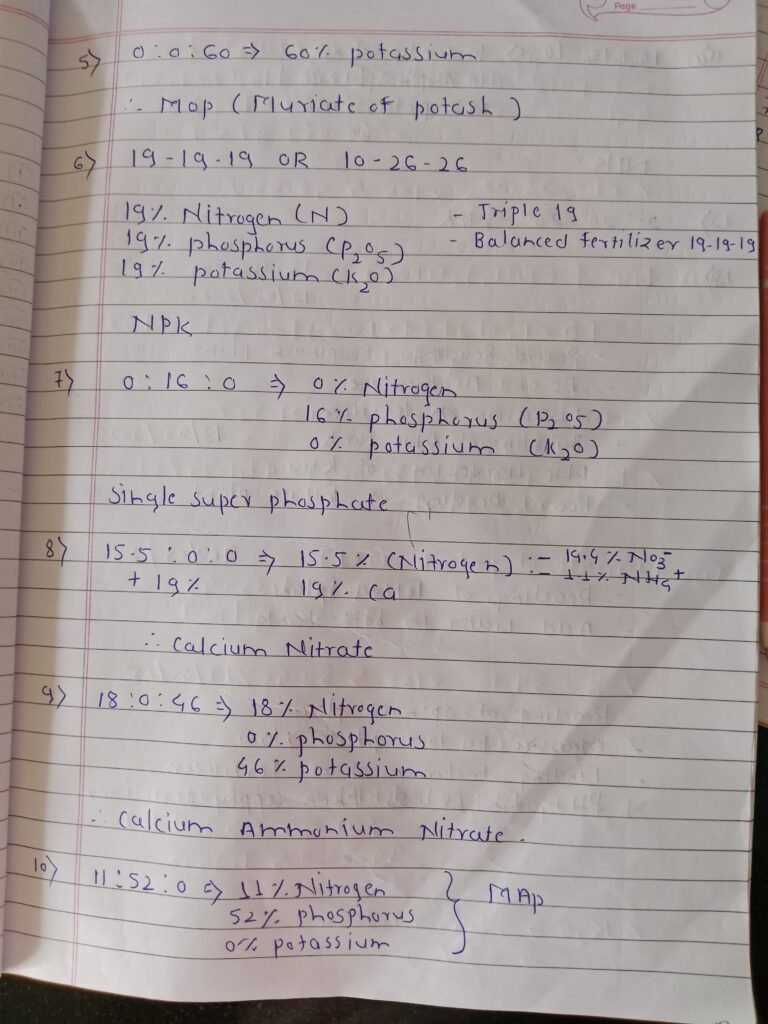
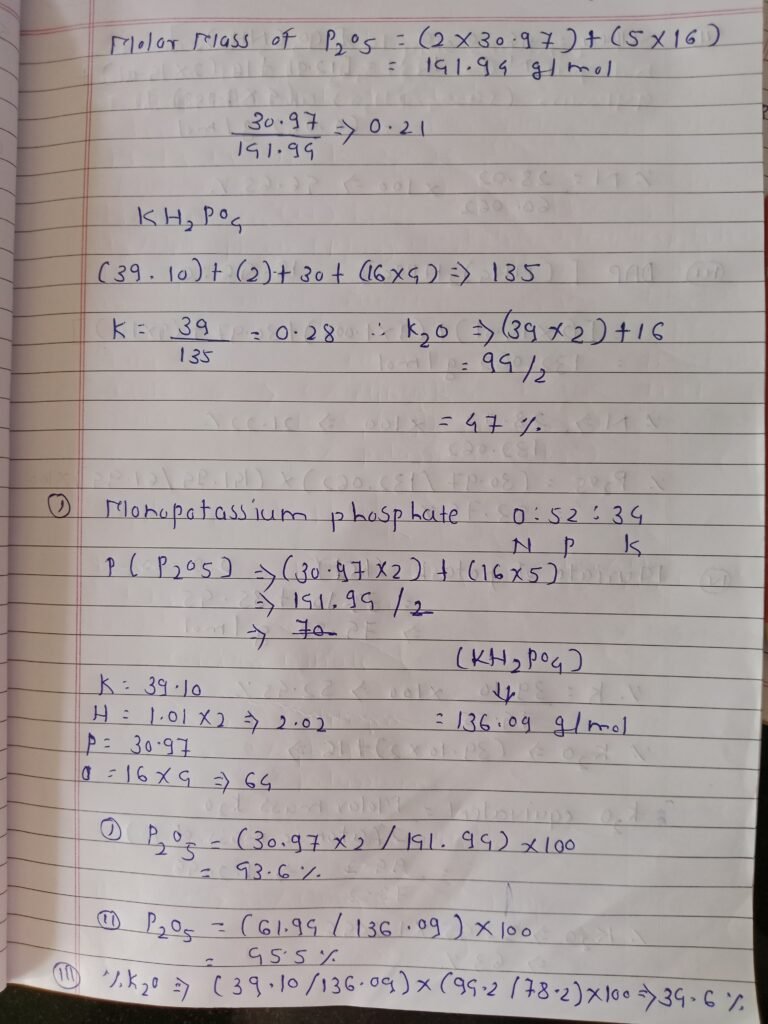
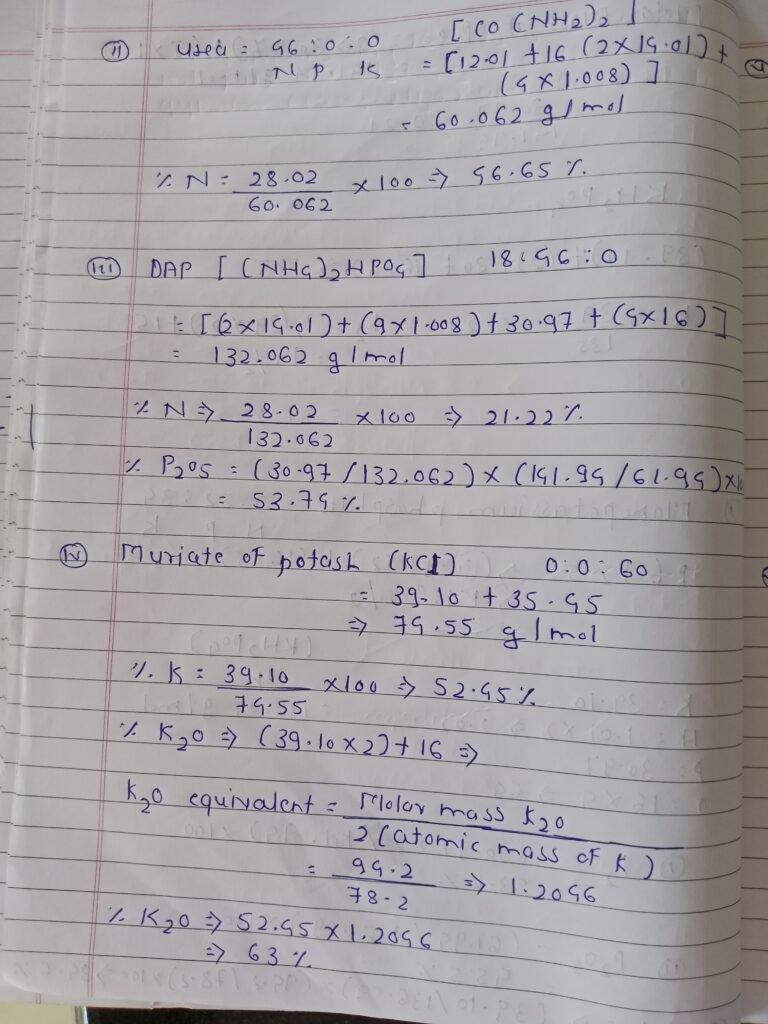
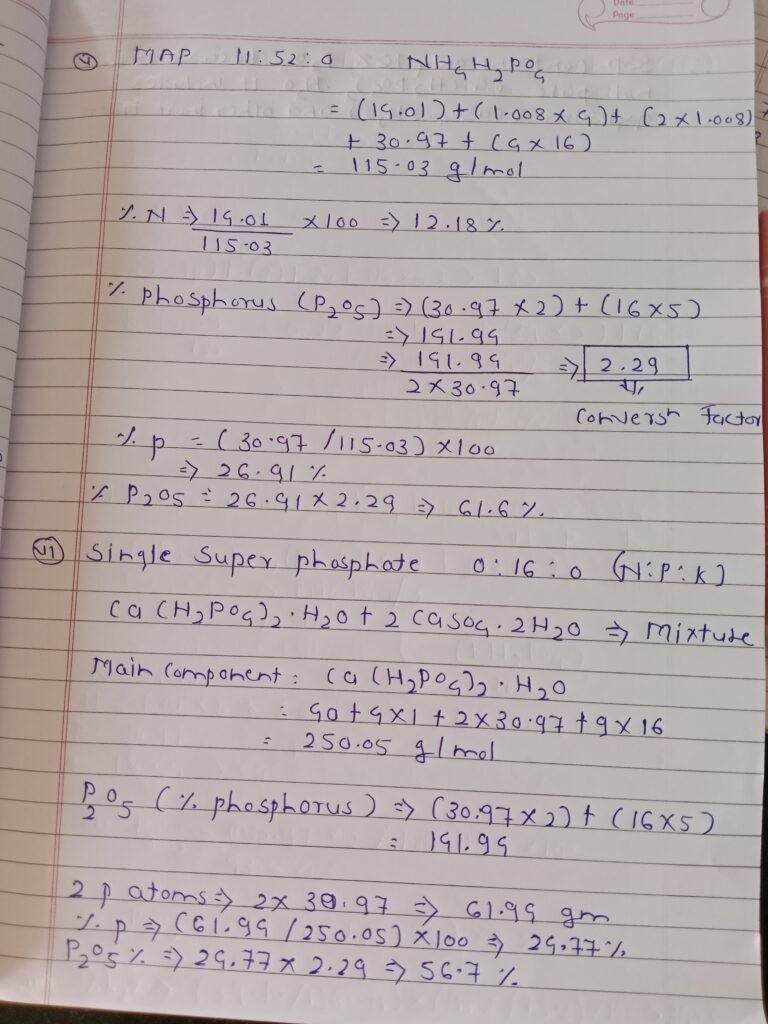
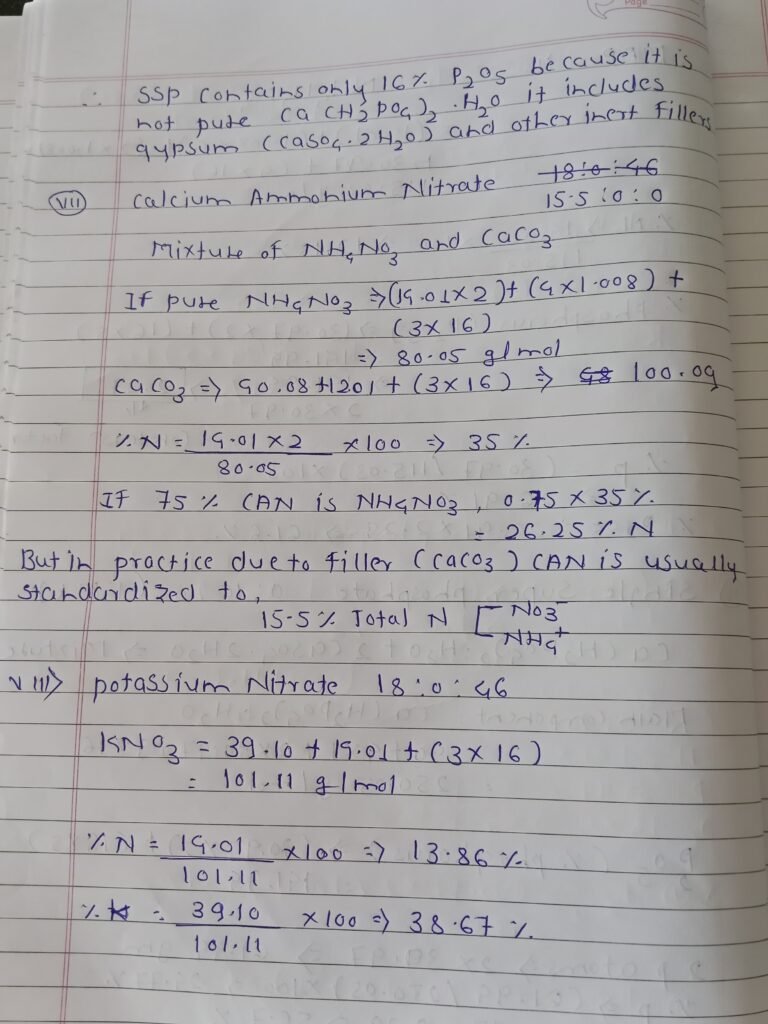
I calculate the amount of NPK in marketly available fertilizer. Corrected and detailed (past tense):I calculated the amount of Nitrogen (N), Phosphorus (P), and Potassium (K) present in commonly available fertilizers in the market. For each fertilizer, I identified its chemical formula and determined the molecular weight by summing the atomic weights of its elements.
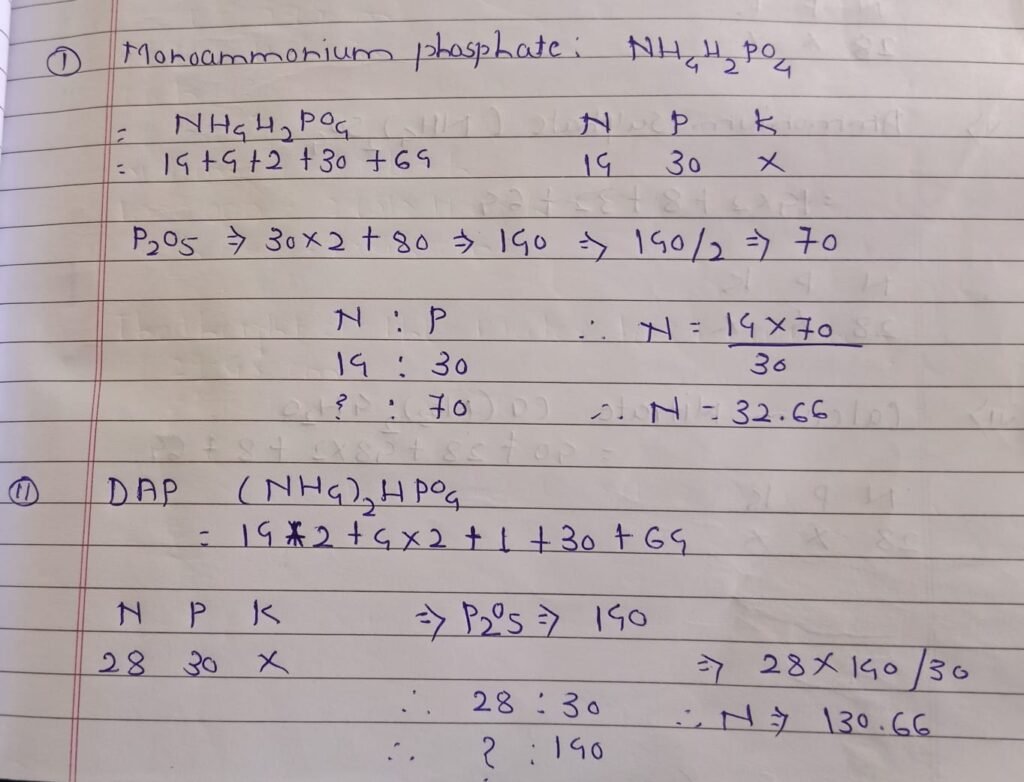
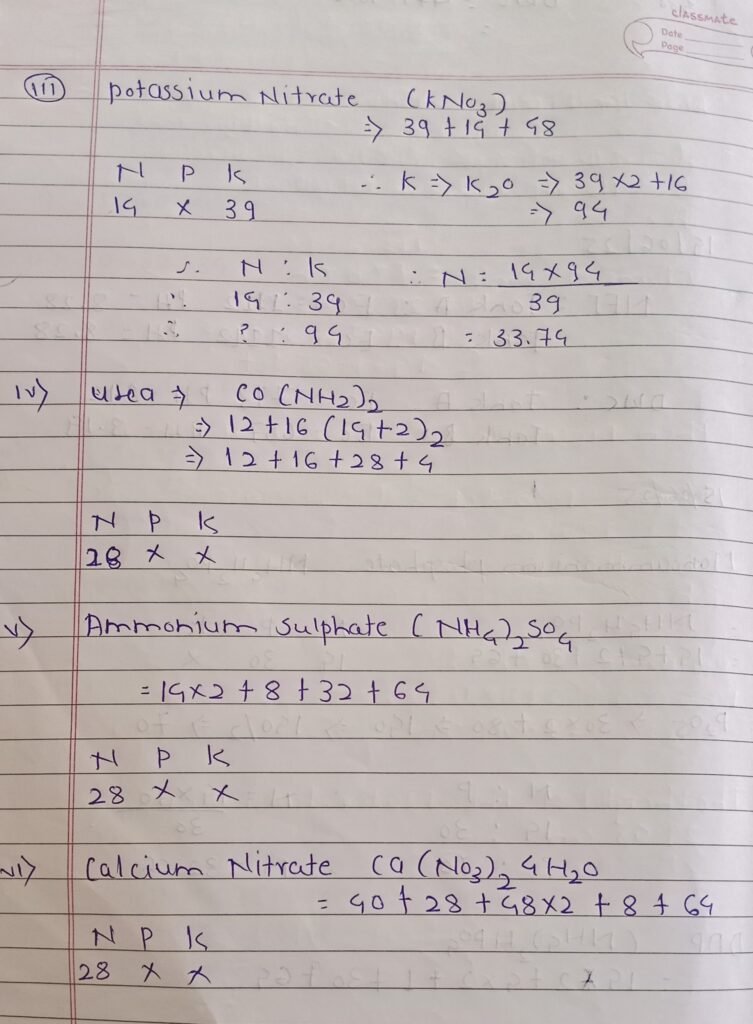
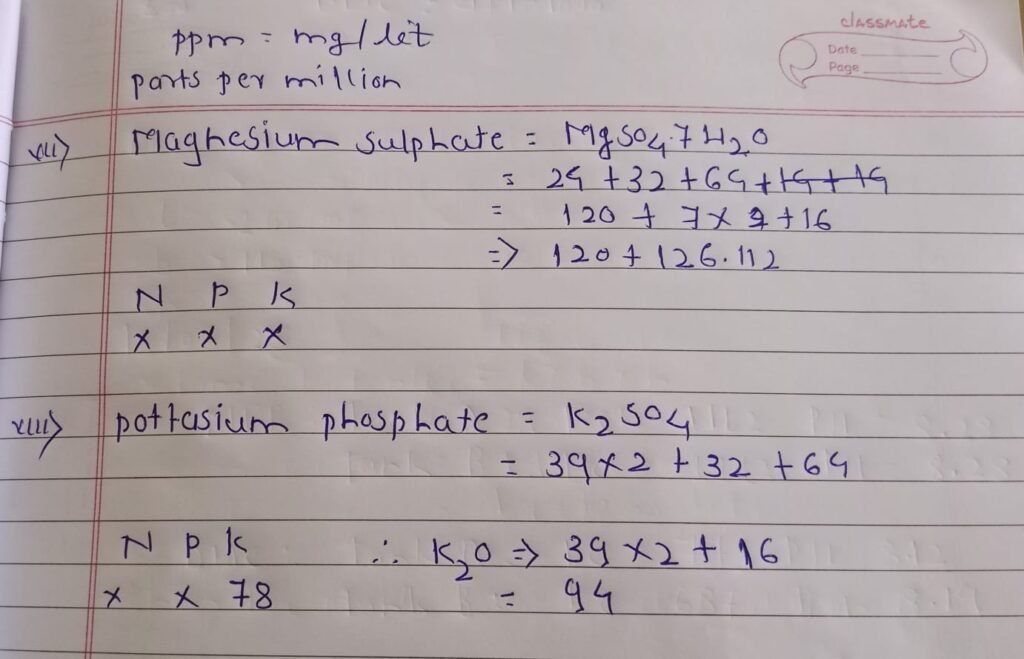
Based on this, I calculated the percentage of each nutrient (N, P, K) by using the fomula. I applied this method to fertilizers such as Potassium Nitrate (KNO₃), Urea [CO(NH₂)₂], Ammonium Sulphate [(NH₄)₂SO₄], and Calcium Nitrate [Ca(NO₃)₂·4H₂O]. These calculations helped me understand the exact nutrient contribution of each fertilizer.
conclusion
Hydroponics final trial note:
| Fertilizer name | Chemical formula |
| Urea | CO(NH2)2 |
| DAP | (NH4)2HPO4 |
| MAP | NH4H2.PO4 |
| Calcium Nitrate | CA(NO3)2.4H2O |
| Magnesium sulphate | MgSO4.7H2O |
| Potassium Nitrate | KNO3 |
| Ammonium Nitrate | NH₄NO₃ |
| Ammonium Sulphate | (NH₄)₂SO₄ |
| Zinc Sulphate | ZnSO₄·7H₂O |
