CONTENT
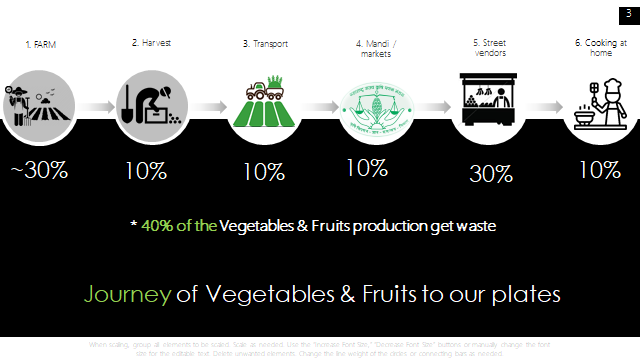
1.Journeyof Vegetables & Fruits to our plates
2.Introduction to the Problem & Need of Storage
3.Postharvest Physiological aspects
4.Defining the Perishability Limits / Conditions of shelf life
5.Factors need to be considered for the success of produce storage
6.Different Methods /ways to increase the shelf life of the perishables
7.Result of Shelf-life testing experiment
8.Intervention possibilities in the V&F supply chain
9. Design of one-stop solution
10. Estimation of Heat Load
1. Journeyof Vegetables & Fruits to our plates
2. Introduction to the Problem & Need of Storage
Since fruits and vegetables are highly perishable in nature, they tend to quickly deteriorate if not sold within a day or two. In such situations, there is a need for hygienic storage facilities to avoid quantitative and qualitative losses. Lack of permanent space for vending was a problem for 12% of the respondents.
Covid-19 has increased the uncertainty in the Supply and Demand of vegetables. Result of this the street vendors have increased the storage of vegetables. But the lack of cold storage has affected the quality of vegetables preserved. And this leading to wastage and reduction in the profits.
Street vendors with low income can’t afford to invest in cold storage.
Not having a cold storage facility, reduces the marketing time and vendors have to sell the vegetables & fruits at a lower cost at the end of the day.
It restricts the street vendors to buy vegetables in huge quantity at wholesale price.
Daily traveling to Sabji Mandi for fresh vegetables & fruits, rises the transportation cost.
Indian customers are very selective. They only take fresh vegetables and fruits.
Need of Storage
“Today, Cold storage for fruit and vegetables is as important as the water”.
Perishable commodities such as fruits and vegetables often require some storage: 1. To balance day-to-day fluctuations between harvest and sal 2. for long-term storage to extend marketing beyond the end of the harvest eason. 3. Prolongs usefulness and in some cases improve their quality. 4. The increase of fruit and vegetable production, owing to large acreage and high-yielding cultivars, requires sufficient storage space.
Cold storage for agriculture covers the 4 Sustainable Development Goals (SDG)

3.Postharvest Physiological aspects
A fruit or vegetable is a living, respiring, edible tissue that has been detached from the parent plant. Fruits and vegetables are perishable products with active metabolism during the postharvest period. The shelf life of fruits and vegetables can be extended by, in simple terms, retarding the physiological, pathological, and physical deteriorative processes (generally referred to as post-harvest handling) or by inactivating the physiological processes (generally referred to as food preservation by climate control).
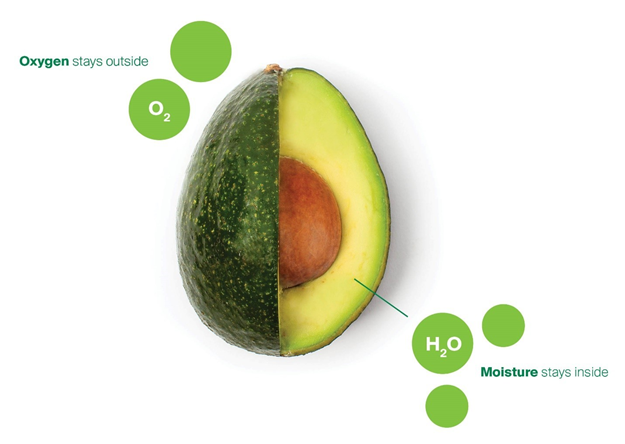
Following aspects that are to be minimized in fruits and vegetables for prolonged storage without a change in their original attributes.: 1.Respiration, 2.Transpiration, 3.Ethylene production
1.Respiration: Respiration involves the oxidation of energy-rich organic substrates normally present in cells such as starch, sugars, and organic acids, to simpler molecules (CO2 and H2O) with the concurrent production of energy and other molecules that can be used by the cell for synthetic reactions. The greatest yield of energy is obtained when the process takes place in the presence of molecular oxygen. Respiration is then said to be aerobic. If hexose sugar is used as the substrate, the overall equation can be written as follows:

This transformation actually takes place in a large number of individual stages with the participation of many different enzyme systems. The water produced remains within the tissue, but the CO2 escapes and accounts for part of the weight loss of harvested fruits and vegetables, a range of 3–5% of weight loss having been ascribed to respiration.
2.Transpiration:
Transpiration is the process by which fresh fruits and vegetables loose some of their water. All fruits and vegetables continue to lose water through transpiration after they are harvested, and this loss of water is one of the main processes that affect their commercial and physiological deterioration. If transpiration is not retarded, it induces wilting, shrinkage, and loss of firmness, crispness and succulence, with concomitant deterioration in appearance, texture, and flavor. Most fruits and vegetables lose their freshness when the water loss is 3–10% of their initial weight. As well as loss of weight and freshness, transpiration induces water stress, which has been shown to accelerate senescence of fruits and vegetables.
Conclusions
Because all fruits and vegetables are living tissues, they continue their life processes after harvest. If the storage conditions provided are not proper and adequate, certain undesirable changes may occur, which ultimately reduces quality and postharvest life.
Respiration, transpiration, and ethylene production are the most important postharvest physiological aspects that are to be minimized in fruits and vegetables for prolonged storage without a change in their original attributes.
The moisture content of fruits and vegetables is high, and weight loss during transportation and storage can be a serious economic factor, especially if the fruits are sold by weight. In most fruits and vegetables with 5–10% loss in moisture content, the products are visibly shriveled as a result of cellular plasmolysis.
The weight loss of fruits and vegetables in storage depends upon the size, maturity, composition and structure, air composition surrounding them, storage temperature, relative humidity, the velocity of air in the storage, the thickness of cuticles, size, and number of stomata and lenticels, and other factors. A practical way to minimize this effect is to cool the fruit quickly using suitable cooling methods such as convective air, hydro, vacuum, or evaporative cooling systems. Lettuce and other leafy vegetables are cooled by sprinkling cold water on them followed by vacuum treatment. Precooling chambers, cold storages, controlled atmosphere stores, and modified atmosphere packaging are a few of the facilities that are required for long shelf life with minimum deviation from original attributes for horticultural produce.
4.Defining the Perishability Limits / Conditions of shelf life
Definition: For the majority of foods and beverages in which quality decreases with time, it follows that there will be a finite length of time before the product becomes unacceptable. This time from production to unacceptability is referred to as shelf life.
| Sr. No | Parameters | Limits / Conditions |
| 1 | Transpirational loss | |
| 2 | Weight Loss | 5 to 10 % |
| 3 | Respiration Loss | |
| 4 | H2S test for V&F | |
| 5 | Visual Effect (Appearance) | |
| 6 | change in texture | |
| 7 | Aroma |
5.Factors need to be considered for the success of produce storage
1.Temperature: A wide temperature fluctuation can result in rapid weight and water loss depending upon the maturity of produce. Temperatures above optimum range, depending upon the product, will reduce storage life.
2.Relative humidity: Relative humidity should be maintained between 90% and 95%. The relative humidity below this range will result in a moisture loss from the produce.
3. Atmospheric composition: The atmospheric composition in a storage room is controlled by the addition of gases allowing the commodity to produce or consume gases or by physically or chemically removing undesirable gases from the storage room. Gases like CO, CO2, C2H4 (ethylene), N2 can be added.
4. Air movement: Air movement must be sufficient to remove respiration heat. Because it is essential that all parts of the room are subject to a uniform flow of air.
5. Light and other factors: Exposure of potato tubers to light in grocery stores can synthesize glycoalkaloids (solanine and chaconine), which are toxic to humans.
6. Different Methods/ways to increase the shelf life of the perishables
A. Chemical Treatment: 1.Sodium hypochlorite 2.Ozone 3.UV 4.H2O2 5.Vinegar 6.Electrified Water 7.Brine Treatment
B. Packing: 1.Permeable polythene Bag 2.Mylar Bag 3.Corrugated Box 4.Corrugated Box+ Foam Bag 5.Paper Bag 6.Foil Coating Bag
C. Cooling: 1.Heat Transfer Media 2.Evaporative Cooling 3.Geothermal 4.VCC 5.VAC
D. Control Atmospheric Conditions: 1.Equilibrium Atmospheric packing 2.Vacuum Packing 3.Gas Regimes 4.Energy Transfer barrier 5.Additive a. Moisture absorbent 6.Additive b. Oxygen Absorber
A. Methods of Chemical Treatment
| Sr. No | Methods of Chememical treatment | Water used | Handling | Cost | Availability | Effectiveness from Literature | Effectiveness from Experiment |
| 1 | Sodium hypochlorite | Yes | 3 | 4 | 4 | 3 | |
| 2 | Ozone | Yes | 1 | 4 | 4 | 4 | |
| 3 | UV | No | 1.5 | 4 | 4 | 3.5 | |
| 4 | H2O2 | Yes | 4 | 2 | 2 | 4 | |
| 5 | Vinegar | Yes | 2 | 1.5 | 2.5 | 3 | |
| 6 | Electrified Water | Yes | 4.5 | 5 | 5 | 4.5 | |
| 7 | Brine Treatment | Yes | 2 | 5 | 5 | 2 |
B. Packing
| Sr. No | Ways of Paking | Suitable for | Handling | Cost | Availability | Effectiveness from Literature | Effectiveness from Experiment |
| 1 | Permiable polythene Bag | All | 4 | 5 | 5 | 4.5 | |
| 2 | Mylar Bag | Most of V&F | 3.5 | 1 | 4 | 3 | |
| 3 | Corrugated Box | All | 5 | 3 | 5 | 3.5 | |
| 4 | Corrugated Box + Foam Bag | All Fruits | 5 | 1 | 3 | 4.5 | |
| 5 | Paper Bag | All | 4 | 5 | 5 | 4.0 | |
| 6 | Foil Coting Bag | All | 5 | 4 | 4 | 3.5 |
C. Cooling
| Sr. No | Methods of Cooling | Temprature rang Achived | Relative Humidity | Cost | Availability | Adaptive feasibility | Effectiveness from Literature | Effectiveness from Experiment | |
| 1a | Heat Transfer Media | Hydro Cooling | 4.5 | 5 | 4 | 5 | 2 | 3.5 | |
| 1b | Air Cooling | 5 | 3 | 4.5 | 5 | 5 | 3.5 | ||
| 2a | Evaporative Cooling | Fan Pad | 3.5 | 4.5 | 3 | 4 | 4 | 3.5 | |
| 2b | Mitti Cool | 2.0 | 3 | 4.5 | 3 | 4 | 2 | ||
| 2c | Water Sprinkling / Fog | 3.8 | 4.5 | 4.0 | 4.0 | 4.0 | 4 | ||
| 2d | Cooling Towers | 3.0 | 3.5 | 4.0 | 4.0 | 3.5 | 3.5 | ||
| 3 | Geothermal Cooling | 2.5 | 2.5 | 4 | 2 | 2 | 3 | ||
| 4a | VCC | DC Compressor | 5 | 5.0 | 2 | 5 | 5 | 5.0 | |
| 4b | AC Compressor | 5 | 5.0 | 2.0 | 5 | 5 | 5.0 | ||
| 5a | VAC | Above Zero degre | 5 | 4.5 | |||||
| 5b | Sub Zero Degre | 5 | 4.5 |
D. Control Atmospheric Conditions
| Sr. No | Methods of Control Atmospheric Conditions | Temperature rang Achieved | Relative Humidity | Cost | Availability | Effectiveness from Literature | Effectiveness from Experiment | |
| 1 | Equilibrium Atmospheric packing | O2, CO2 & C2H4 | ||||||
| 2 | Vacuum Packing | |||||||
| 3 | Gas regimes | Argon, Nitrogen, CNG, Lean Air & Bio-Gas | ||||||
| 4a | Energy Transfer barrier | Equilibrating | ||||||
| 4b | Adiabatic | |||||||
| 5 | Additive a. Moisture absorbent | Silica gel | ||||||
| 7 | Additive b. Oxygen Absorber | Iron powder |
Result of Comparative analysis
| Sr. No | Methods of Chemical treatment | |
| 1 | Sodium hypochloride | 96 |
| 2 | Ozone | 99 |
| 3 | UV | 96 |
| 4 | H2O2 | 78 |
| 5 | Vinegar | 61.5 |
| 6 | Electrified Water | 129 |
| 7 | Brine Treatment | 99 |
| Sr. No | Ways of Packing | |
| 1 | Permeable polythene Bag | 128 |
| 2 | Foam Bag | 83 |
| 3 | Mylar Bag | 71 |
| 4 | Corrugated Box | 104 |
| 5 | Paper Bag | 123 |
| 6 | Foil Coting Bag | 107 |
| Sr. No | Methods of Cooling | ||
| 1a | Heat Transfer Media | Hydro Cooling | 191.0 |
| 1b | Air Cooling | 216.5 | |
| 2a | Evaporative Cooling | Fan Pad | 181.5 |
| 2b | Mitti Cool | 151.5 | |
| 2c | Water Sprinkling / Fog | 197.7 | |
| 2d | Cooling Towers | 174.5 | |
| 3 | GeoTharmal Cooling | 133.0 | |
| 4a | VCC | DC Compressor | 218.0 |
| 4b | AC Compressor | 218.0 | |
| 5a | VAC | Above Zero degre | 0.0 |
| 5b | Sub Zero Degre | 0.0 |
From this analysis, we found that VCC Cooling and MAP packing are the best among them all.
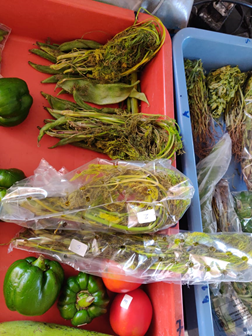
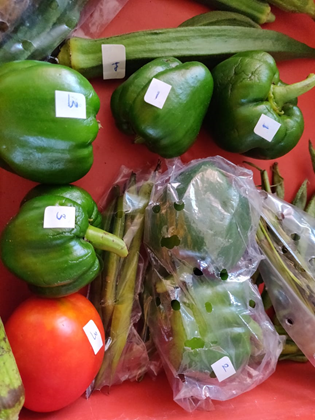
7.Result of Shelf-life testing experiment


Observations:
- Weight loss in group [A] (i.e. in permeable plastic bags) is less compare to group [B] and group [C].
- Weight loss in group [B] and group [C] is almost same.
- After 48 hours of harvest bacterial growth was seen on leafy vegetables.
Limitations of Experiment:
- A very small quantity of vegetables was tested.
- Bacterial growth was not observed under a microscope.
- SoP was not created.
8. Planing of 2nd Experiment:
| Methods of enhancing shelf life | Sr. NO | Combination | ||
| A | No intervention of any method | 1 | A | |
| B | Permeable plastic bags @10% | 2 | B | |
| C | Sodium hypochlorite | 3 | C | |
| D | Cooling @7deg.C | 4 | D | |
| 5 | B+C | |||
| 6 | C+D | |||
| 7 | B+D | |||
| 8 | B+C+D |
9. Designing of One-stop Solution:
The solution is targeted at the street vendors. Street vendor with a one-stop solution. He needs vegetables of 150 to 200kg.
| A | Vegetables | 132 |
| B | Leafy Vegetables | 6.5 |
| C | Non-perishable | 47 |
| Total weight | 185.5 |
A] Vegetables
| Quantities (kg) | Perches Price (kg) | Sale Price (kg) | Amount | Profit % | |||
| 1 | Tomato | Tamatar | 20 | 10 | 20 | 400 | 50% |
| 2 | lady finger | Bhindi | 15 | 25 | 60 | 900 | 58% |
| 3 | Cluster beans | Gawar | 10 | 25 | 60 | 600 | 58% |
| 4 | Brinjal 1 | Bengan 1 | 5 | 10 | 30 | 150 | 67% |
| 5 | Brinjal 2 | Bengan 2 | 5 | 10 | 30 | 150 | 67% |
| 6 | Capsicum | Shimla Mirch | 10 | 25 | 60 | 600 | 58% |
| 7 | Green chilli | Hari mirch | 5 | 10 | 40 | 200 | 75% |
| 8 | Cucumber | Kakdi | 10 | 25 | 60 | 600 | 58% |
| 9 | Carrot | Gajar | 5 | 25 | 60 | 300 | 58% |
| 10 | Radish | Muli | 5 | 25 | 60 | 300 | 58% |
| 11 | CauliFlower | Phool-gobi | 5 | 20 | 40 | 200 | 50% |
| 12 | Cabbage | Pata-gobi | 5 | 20 | 40 | 200 | 50% |
| 13 | Bitter gourd | Karela | 5 | 10 | 20 | 100 | 50% |
| 14 | Ridge gourd | turee/Dodka | 5 | 10 | 20 | 100 | 50% |
| 15 | Calabash/Bottle gourd | Lauki | 5 | 10 | 20 | 100 | 50% |
| 16 | Pumpkin | Kaddu | 2 | ||||
| 17 | Drumsticks | 1 | |||||
| 18 | lemon | Nimbu | 3 | ||||
| 19 | Ivy gourd | Tindora | 3 | ||||
| 20 | French beans | Faras bean | 3 | ||||
| 21 | Flat green beans | Sem ki phali, papdi | 2 | ||||
| 22 | Peas | mutter | 3 | ||||
| Total | 132 | 260 | 620 | 4900 | 58% |
B] Leafy Vegetables:
| Quantities (per piece) | Perches (per piece) | Sale Price (per piece) | Amount | Profit % | |||
| 1 | Curry leaves | Kadipata | 10 | 5 | 10 | 100 | 50% |
| 2 | Coriander | Dhaniya/Kothimbir | 15 | 5 | 10 | 150 | 50% |
| 3 | Fenugreek leaves | Methi | 15 | 5 | 10 | 150 | 50% |
| 4 | Dill | Shepu | 10 | 5 | 10 | 100 | 50% |
| 5 | Palak | Palak | 15 | 5 | 10 | 150 | 50% |
| Total | 65 | 25 | 50 | 650 | 50% |
C] Non-perishable:
| Quantities (kg) | Perches (per piece) | Sale Price (per piece) | Amount | Profit % | |||
| 1 | Onion | Pyaaz | 20 | 20 | 40 | 800 | 50% |
| 2 | Potato | Aloo | 20 | 20 | 40 | 800 | 50% |
| 3 | Garlic | Lahsun | 3 | ||||
| 4 | Ginger | Adrak | 2 | ||||
| 5 | Sweet potato | Shakarkandi | 2 | ||||
| Total | 47 | 40 | 80 | 1600 | 50% |
10. Estimation of Heat load on system
Different Heat Sources
The air-conditioning systems used for conditioning storage houses have to carry two types of loads known as sensible heat loads and latent heat loads.
A] Sensible heat loads:
- Heat flow through exterior walls, ceilings, doors due to temp difference.
- Loads due to solar radiation
- Heat from the produce
- Commonly used equipment like tray.
- Infiltrated air from the outside due to cracks and frequent opening of door
- Miscellaneous: like transmission duct
B] Latent heat loads:
- Air entering AC room from infiltration
- LH from the produce
- Stored material
- Moisture passing directly into the air-conditioned space through permeable walls where the water vapor pressure is higher
11. Action Plan
| Sr. No | Task | Oct-20 | Nov-20 | Dec-20 | Jan-21 | Feb-21 | Mar-21 |
| 1 | Executing the experiments and collecting data | 1 | |||||
| 2 | Designing of Cooling chamber & Cart | 1 | |||||
| 3 | Hardware prototype 1 Implementation | 1 | 1 | ||||
| 4 | Testing at VA | 1 | |||||
| 5 | Firm Registration | 1 | |||||
| 6 | Changes in Hardware prototype 1 | 1 | |||||
| 7 | Testing at Vendors Place | 1 | |||||
| 8 | Investor pitching | 1 | 1 |
Action plan for November month
| Sr. No | Activities | Indicators | Result | Time |
| A. | Starting the Shelf life testing experiment 2 | Comparative analysis of diff. methods | 1st week | |
| 1 | Planing of shelf life testing experiment | Submition of sheet | ||
| 2 | SoP for shelf life testing experiment | Submition of doc | ||
| 3 | Precrument of Vegetables of 10 to 12 different verities | |||
| 4 | Preperation of micro- environment control chember | |||
| 5 | Measurment devices needed | |||
| B | Load estimation of cold chember | Size/capacity of Compressor , Solar PV & Charge controller | 1st week | |
| 1 | Reading | Submition of doc | ||
| 2 | Calculation | Submition of sheet | ||
| D | CAD design of cold chember | 4th week | ||
| 1 | Primery design | Submition of doc | ||
| 2 | Secondary design | Submition of doc | ||
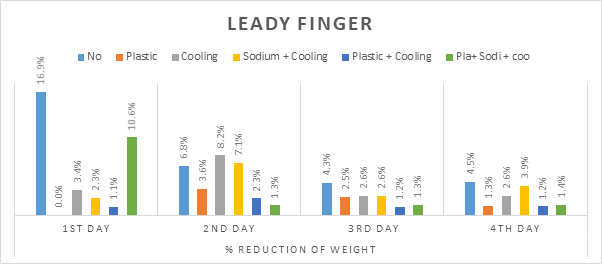
11. Result and Analysis of Experiment Set up 2
In the experiment 2 nine different vegetables were taken and 8 different groups. Daily weight reduction and visual inspection of texture and bacterial growth was observed. Here is the result from the experiment 2.
.
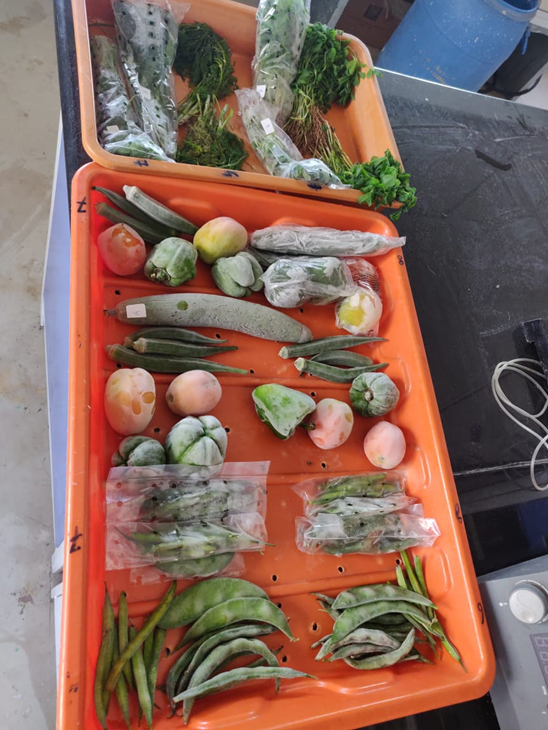


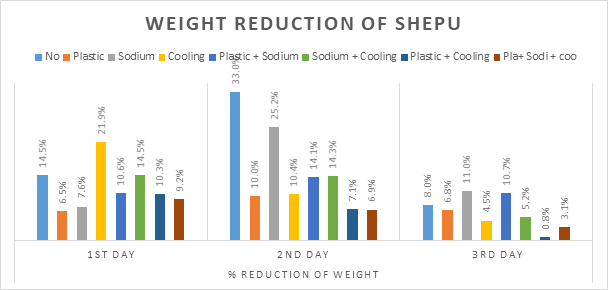

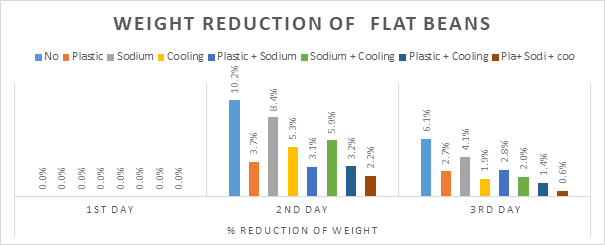
A] Observation:
Weight reduction in leafy vegetables is more.
Sodium hypochlorite treatment does not have any impact on weight reduction. It is effective when combined with cooling.
The most effective results are seen in the cooling with permeable plastic packing.
For Gosavl permeable plastic packing is very effective.
For Dill (Shepu) with only Sodium hypochlorite treatment, a stinky smell was observed.
B] Limitations:
It took a longer time (a day) to set up the experiment. Hence the result of day one is not showing any patterns.
Temp and humidity were not recorded frequently.
The result are taken in the month of November when the ambient temperature is 27 deg.C
12. Result and Analysis of Experiment Set up 3
In the experiment 3 eleven different vegetables were taken and distributed in 6 different groups. Daily weight reduction and visual inspection of texture and bacterial growth was observed. Here is the result from the experiment 3. For the cooling Evaporative cooler was used.

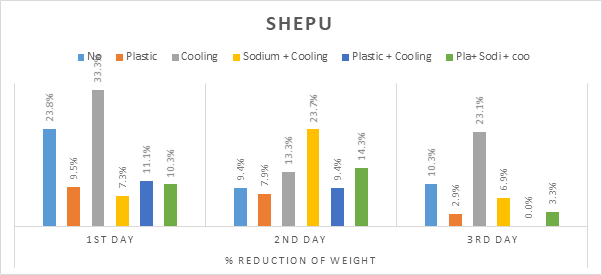


A] Observation:
Methi and Palak are more perishable. Bacterial growth as well as weight reduction is very high.
Most effective result are seen in the cooling with permeable plastic packing.
Here in this experiment 3 only permeable plastic packing shows better results than the cooling. Because the chamber temp was at ~20 deg.C
B] Limitations:
It took longer time (a day) to set up the experiment. Hence the result of day one are not showing any patterns.
Temp and humidity were not recorded frequently.
Result are taken in the month of November when ambient temperature is 27 deg.C
Performance of EC:


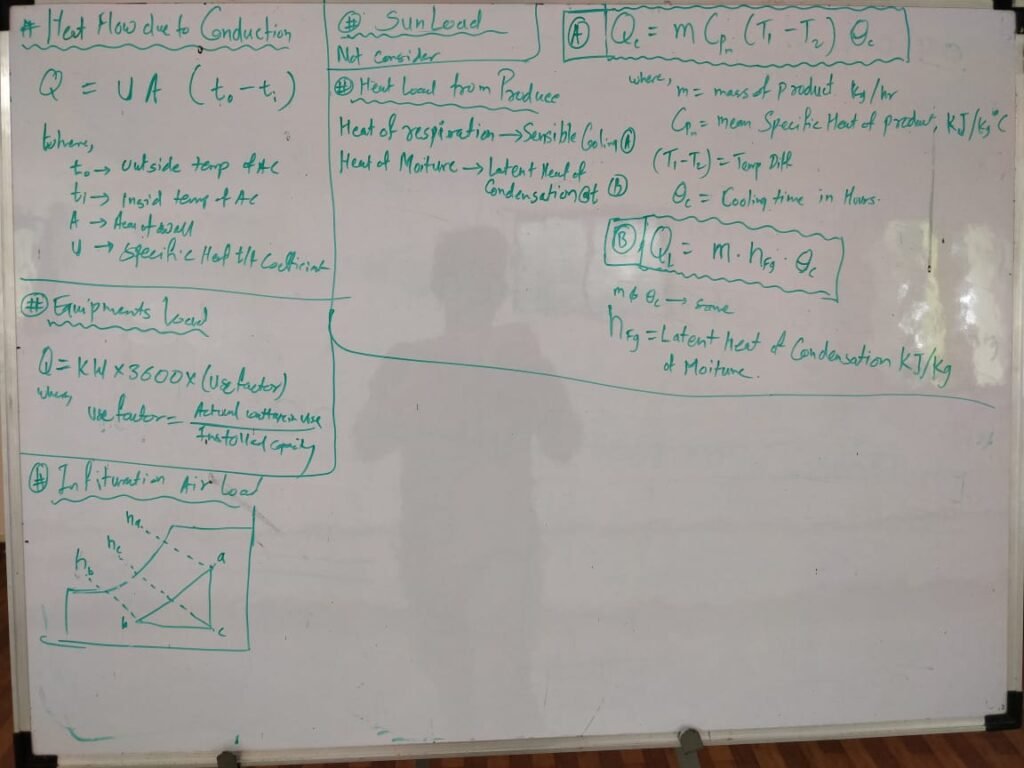
13. Estimation of Cooling Load Heat flow due to Conduction
Heat flow by conduction is calculated by the following equation
Q=UA(t_o-t_i)
Where,
U= Specific heat transfer coefficient
A= Area of wall
t_o= Outside temperature
t_i= Inside temperature Sun Load
Sun load through glass is not considered in this book because of limited use of glass panels for doors, windows, and ventilation in cold storage for horticultural produce. Heat flow from Produce
The heat loads added by the produce to be stored constitute a major portion of the cooling load. Generally the produce is precooled to remove the field heat and then transported to cold storage for storage at the desired temperature and relative humidity (RH). The produce so loaded into cold storage still respire and transpire, which means that heat and moisture are released from the produce. The respiration heat and latent heat of condensation of moisture are to be removed from the cold storage. The heat of respiration is removed by sensible cooling, and heat of moisture is removed by latent heat of condensation at that temperature. The load of sensible cooling and latent heat of condensation are calculated by the following formulae.
A] Sensible cooling load is given by:
Q_C=m.C_(P_m ) (T_1-T_2 ).Q_c
Where,
m= mass of the product kg/hr
C_(P_m )= mean specific heat of the product kJ/kg. ℃
(T_1-T_2 )= temperature difference
Q_c= Cooling time in hours
B] Latent heat load is given by:
Q_L=m.h_(f_g ) .Q_c
Where,
m & Q_c= mass of the product kg/hr
h_(f_g ) = Latent heat of the condensation kJ/kg. ℃
| Sr. No | Different Heat Source | kWh/day | % of total |
| 1 | Transmission Load | 3.65 | 67.91% |
| 2 | Product Load | 0.83 | 15.48% |
| 3 | Intarnal Load | 0.04 | 0.70% |
| 4 | Equipment Load | 0.42 | 7.82% |
| 5 | Infiltration Load | 0.44 | 8.10% |
| Total Cooling Load | 5.37 | 100.00% | |
| Safety Factor | 1.2 | ||
| Total Cooling Load | 6.45 |
Transmission Load
Q= U*A*(Temp_out - Temp_in)*24 ...Wh/day| Transmission Load | |||
| Q= U*A*(Temp_out – Temp_in)*24 | …Wh/day | ||
| 1 | Temp_Out = Ambient Air temp | 35 | deg.C and @ 55%RH |
| 2 | Temp_in = Internal Air temp | 10 | deg.C and 95% RH |
| 3 | Floor Temp | 20 | deg.C |
| 4 | Insulation used for Sides (Polyurethane ) | 80 | mm Thick |
| 5 | Insulation used for Front Side (polythene curtains ) | 4 | mm Thick |
| 6 | U value for Sides | 0.28 | W/m.2.K |
| 7 | U value for Front Side | 5.6 | W/m.2.K |
| a | Width | 0.6 | meters |
| b | Length | 1.5 | meters |
| c | High | 1 | meters |
| 8 | Areas | 0.9 | m.sq |
| A | Side wall A Push | 0.6 | |
| B | Side wall B Pull | 0.6 | |
| C | Side wall C Back | 1.5 | |
| D | Side wall D Front | 1.5 | |
| E | Roof | 0.9 | |
| F | Floor | 0.9 | |
| 9 | Sum of Area’s A+B+C+ E | 3.6 | |
| 10 | No of hour in a day | 12 | |
| 11 | Transmission Load due to Sides A+B+C+ E | 302.4 | 10.60% |
| 12 | Transmission Load due to Floor | 30.24 | 1.06% |
| 13 | Transmission Load due to Front side | 2520 | 88.34% |
| 14 | Total Transmission Load during Day time | 2852.64 | Wh/half day |
| 15 | Total Transmission Load during Day time | 2.85264 | kWh/half day |
| Total Transmission Load during Day time | 3.64896 | kWh/day |
Total Transmission Load during Day time 3.64896 kWh/day


Internal Load 
| Internal Load | |||
| A | Hand picking the vegi | Heat given OFF by hand picking the vegetables from the cold room | |
| Q= [Hands*Time*Heat]/1000 | …kWh/day | ||
| 1 | Hands = No of Hands | 30 | |
| 2 | Time = working hours | 0.033 | hours |
| 3 | Heat = Heat loss per Hand | 5.4 | W/hours |
| 4 | Conversion W to kW | 1000 | |
| 5 | Hand picking Load due to respiration | 0.01 | kWh/day |
| B | Lighting | Heat give Off by Lamp inside | |
| Q= [Lamps*Time*0.2*Wattage]/1000 | …kWh/day | ||
| 6 | Lamps = No of Lamps | 4 | |
| 7 | Time = working hours per day | 4 | hours |
| 8 | Watage = rating of lamp | 10 | W/hours |
| 9 | Conversion W to kW | 1000 | |
| 10 | Lighting Load due to respiration | 0.03 | kWh/day |
| 11 | Total Internal Load | 0.04 | Wh/day |
Equipment Load | Equipment Load | |||
| A | Fan Motor | Heat given OFF by the Fan motors | |
| Q= [Fans*Time*Wattage]/1000 | …kWh/day | ||
| 1 | Fans = No of Fans | 1 | |
| 2 | Time = working hours | 14 | hours |
| 3 | Watage = rating of Fan | 30 | W/hours |
| 4 | Conversion W to kW | 1000 | |
| 5 | Fan Load due to exchange | 0.42 | kWh/day |
| B | Defroster (Electrical) | Heat given OFF by Heating element | |
| Q= [Power*Time*Cycles*effi]/1000 | …kWh/day | ||
| 6 | Power = Defrosting element Power | 0 | kW |
| 7 | Time = Defrosting time in hours | 0.5 | hours |
| 8 | Cycles = Defrosting Cycles | 3 | W/hours |
| 9 | Effi = Defrosting efficiency | 30 | |
| 10 | Defroster Load due to respiration | 0.00 | kWh/day |
| 11 | Total Equipment Load | 0.42 | Wh/day |
Air Infiltration Load Heat gained from the heat exchanges through open door| Air Infiltration Load | Heat gained from the heat exchanges through open door | ||
| Q=Changes*Volume*Energy*[Temp_out – Temp_in]/3600 | |||
| …Wh/day | |||
| 1 | Change=Storage air changes per day | 30 | |
| 2 | Volume = Volume of the cold storage | 0.9 | m^3 |
| a | Width | 0.6 | meters |
| b | Length | 1.5 | meters |
| c | High | 1 | meters |
| 3 | Energy = Energy per Cubic meter of air | 2 | kJ/m^3 |
| 4 | Temp_Out = Ambient Air temp | 30 | mm Thick |
| 5 | Temp_in = Internal Air temp | 1 | W/m.2.K |
| 6 | To convert from kJ to kWh | 3600 | |
| 12 | Total Infiltration Load | 0.44 | kWh/day |
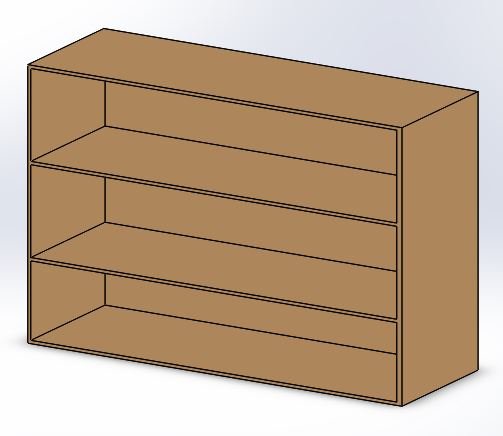
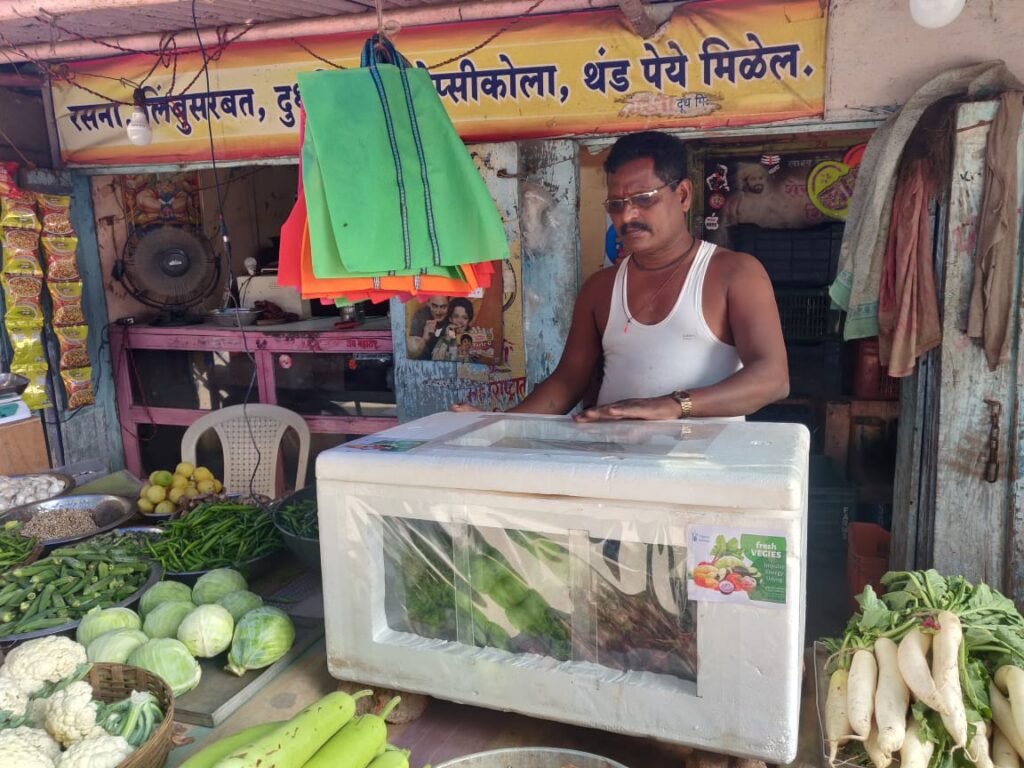
Intervention of Tharmocol box
The intervention of the tharmocol box is done with the vegetable vendors at the two locations. One near the bus stand of Pabal village and another at the Chaufula, pimple-Jaktap. As shown in the figure the box is made transparent so that the vegetables kept inside are visible. Cooling is provided with cold water bottles and air circulation is done by a small fan. The fan is running on solar. From both, the vendor feedback is they need more size like a cupboard.


The intervention of MAP bag at Lab
MAP (Modified Atmospheric Packaging) bags were tested against the normal plastic bags and without any intervention vegetables. The performance of the MAP bag was better among the three. They can keep the leafy vegetables fresh for more than three days at 25 deg.C
Hence some samples were given to the 15 vegetable vendors in the area Viman-Nagar, Kothrud and Kharadi of Pune city.


Intervention with the Street Vendor at Kothrud
The purpose of this intervention is:
- To understand the response of vegetable buyer for the MAP bags and finding out the financial feasibility of it.
- Daily money flow of the street vendors.
- In order to make the design more valuable and appealing for street vendors.
Intervention:
We brought some leafy vegetables from the Gultekdi market yard and packed them in the MAP bags. Vegetables that packed are as follow Methi 4, Dhaniya 3, Pudina or Mint 4, Tondli 2 bags, Cauliflower 1 pies

Observations:
Response at this location was not satisfying. We were not able to sale any commodity with the MAP bags on day one. On day two we sold 70% of the comedies with MAP bag even though the cost of it was same as that of without the MAP bag.
Primary Design of Cold Chamber