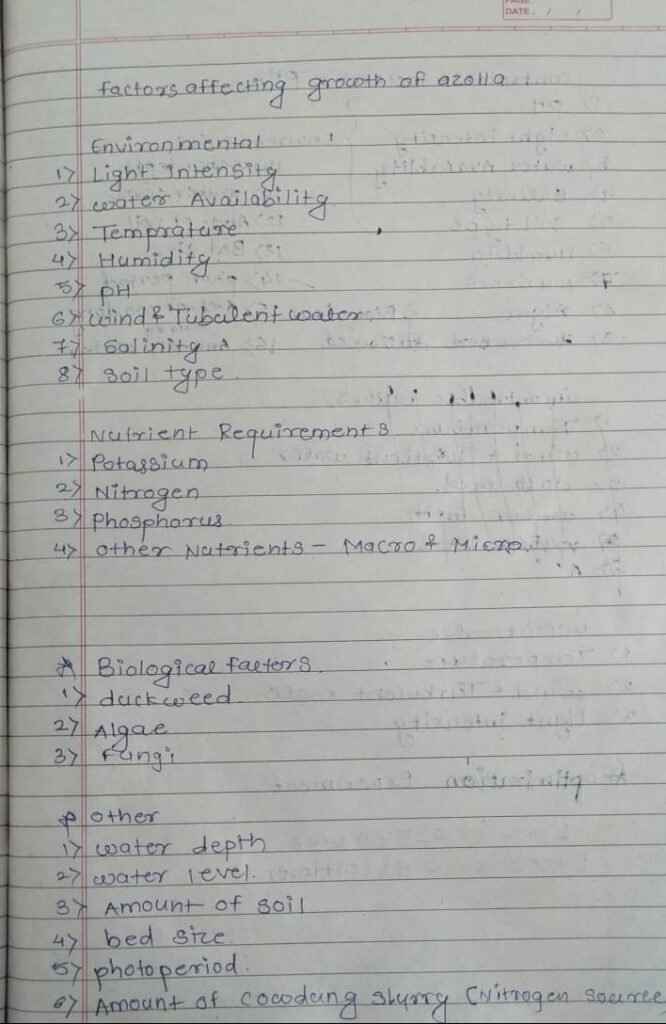
Introduction :- Recently Azolla production was very slow because of certain factors like biological and environmental, which includes duckweed, temperature, Humidity, pH and light exposure etc. they can vary depending on the seasons as well. we need to focus on the factors that are affecting and factors that are likely effective in Azolla production.
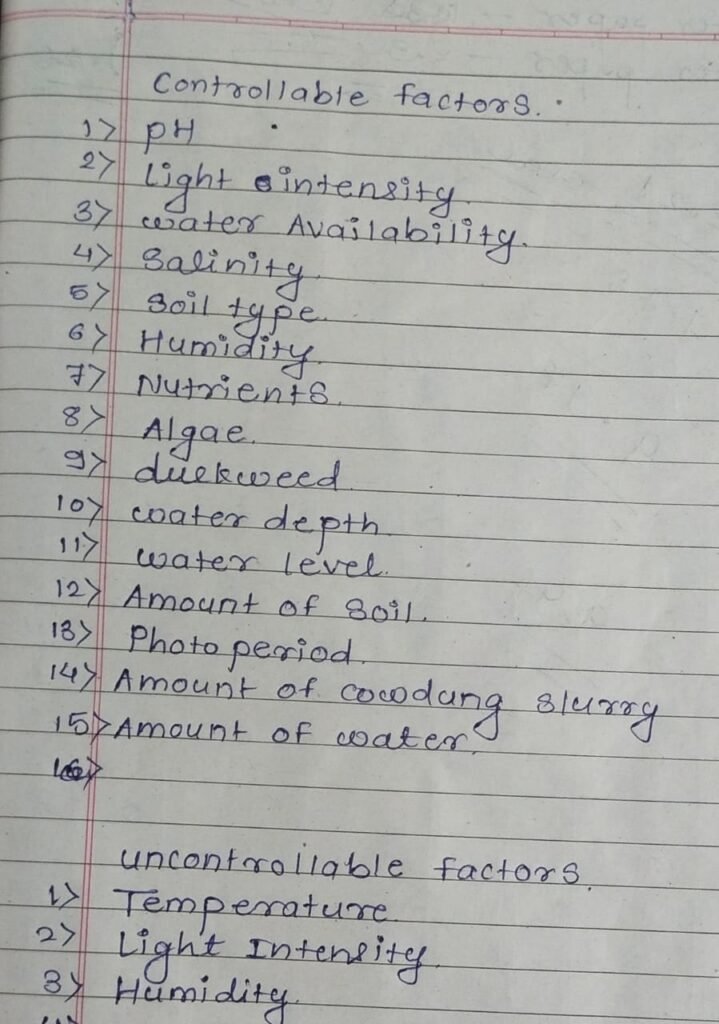
Objectives : We are going to consider factors that are controllable like pH, water level, amount of soil, photoperiod, soil level, agitation, addition of cow dung slurry, addition of KSB and PSB. So we decided to make a SOP for Azolla cultivation to ensure the maximum production of Azolla.
28 February 2025
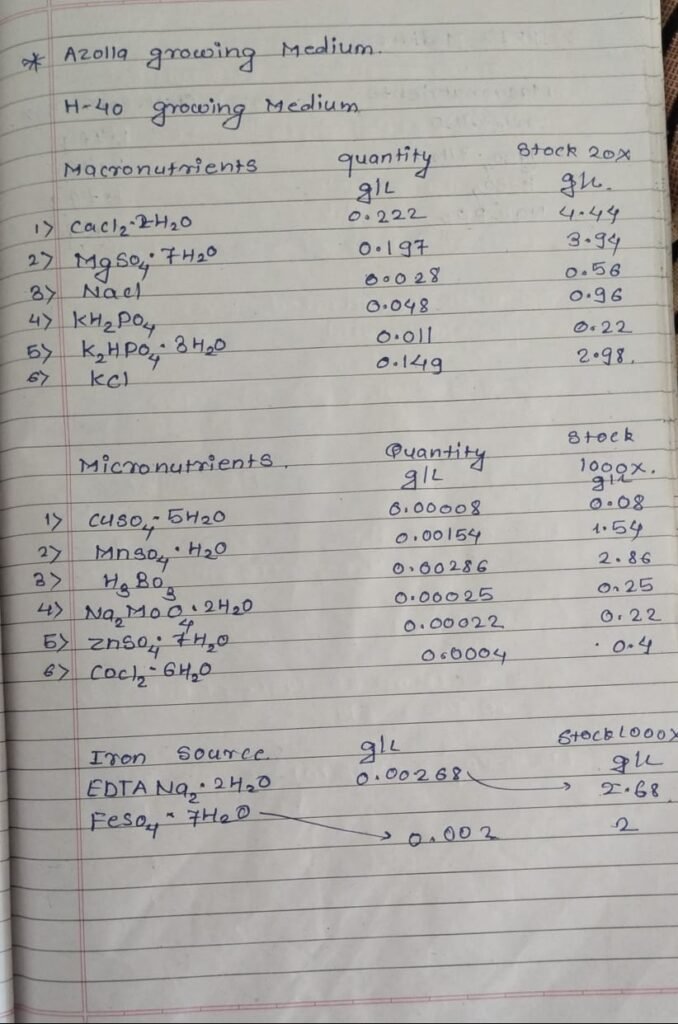
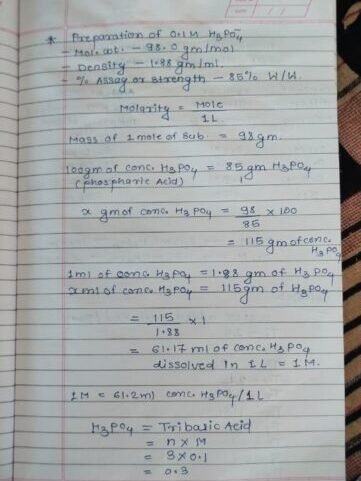
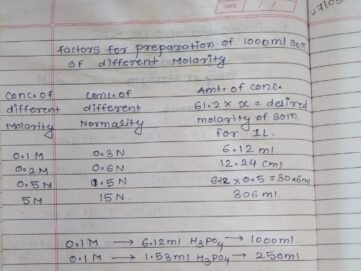
Abhijit Sir and I had a meeting with Dixit Sir regarding the issues we were facing with Azolla growth. Pranit had brought Azolla from BAIF, and it was inoculated in a new bed. At that time, I was monitoring the bed. Based on some research papers, I prepared stock solutions of macronutrients, micronutrients, and an iron source, and added them to the bed after inoculation. Additionally, I adjusted the pH of the water using 0.1M Phosphoric Acid.
After this treatment, we observed significant growth of Azolla. I believed that the improved growth was mainly due to the addition of macronutrients, micronutrients, and pH adjustment. However, Sir was firm in his opinion that the key factor was the acidic pH, around 6.0.
Following this discussion, we decided to conduct a proper experiment to identify the factors influencing Azolla growth. We also discussed the Design of Experiments (DOE), its types, and how we could apply them to our stud
6 March 2025
After I returned from my three-day leave, Abhijit Sir informed me that he had discussed with Dixit Sir and they decided on two experimental factors: pH and sunlight. On that day, Abhijit Sir explained the Design of Experiments (DOE) to me. He instructed me to set up four trays — two placed in a fully shaded area and two in full sunlight throughout the day. Each pair was to be treated with different pH levels: one tray with an acidic pH of 6.5, and the other with a basic pH of 8.5.
Then, I prepared two beds, each with 1 kg of soil. Water was added to a level 5 centimeters above the soil, and 500 grams of cow dung slurry was mixed in.
Importance of each material used in Azolla bed
- Soil – provides nutrients to Azolla like Potassium, Phosphate, etc.
- cowdung slurry – Phosphorus and Potassium is not in dissolved form in soil , its difficult to get that to Azolla. Cowdung slurry bacteria those ability to make this undissolved form of P and K into dissolved form which make easy to take azolla plant for their growth.
- Water- Azolla is a water based crop, without water it stop its growth.
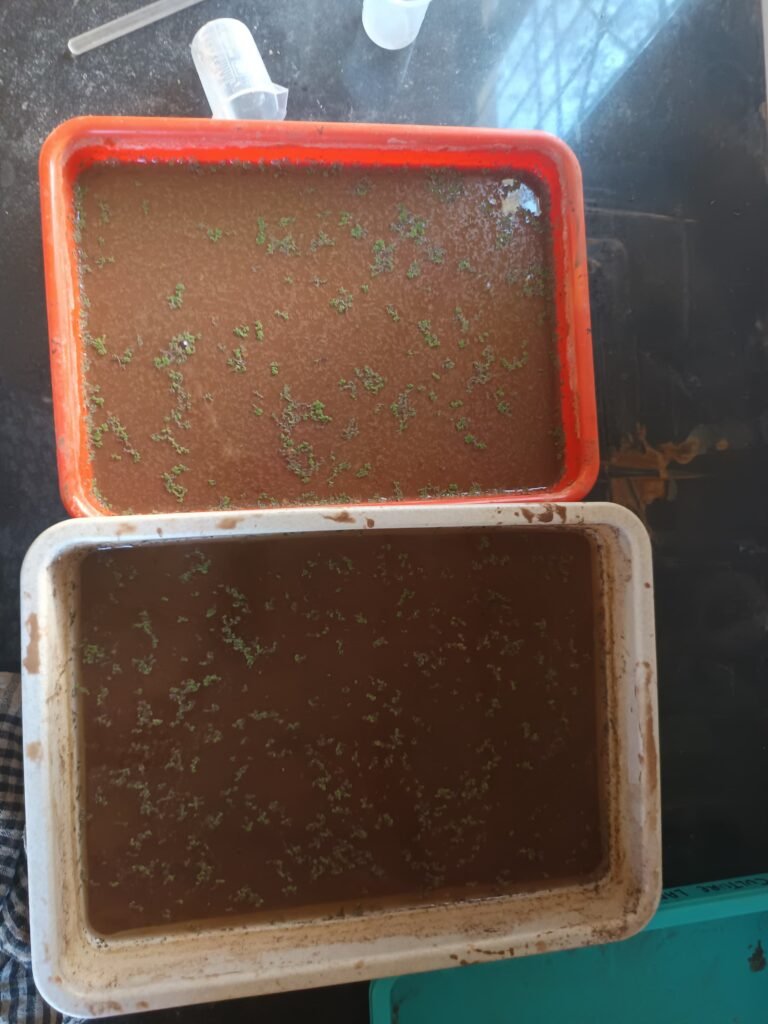
Prepared following table for better understanding, taken two types of Tray for dual understanding
- These two tray placed at No sunlight area to check weather sunlight is crucial factor for growth.
Table No. 1 – No Sunlight
| Parameters | Orange Tray | White Tray |
| Size | 0.3m * 0.37m | 0.34m * 0.42m |
| pH | 6.5 (Acidic) | 8.5 (Basic) |
| Water | 4L (4000ml) | 4L ( 4000ml) |
| Soil | 1kg | 1kg |
| Cow dung | 350g | 350g |
| Azolla for inoculation | 10g | 10g |
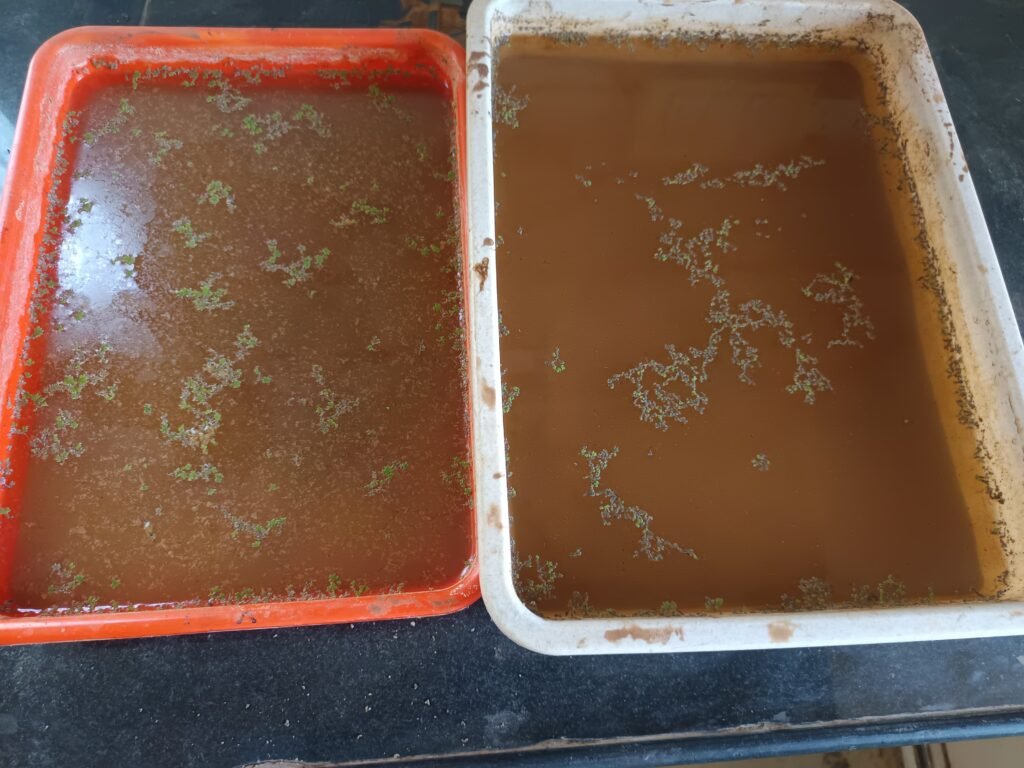
2. These two tray placed at full sunlight area whole day.
Table No. 2 – Full Sunlight Exposure
| Parameters | Orange Tray | White Tray |
| Size | 0.3m * 0.37m | 0.34m * 0.42m |
| pH | 6.5 (Acidic) | 8.5 (Basic) |
| Water | 4L (4000ml) | 4L ( 4000ml) |
| Soil | 1kg | 1kg |
| Cow dung | 500ml | 500ml |
| Azolla for inoculation | 15g | 15g |
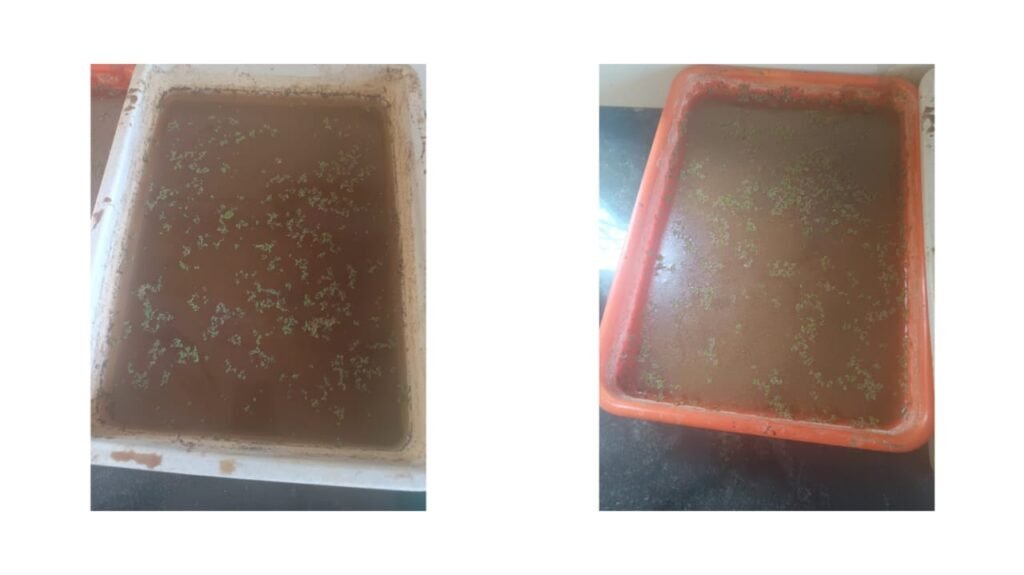
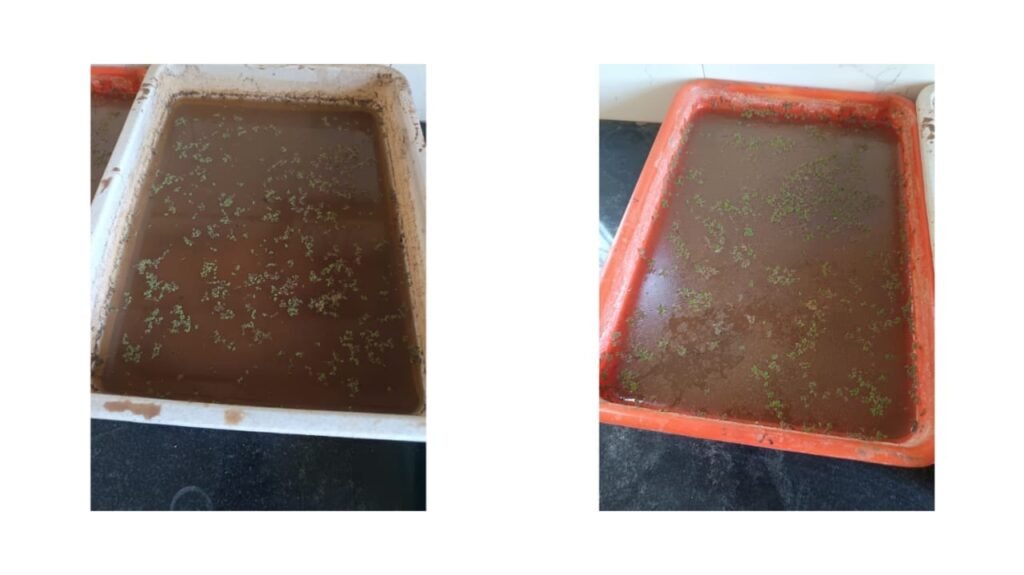
Observation :- There was no any change was observed at first day of inoculation.
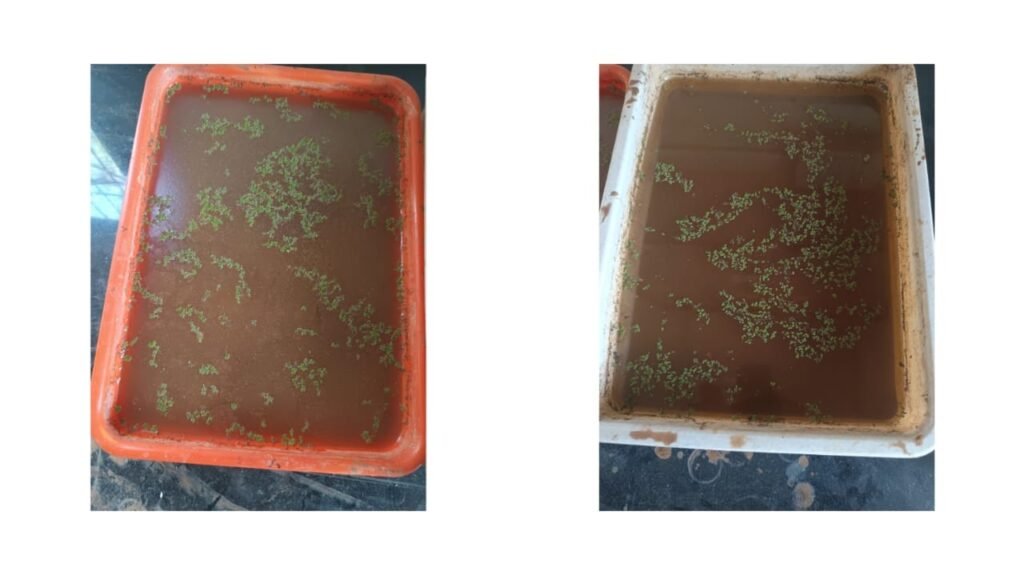
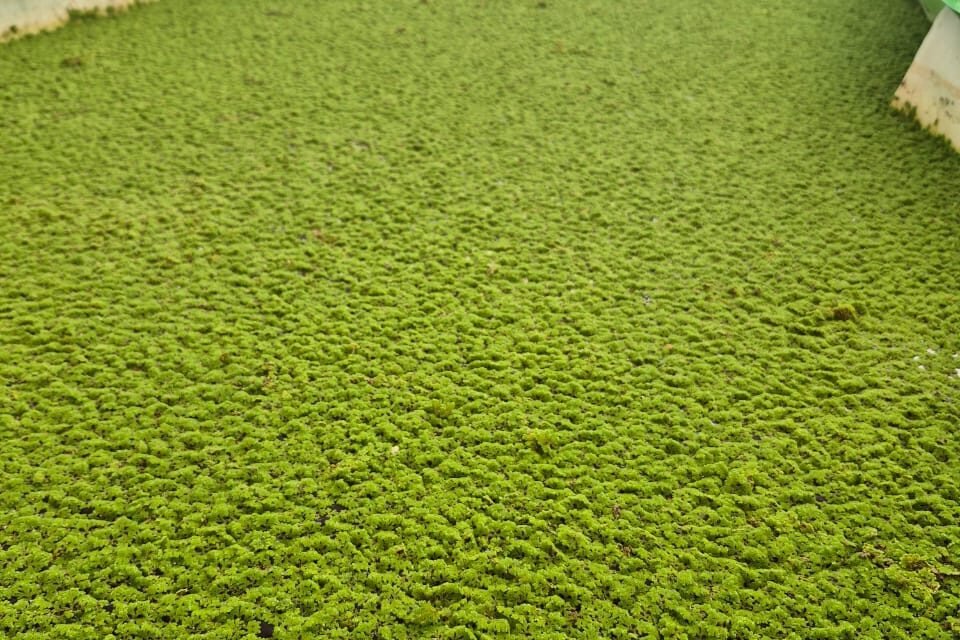
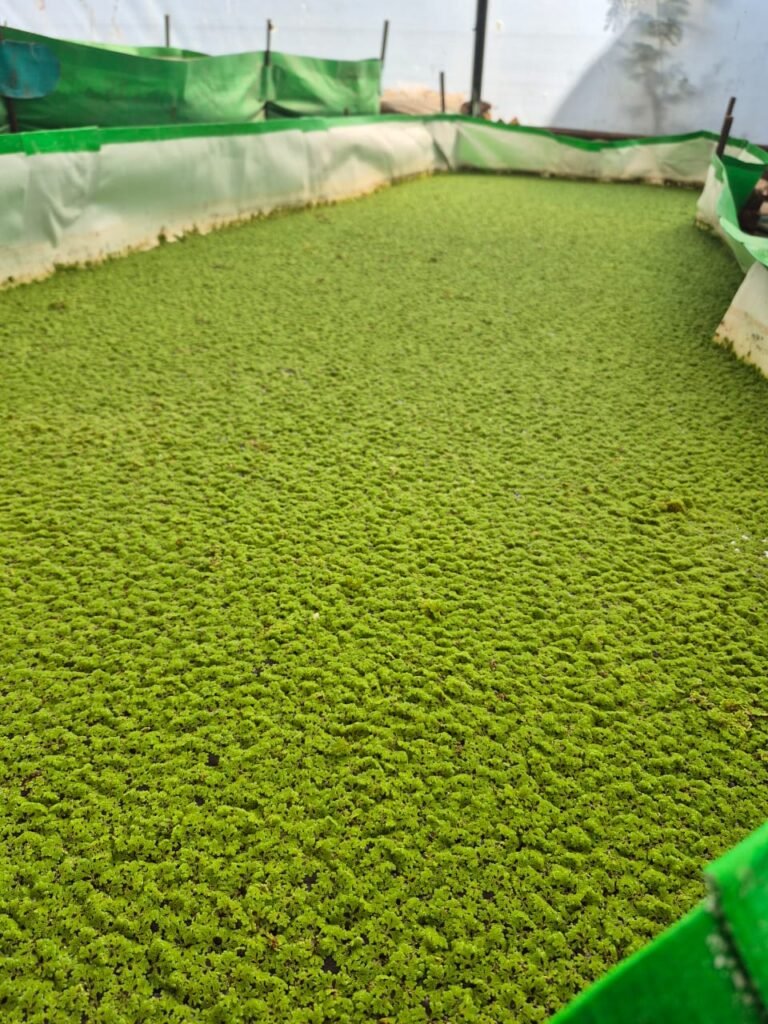
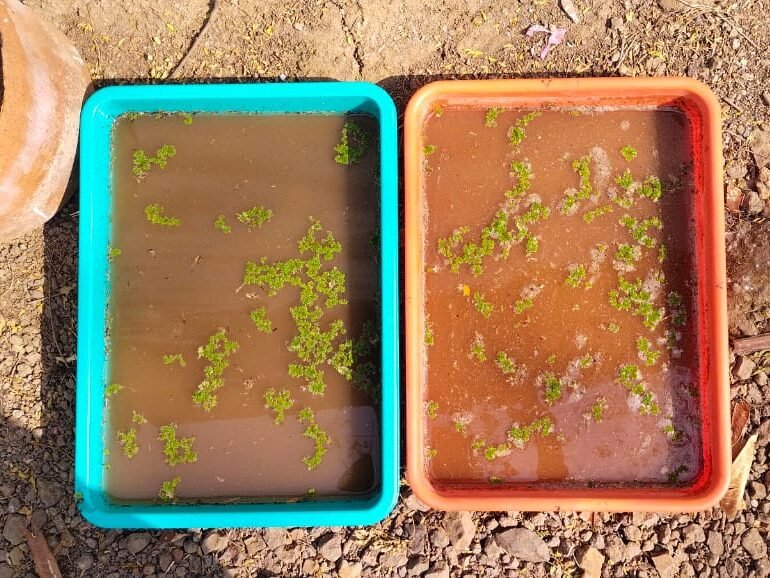
Observations – We observed that there was no significant growth in any of the trays except the orange tray with a pH of 6.5, which showed healthy green Azolla. In contrast, the white tray with a pH of 8.5 did not show healthy growth and is unlikely to support further multiplication.
Observation – The white tray with a pH of 8.5 showed completely dried Azolla, indicating no survival or potential for further growth. In contrast, the tray with a pH of 6.5 showed the presence of green, healthy Azolla, which has the potential to multiply further.
Observation -The Azolla culture in both trays was eventually destroyed. The tray with a pH of 8.5 showed no growth and dried out completely. Although the tray with a pH of 6.5 initially showed signs of survival, it too was ultimately destroyed due to the absence of sunlight.
From all the observations and photos taken, it is clear that without sunlight, no Azolla growth was observed. Sunlight plays a crucial role in processes like photosynthesis and photorespiration, which are essential for Azolla’s growth and multiplication.
18 March 2025
These results were shown to Dixit Sir. He advised me to set up four trays simultaneously. Following his instructions, I placed two trays in a dark area and two trays in a well-lit area, considering the same parameters as mentioned in the previous table.
| Parameters | Orange Tray | Blue Tray |
| Size | 0.3m * 0.37m | 0.34m * 0.42m |
| pH | 6.5 (Acidic) | 8.5 (Basic) |
| Water | 5L (4000ml) | 5L ( 4000ml) |
| Soil | 1kg | 1kg |
| Cow dung | 350g | 350g |
| Azolla for inoculation | 10g | 10g |
20 March 2025
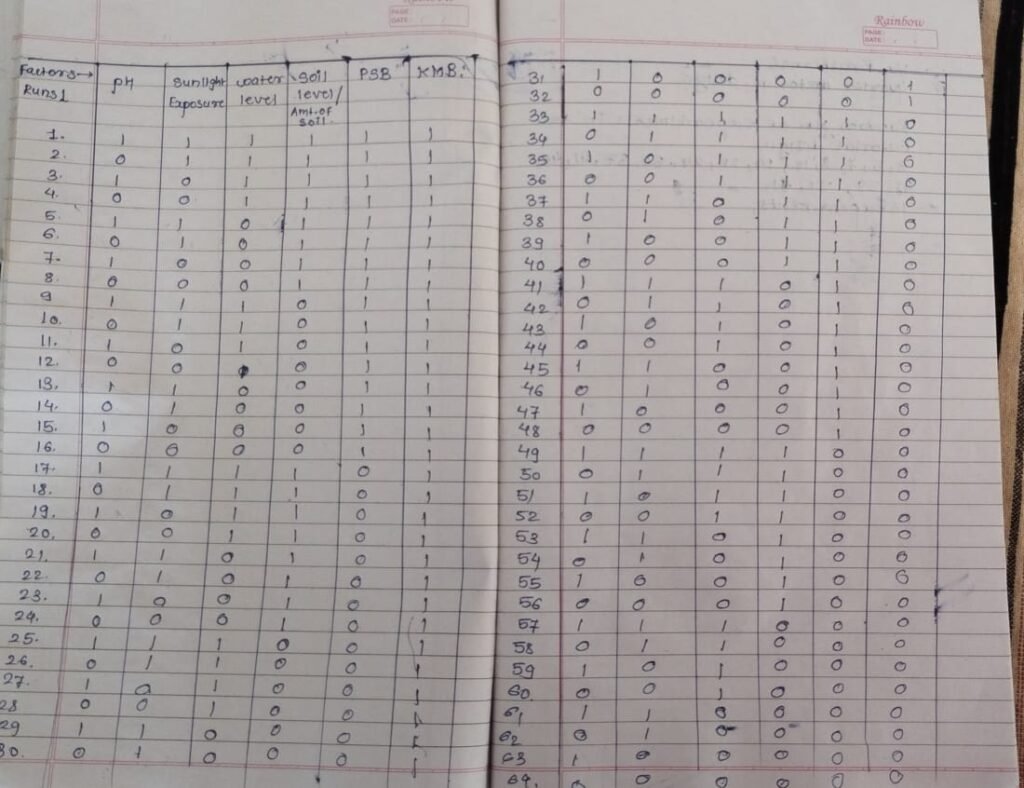
Dixit Sir advised me to consider 4 to 6 parameters at a time for the experiment. He instructed me to make a list of controllable and non-controllable factors. Based on this, I designed a Design of Experiments (DOE) table incorporating these factors, as shown below.
22 March 2025
Bapusaheb Sonawane Sir visited to discuss his project. After a discussion between Dixit Sir and Bapusaheb Sir, they decided to modify the DOE table and also made changes to the selected factors.
So, now the factors are
- pH
- Soil Amount
- Agitation- TO avoid the gradient of Nutrients
- Slurry Type ( Soil, Soil+ CDS)
Following DOE table
| Sr. No. | pH | Soil Amount | Agitation | Slurry type |
| 1. | 6.5 | H | No | soil |
| 2. | 6.5 | L | Yes | soil |
| 3. | 6.5 | L | No | soil + CDS |
| 4. | 6.5 | H | Yes | soil+ CDS |
| 5. | 8.0 | L | No | soil |
| 6. | 8.0 | H | Yes | soil |
| 7. | 8.0 | H | No | soil+ CDS |
| 8. | 8.0 | L | Yes | soil+ CDS |
| 9. | 8.0 | H | NO | soil+ CDS + SSP (Single Super Phosphate ) |
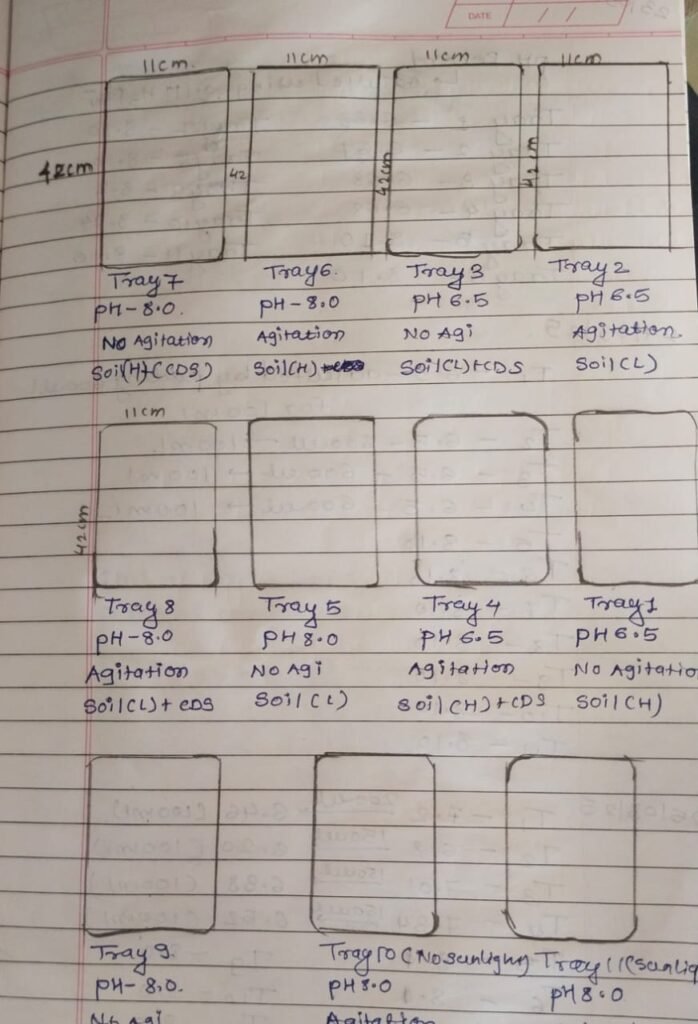
The trays for Azolla cultivation were prepared according to the modified DOE table mentioned above.
23 March 2025
Observation – No changes were observed on this day; pH, Agitated and water levels were adjusted as needed.
24 March 2025
Observation – Multiplication was supposed to happen on this day, but we did not observe any growth. Agitation, pH adjustment, and water level were monitored on this day.
26 March 2025
Observation – Each tray showed slight growth. As we can see the most prominent growth was observed in tray 2 which were having acidic pH 6.5, soil amount low, with Agitation and with only slurry.
28 March 2025
Observation – The last observation remained consistent with the previous one, and no new data was recorded.
30 March 2025
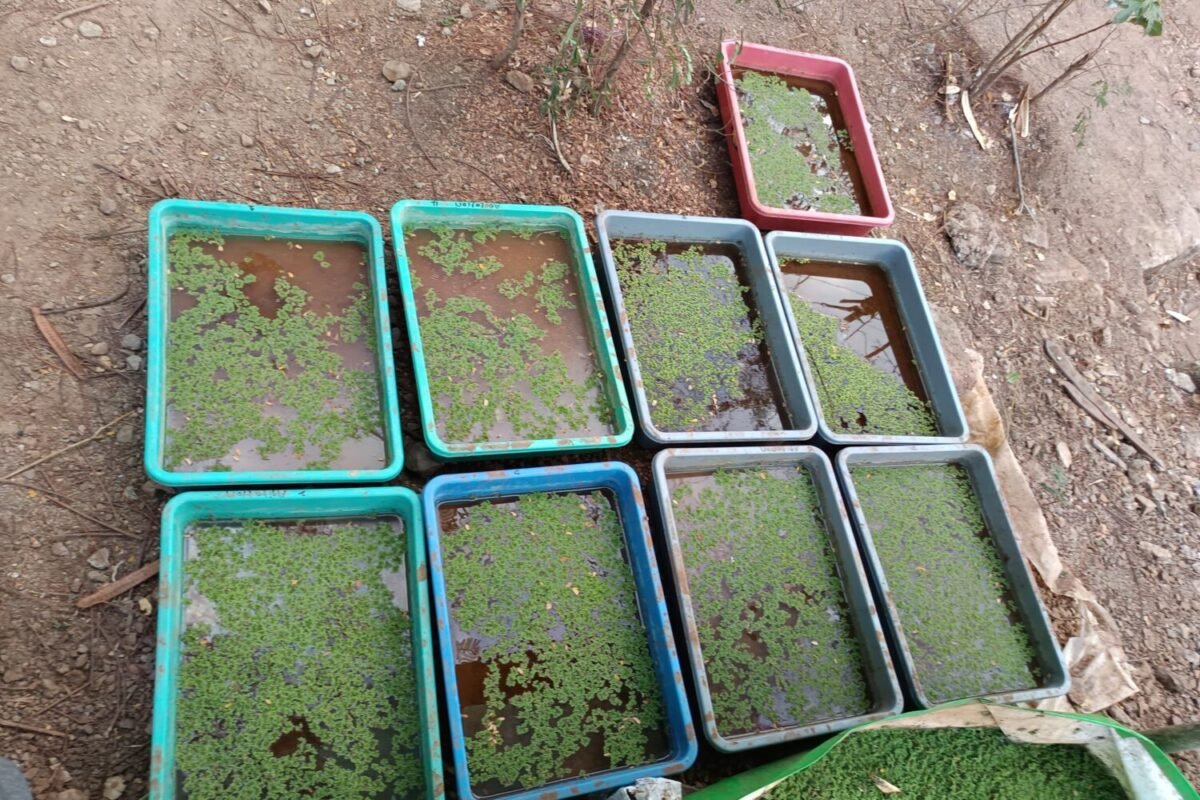
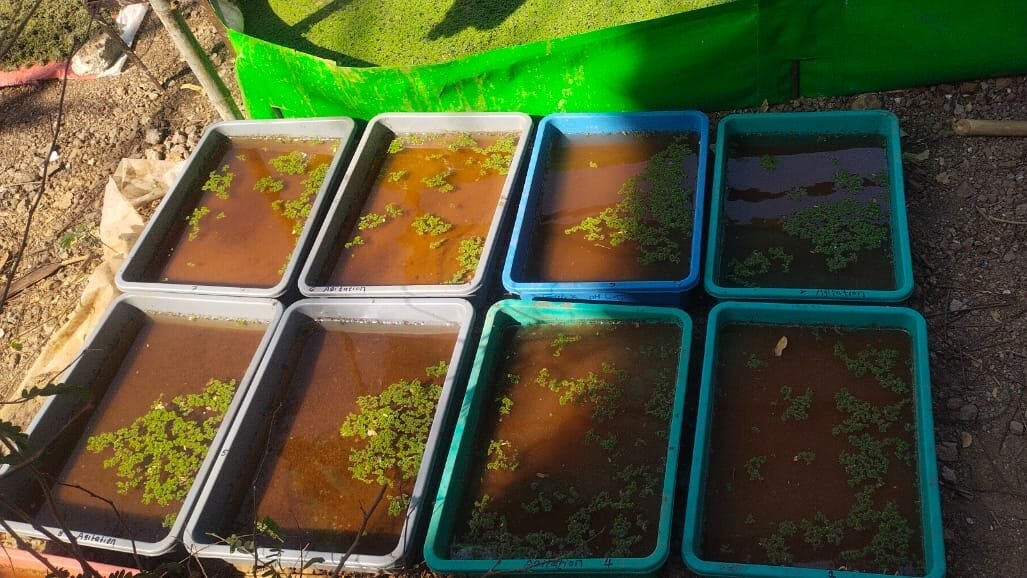
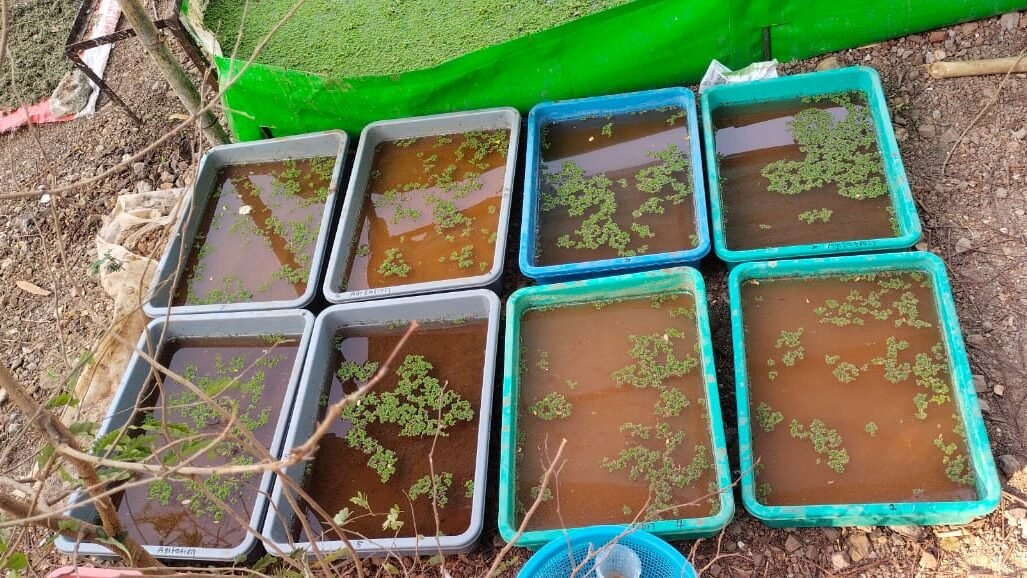
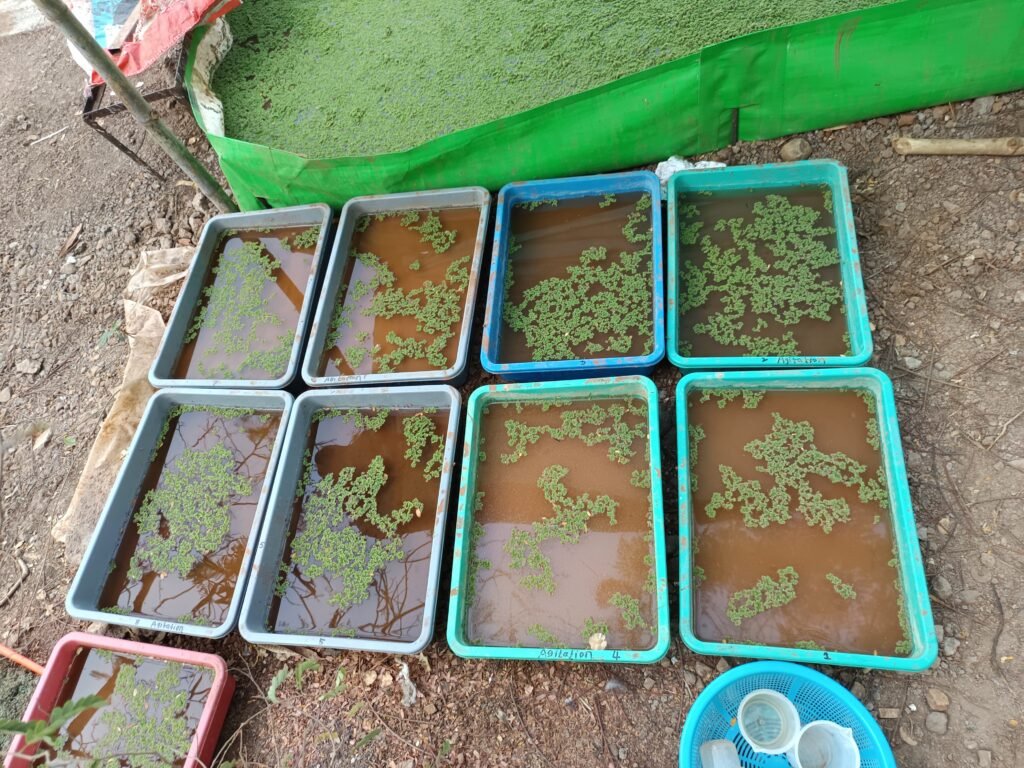
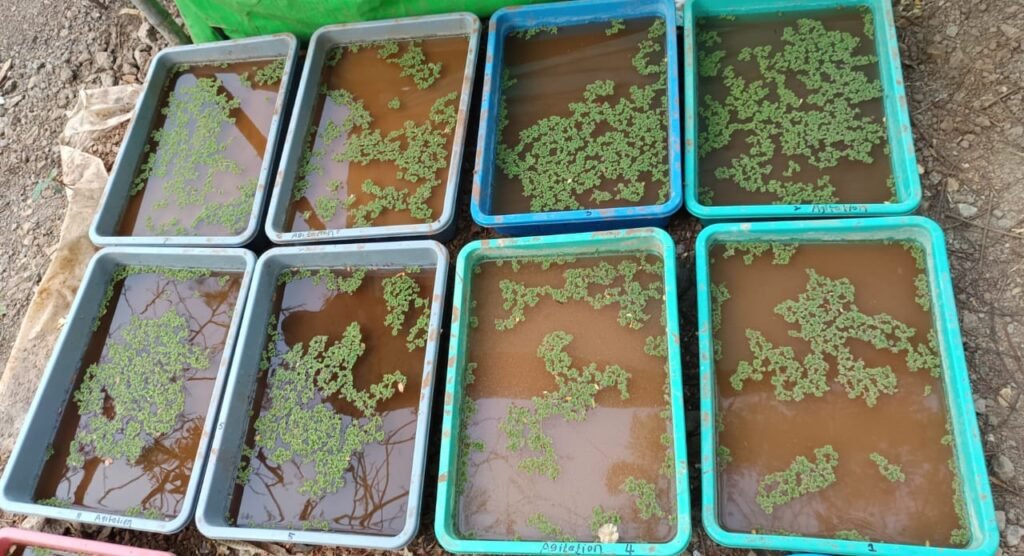
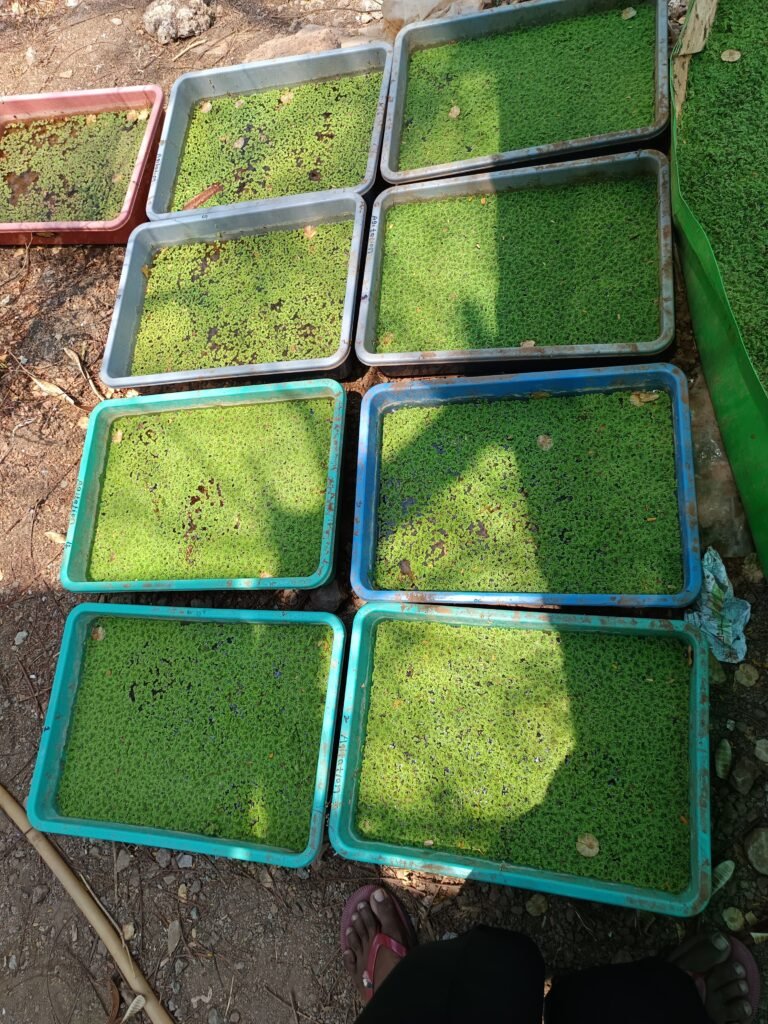
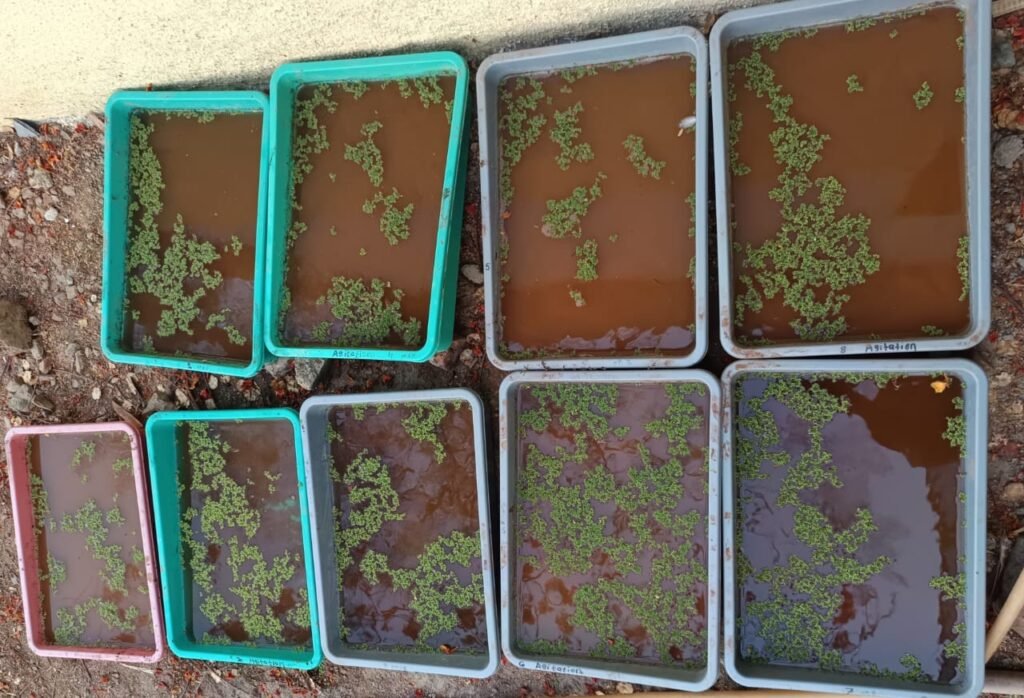
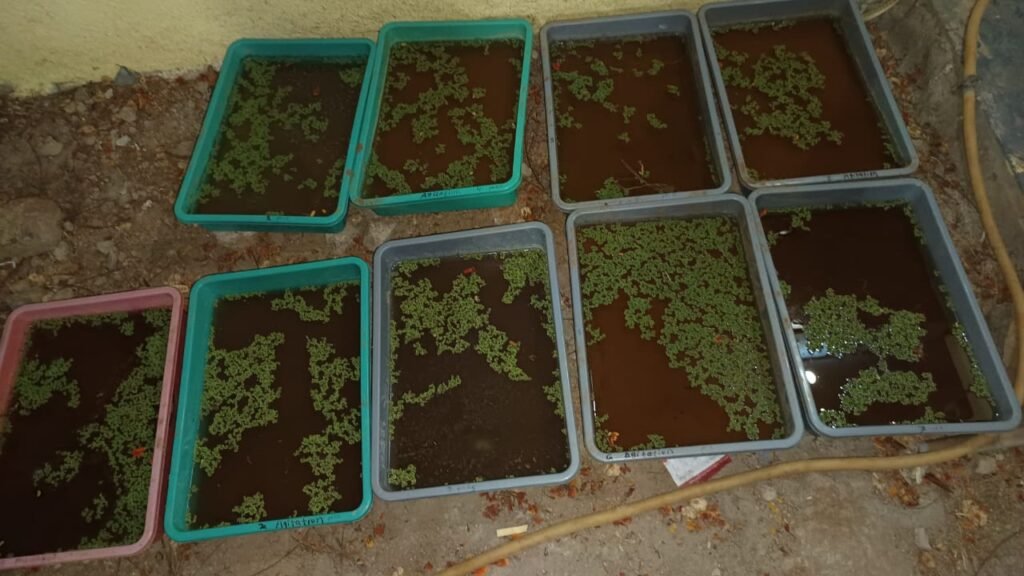
Observation – Trays no. 2, 3, 6, and 7 in the top row showed maximum Azolla growth compared to the lower-row trays (no. 1, 4, 5, and 8). The major change observed in the color, Trays with a higher amount of soil exhibited Azolla with a dark green color, while trays with less soil showed Azolla with parrot green coloration on the outer section of and dark green at the center of leaves.
1 April 2025
Observation – Tray 2, with a pH of 6.5, contained a low amount of soil and was regularly agitated. It showed a faster growth rate compared to the other trays and is now almost completely filled with Azolla. As mentioned earlier, the trays placed on the second row exhibited slower growth. Based on our observations, this may be due to their placement in a region exposed to direct sunlight rather than in a shaded area.
3 April 2025
Observation – Nearly all trays exhibited full Azolla growth, indicating healthy and consistent development across most conditions. However, trays no. 5, 8, and 9 showed comparatively less growth. This deviation may be attributed to factors such as suboptimal soil composition, insufficient shading, variations in pH, or differences in water agitation. Further monitoring and analysis of these trays may help identify the specific reasons behind the slower growth.
5 April 2025
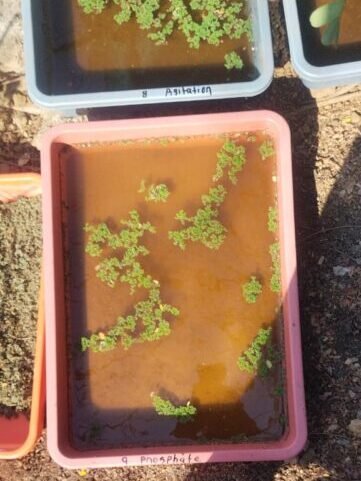
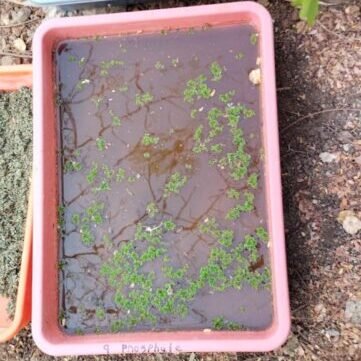
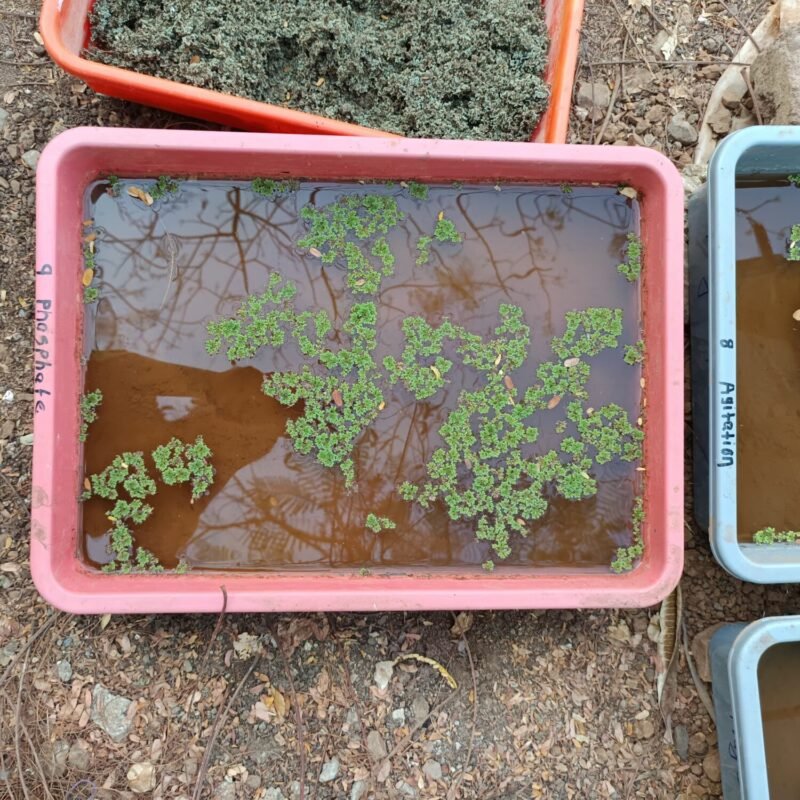
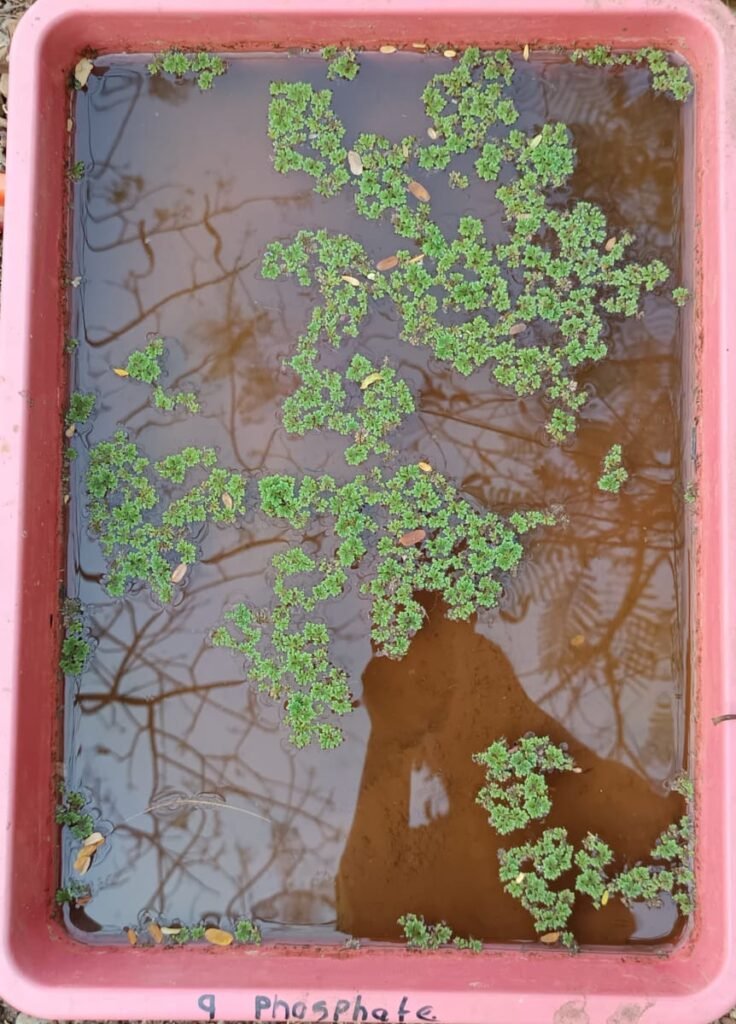
Observation – We observed Azolla growth in all trays except for Tray 9, which had phosphate added to it. In this tray, the Azolla also exhibited a slightly blackish coloration and showed poor growth. This condition appears to be due to exposure to direct sunlight for a certain period of time.
After that we decided to calculate the total production of Azolla and moisture content of Azolla in each tray separately.
Moisture content calculated by taking 5 g of sample in each tray and then considering the total azolla from tray.
Following Table shows total production and moisture content
| Sr. No. | pH | Soil Amount | Agitation | Slurry Type | Total Production of Azolla (g) | Moisture % |
| 1. | 6.5 | H | No | Soil | 123 | 1.64 |
| 2. | 6.5 | L | Yes | Soil | 98 | 1.4 |
| 3. | 6.5 | L | No | Soil + CDS | 91 | 1.2 |
| 4. | 6.5 | H | Yes | Soil + CDS | 105 | 1.26 |
| 5. | 8.0 | L | No | Soil | 80 | 0.8 |
| 6. | 8.0 | H | Yes | Soil | 70 | 0.9 |
| 7. | 8.0 | H | No | Soil + CDS | 123 | 1.37 |
| 8. | 8.0 | L | Yes | Soil + CDS | 72 | 0.86 |
| 9. | 8.0 | H | No | Soil + CDS | 0 | 0 |
Conclusion:
- pH Impact:
- Azolla production was generally higher at pH 6.5 compared to pH 8.0.
- Maximum production (123 g) was observed at pH 6.5, no agitation, high soil, and only soil as slurry.
- While at pH 8.0 higher production was observed in tray no. 7, where with no Agitation and slurry type soil +CDS
- Fastest Azolla Growth Observed in tray No.2 , where soil having low level with Agitation slurry type-only soil.
- Soil Amount:
- High soil amount (H) tends to favor higher Azolla yields, especially when combined with no agitation and soil-only slurry.
- Agitation:
- No agitation appears more favorable for Azolla production.
- The highest production values were consistently seen in non-agitated setups.
- Slurry Type:
- Soil-only slurry gave the highest production.
- Soil + CDS combinations varied—some were high (e.g., 1231.3 g), but one setup resulted in zero production, suggesting possible inhibitory effects depending on other variables.
- Moisture Content:
- No consistent correlation between moisture percentage and production was observed, though extremely low or high values might affect growth conditions.
- moisture content in Azolla bed having Acidic pH 6.5 showing highest Moisture content which was 1.64 tray no. 1.
15 April 2025
These results were shown to Dixit Sir. After reviewing them, he suggested that to conduct another set of experiments focusing on the daily yield of Azolla.
Referred the previous DOE Table for this experiment as follows.
| Sr. No. | pH | Soil Amount | Agitation | Slurry type |
| 1. | 6.5 | H | No | soil |
| 2. | 6.5 | L | Yes | soil |
| 3. | 6.5 | L | No | soil + CDS |
| 4. | 6.5 | H | Yes | soil+ CDS |
| 5. | 8.0 | L | No | soil |
| 6. | 8.0 | H | Yes | soil |
| 7. | 8.0 | H | No | soil+ CDS |
| 8. | 8.0 | L | Yes | soil+ CDS |
| 9. | 8.0 | H | NO | soil+ CDS + SSP (Single Super Phosphate ) |
Soil – H= 2.6 kg (1kg/sq.ft) L= 0.26kg (01kg/sq.ft)
Slurry Type – Soil = neat Soil (100%) CDS = 100g/ tray ( Cowdung slurry )
PH – 1. pH 8.0 ; tap water having pH 8.1 2. pH6.5 ; adjusted with H3PO4 Stock solution 0.1M
- Added 10g of Azolla culture per tray.
- added water about 5L and 4cm above the soil level from both (H and L)
17 April 2025
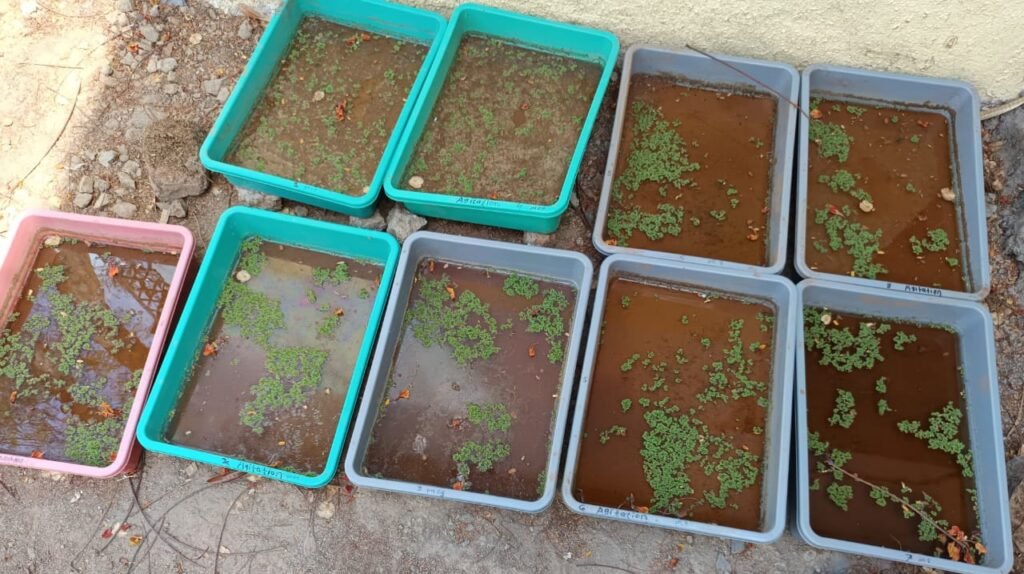
Observation – All trays were prepared according to our DOE table and placed in locations where they receive adequate shade and light. 10g Azolla added to each beds.
Following table shows Azolla yield on above date
| Sr. No. | pH | Yield (g) |
| Tray 1 | 6.5 | 10 |
| Tray 2 | 6.5 | 10 |
| Tray 3 | 6.5 | 10 |
| Tray 4 | 6.5 | 10 |
| Tray 5 | 8.0 | 10 |
| Tray 6 | 8.0 | 10 |
| Tray 7 | 8.0 | 10 |
| Tray 8 | 8.0 | 10 |
| Tray 9 | 8.0 | 10 |
18 April 2025
Observation – We did not observed any growth in any tray, were having yield of same as we inoculated first day.
Following table shows Azolla yield on above date
| Sr. No. | pH | Yield (g) |
| Tray 1 | 6.5 | 11.08 |
| Tray 2 | 6.5 | 10.50 |
| Tray 3 | 6.5 | 11.60 |
| Tray 4 | 6.5 | 12.01 |
| Tray 5 | 8.0 | 10 |
| Tray 6 | 8.0 | 11.90 |
| Tray 7 | 8.0 | 12.05 |
| Tray 8 | 8.0 | 10 |
| Tray 9 | 8.0 | 11.69 |
19 April 2025
Observation – The observations remained consistent with the previous ones. but there was change in yield of Azolla
Following table shows Azolla yield on above date
| Sr. No. | pH | Yield (g) |
| Tray 1 | 6.5 | 13.50 |
| Tray 2 | 6.5 | 12.98 |
| Tray 3 | 6.5 | 12.01 |
| Tray 4 | 6.5 | 15.08 |
| Tray 5 | 8.0 | 10 |
| Tray 6 | 8.0 | 18.05 |
| Tray 7 | 8.0 | 12.80 |
| Tray 8 | 8.0 | 10 |
| Tray 9 | 8.0 | 15.60 |
20 April 2025
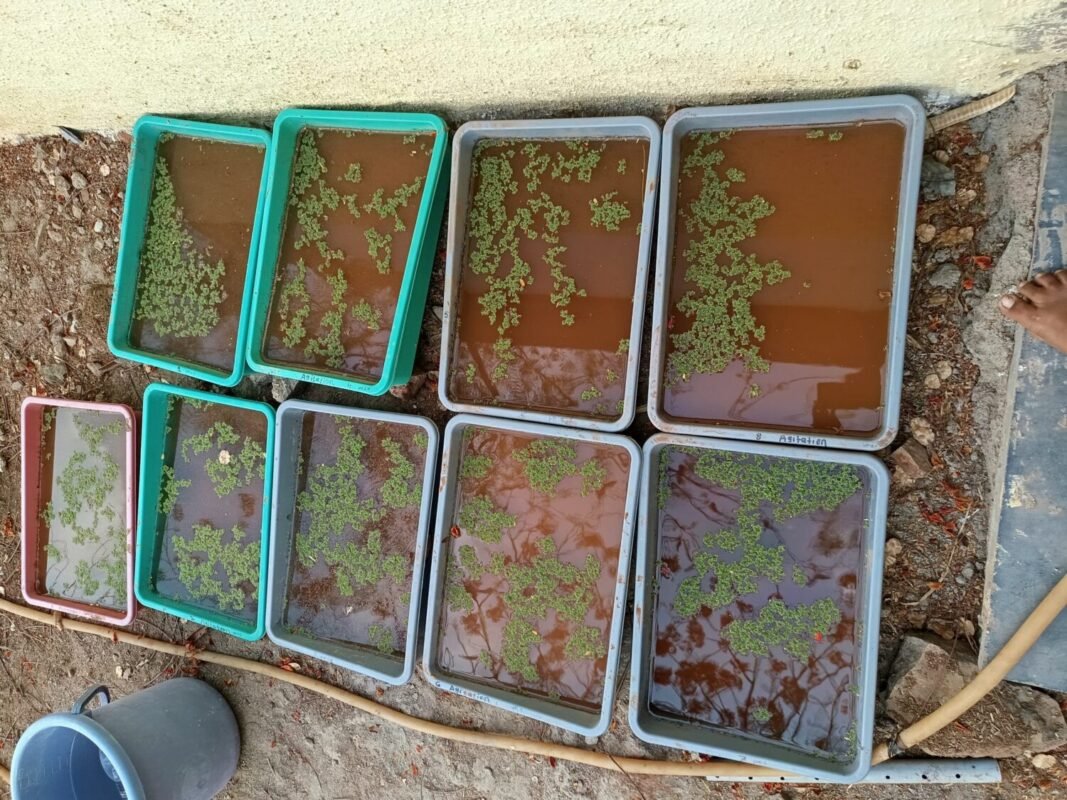
Observation- Tray 6 and 2 has shown maximum growth of Azolla compared to all trays.
Following table shows Azolla yield on above date
| Sr. No. | pH | Yield (g) |
| Tray 1 | 6.5 | 17.83 |
| Tray 2 | 6.5 | 22.08 |
| Tray 3 | 6.5 | 16.60 |
| Tray 4 | 6.5 | 17.10 |
| Tray 5 | 8.0 | 10 |
| Tray 6 | 8.0 | 22.50 |
| Tray 7 | 8.0 | 14.80 |
| Tray 8 | 8.0 | 10 |
| Tray 9 | 8.0 | 18.77 |
21 April 2025
observation – The most prominent Azolla growth on this day was evident in tray 6. Furthermore, the trays maintained at a pH of 6.5 displayed nearly identical growth patterns. Conversely, trays 5, 8, and 7 exhibited only negligible growth in comparison to the rest. It’s worth noting that the tray containing phosphate showed a level of growth comparable to the Azolla observed in the acidic trays.
Following table shows Azolla yield on above date
| Sr. No. | pH | Yield (g) |
| Tray 1 | 6.5 | 20.10 |
| Tray 2 | 6.5 | 19.50 |
| Tray 3 | 6.5 | 18.55 |
| Tray 4 | 6.5 | 17.95 |
| Tray 5 | 8.0 | 10 |
| Tray 6 | 8.0 | 35.45 |
| Tray 7 | 8.0 | 13.50 |
| Tray 8 | 8.0 | 11.65 |
| Tray 9 | 8.0 | 25.02 |
22 April 2025
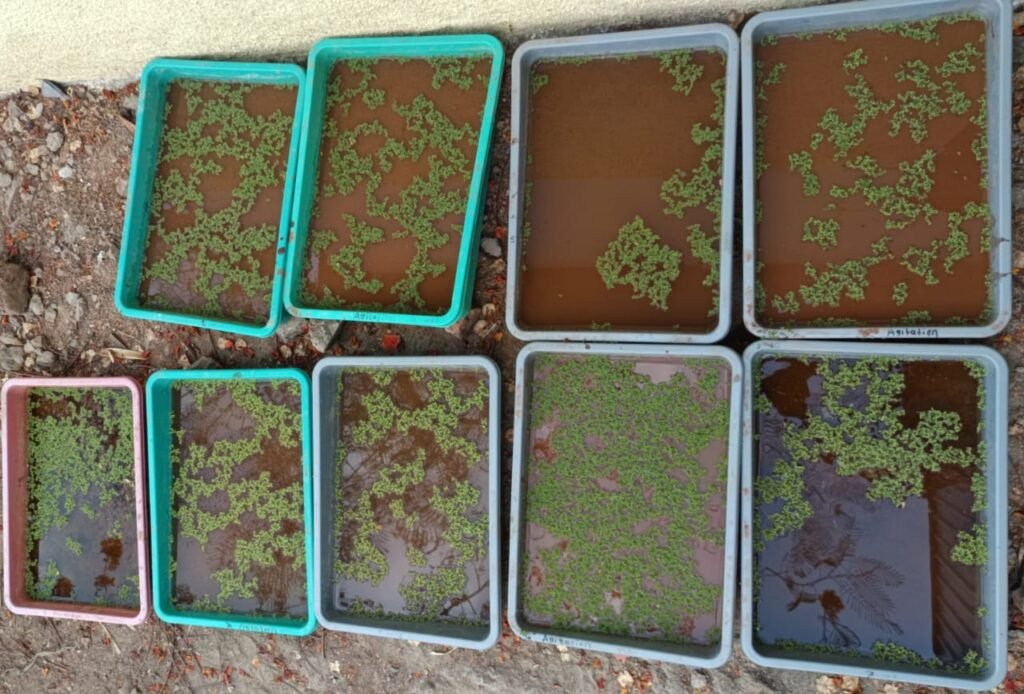
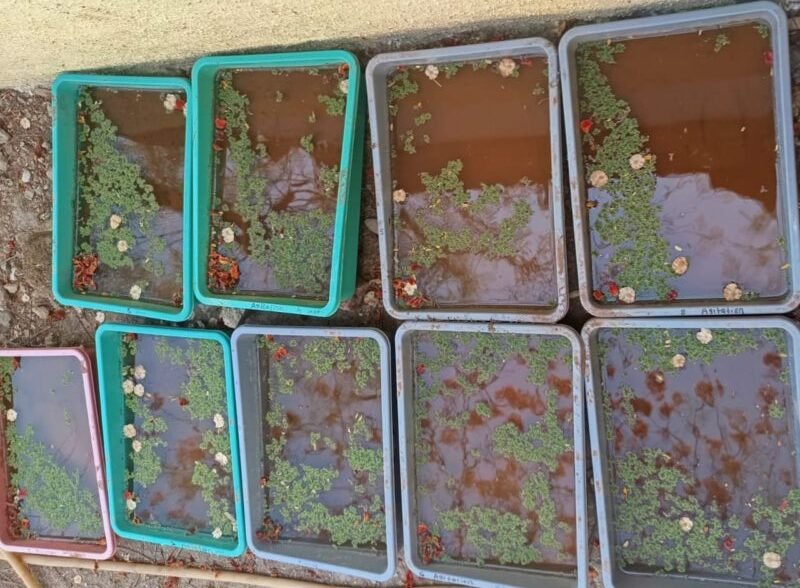
Observation – Tray 6, which contained a high amount of soil, experienced regular agitation, and maintained a pH of 8.0, exhibited the most significant Azolla growth compared to all other trays. Following this, Tray 1 (high soil amount + pH 6.5 + soil only) and Tray 3 (low soil amount + pH 6.5 + agitation + soil + CDS) displayed similar growth patterns. In contrast, Tray 5 showed a very slow growth rate when compared to the other trays.
Following table shows Azolla yield on above date
| Sr. No. | pH | Yield (g) |
| Tray 1 | 6.5 | 17.83 |
| Tray 2 | 6.5 | 22.08 |
| Tray 3 | 6.5 | 19.42 |
| Tray 4 | 6.5 | 18.17 |
| Tray 5 | 8.0 | 10 |
| Tray 6 | 8.0 | 32.87 |
| Tray 7 | 8.0 | 11.28 |
| Tray 8 | 8.0 | 12.34 |
| Tray 9 | 8.0 | 36.08 |
24 April 2025
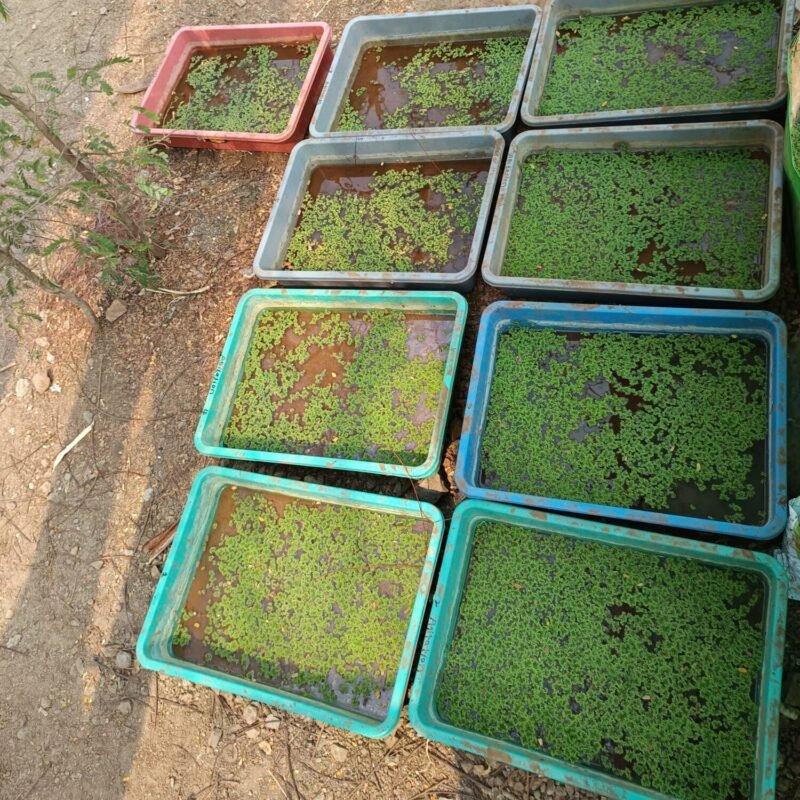
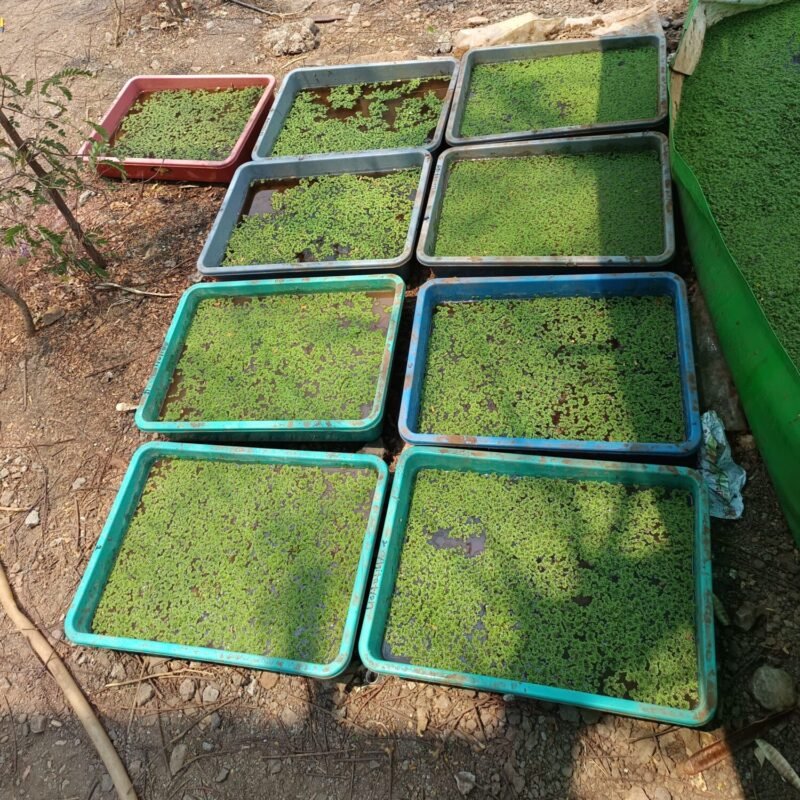
Observation – AS we can see from above image most prominent growth was observed in Tray No. 1, 4, 6, and 9, these all trays have common in all was high amount of soil while tray 1and 4 was with acidic pH and 8 with basic pH 8.0
| Sr. No. | pH | Yield (g) |
| Tray 1 | 6.5 | 48.50 |
| Tray 2 | 6.5 | 25.89 |
| Tray 3 | 6.5 | 30.12 |
| Tray 4 | 6.5 | 39.20 |
| Tray 5 | 8.0 | 17.81 |
| Tray 6 | 8.0 | 70.28 |
| Tray 7 | 8.0 | 21.65 |
| Tray 8 | 8.0 | 19.75 |
| Tray 9 | 8.0 | 68.15 |
25 April 2025

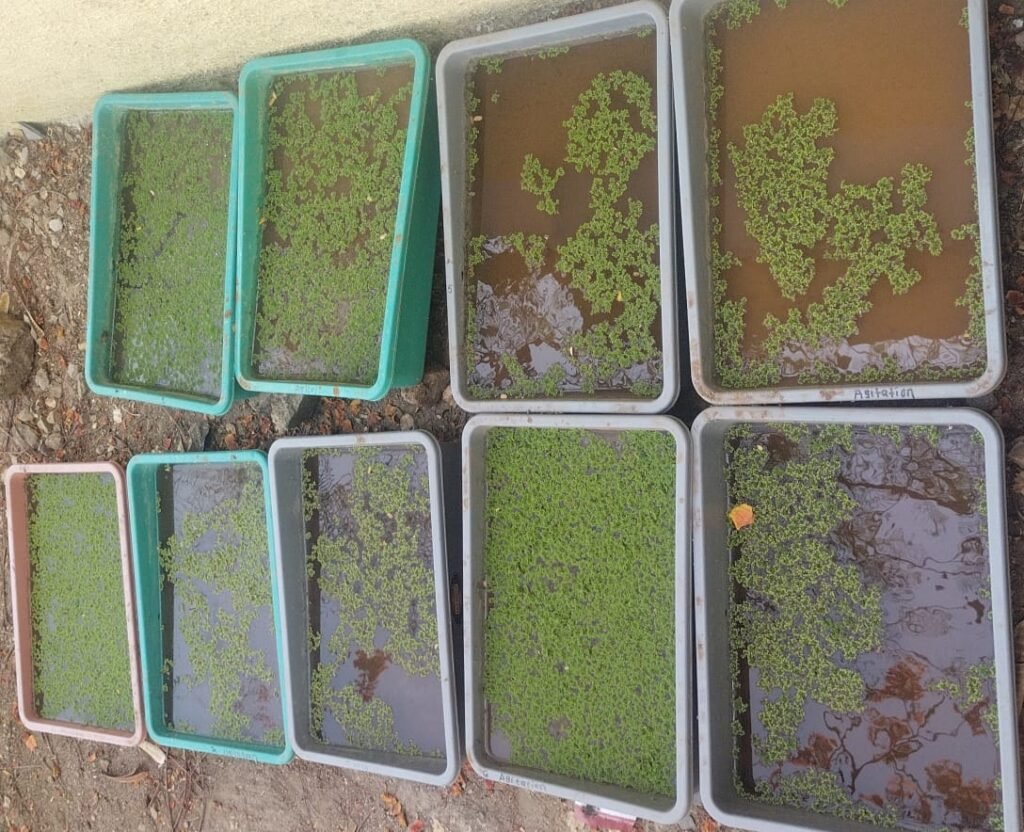
Observation – The most significant growth was observed in Tray 9. Trays 1, 4, 6, and 9 exhibited the highest Azolla growth, and a common factor among these was the use of a higher quantity of soil. Additionally, Trays 1 and 4 had an acidic pH, and the Azolla leaves in these trays displayed a dark green coloration. In contrast, the Azolla in Trays 6 and 9 showed a lighter green hue. Trays with a lower amount of soil presented lighter green leaves, with a parrot green coloration noticeable at the center of the fronds
Following table shows production of Azolla in each tray.
| Sr. No. | pH | Yield (g) |
| Tray 1 | 6.5 | 63.15 |
| Tray 2 | 6.5 | 40.73 |
| Tray 3 | 6.5 | 38.06 |
| Tray 4 | 6.5 | 46.32 |
| Tray 5 | 8.0 | 80.08 |
| Tray 6 | 8.0 | 20.01 |
| Tray 7 | 8.0 | 26.90 |
| Tray 8 | 8.0 | 23.45 |
| Tray 9 | 8.0 | 73.02 |
Conclusion –

