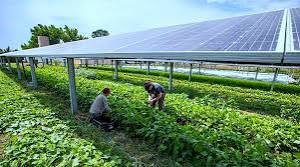
Introduction to Agrivoltaic farming
Agrivoltaic farming is the practice of growing crops underneath solar panels. It uses the shaded space left empty under solar panels to grow crop. This is doubling up the land use in this way it could help feed the world’s growing population while providing sustainable energy. According to recent studies, there are shade loving plants which thrive when grown in such environment.
Agrivoltaic farming already in use
Researchers in South Korea have been growing broccoli underneath photovoltaic panels. The panels are positioned 2-3 meters off the ground and sit at an angle of 30 degree providing shade and offering crop protection from the weather.

A study in this project found that the quality of broccoli was not any lower than that of broccoli grown in traditional way.
An Agrivoltaic farming project in Kenya is using solar panels held several meters off the ground, with gap in between them. The shade from the panels protects vegetables from heat stress and water loss.This has resulted in rural farmers being able to grow a greater range of higher-value crops. The project effectively harvests the power of sun twice, the researchers say.
If solar panels can be added to greenhouses, the results could be especially transformative. Greenhouse-based farming reportedly produces 10 times more food than growing in an open field, but it can require 10 times as much power.
14/10/24
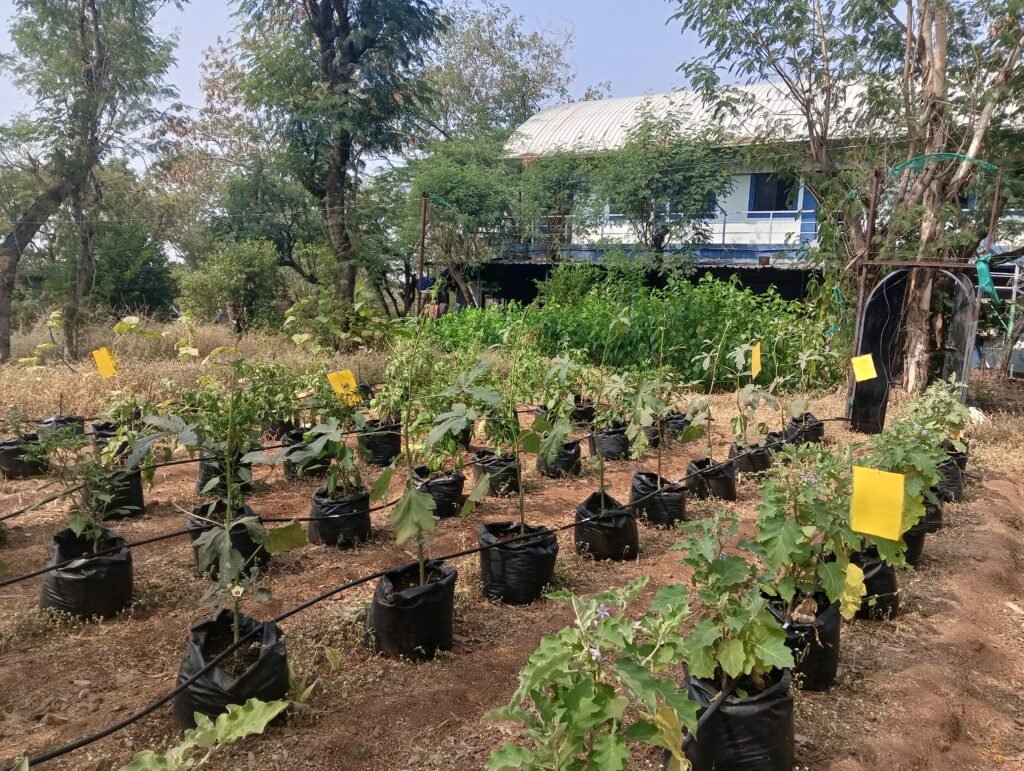
This project was alloted to Akash, his internship is about to finish in few days, so I have to continue this project further. This project is on Agrivoltaic farming and under this project we are firstly focusing on plant architecture section. There are some plants such as marigold, okra, chilli, tomato, brinjal, cucumber, chrysanthemum, which are planted in an open field to measure the plant parameters till their full growth. Weekly measurements of plant parameters and daily observation of plants were in process. This measurements were taken to develop a computerized tree generation on HELIOS Software for further comparative study.
- Akash explained me about the whole project
- We went on field to measure plant parameters.
If you are keen to know how this project started from beginning, below I have provided blog link to Akash’s project
https://vadic.vigyanashram.blog/2024/09/28/agrivoltaics-plant-architecture/
Images while taking measurements.

20/10/24 – 21/10/24
- Weekly measurements of plant parameters were taken
- Weeding in field
- Cleared certain doubts regarding parameters to be measured with Akash.
25/10/24
Drenching was done by 90 gm of 0:52:34 in 15 litres of water
Daily observation of plants which includes observation of leaves, flowers, fruits and providing dosing and sprays accordingly. Check soil moisture and provide irrigation to plants.
27/10/24 – 28/10/24
- Weekly measurements of plant parameters were taken.
- Filling data in excel sheet, uploading plant photos on drive.
- Weeding in poly bags.
Link to photos of plants captured weekly
https://drive.google.com/drive/folders/1BZol6tZFD8qTD1NHvt8fqiKBOnglBTkx
Link to excel sheet
4/11/24
Weekly measurements of plant parameters were recorded.
Took photographs of plants to upload.
6/11/24
Filling measurement data in excel sheet
Link to excel sheet
Link to photos of plants
https://drive.google.com/drive/folders/1Fqx0dBNdwtQIh-eYsZ7WsKQ6kJL9kqKR
Leaf miner on Cucumber leaves were seen
Add 0.5 ml of Gracia insecticide in 500 ml of water. Spraying was done on cucumber leaves at evening 5:00 pm
10/11/24
Yellowing of leaves were observed in cucumber, brinjal and tomato so we did drenching of 13:40:13 (NPK water soluble fertilizer) which is useful in healthy vegetative growth, flowering and fruiting stage of plants.
We took 20 gm of 13:40:13 fertilizer for 10 litres of water ,there are total 90 plants so that per plant will get 100 ml of fertilizer drenching.
11/11/24
Weekly measurements of plant parameters were recorded.
Chilli, tomato, okra, brinjal are at fruiting stage.
Flowering buds are seen on rose and chrysanthemum.
Spraying of insecticide
PALLET ( Propargite 57% EC ) is a insecticide used to control all type of mites and thrips in many crops like brinjal, okra, chillies and other crops. Thrips and mites were observed on leaves of chrysanthemum, chilli, okra and brinjal. To control insects we sprayed insecticide on leaves of plants.
Quantity:
Water – 2 litres
Insecticide- 4 ml
Identification of insects
Fig. Black thrips on chilli
Fig. Yellow mites on Okra
Fig. Black thrips and white flies on Okra
12/11/24
Uploaded data on excel sheet.
Link to excel sheet
Link to photos
https://drive.google.com/drive/folders/1I6HItvDdpFw11RRC4gRtZHligrFJXuLA
16/11/24
Compost fertilizer was provided to all plants. In quantity of 200 gm per plant. Compost fertilizer helps to grow plant healthier and stronger. It improves organic matter content and then provides essential macro and micro nutrients for plant growth.
18/11/24
Weekly measurements of plant parameters were recorded.
20/11/24
Filling of plant data measurement on excel sheet and uploading photos of plants on google drive.
Link to excel sheet
23/11/24
Insects, flies were seen on leaves in increasing numbers so we hanged yellow sticky flytraps. Yellow sticky traps with pheromone in glue are used to seize the male pests, which are lured by pheromone, thus to reduce the mating between male and female pests, and reduce their next generation and quantity. Yellow pests attracts to yellow colour and fly towards it, gets stick and die.
Did insecticide spraying on leaves of chrysanthemum, chilli and okra.
Name: Orgomite
Quantity: 2 ml in 1 litre water
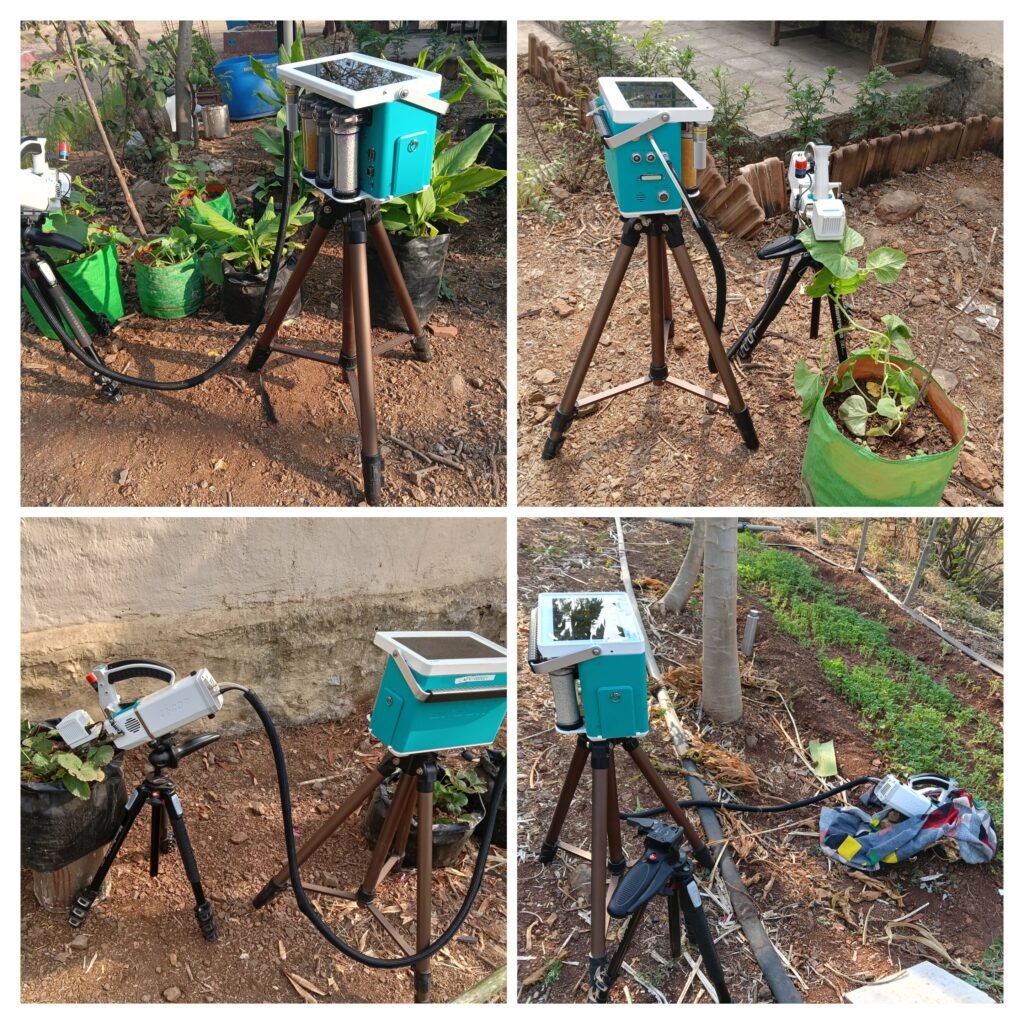
INTRODUCTION TO LI-COR 6800 PORTABLE PHOTOSYNTHESIS SYSTEM
Above pdf includes detail information about LI-COR portable photosynthesis machine.
On 5th Jan, Ravi sir and Nimish sir from APV sunseed visited to our VA campus to provide training on operating the LI-COR 6800 Photosynthesis machine. Following 3 days of hands on practice, we started recording photosynthesis rate measurements through ACI, AQI and VPD curves. For each species of plant a total 30 curves were to be collected. Recently, we have completed strawberry and cucumber and have started for turmeric.
On 14 January, new sets of plants were planted, with five replicates each of:
- Okra
- Chrysanthemum
- Chilli
- Brinjal
- Tomato
These plants will be used for recording plant architecture data and LI-COR photosynthesis machine data, enabling to study their growth and photosynthetic characteristics.
It was decided to measure plant architecture data once in 15 days and take photos of plants weekly
Recorded photosynthesis readings of various parameters, including:
– ACI (photosynthesis vs intracellular concentration of CO2)
– AQI (photosynthesis vs light response)
– VPD (Vapor Pressure Deficit) or stomatal conductance-
Completed readings for the following plants:
1. Turmeric
2. Fenugreek
3. Rose
Took plant architecture measurements for the plants namely chrysanthemum, brinjal, chilli, tomato.
Almost all plants, except brinjal, which was replanted in Phase 2, withered due to heat stroke. So it is decided to replant those left plants for plant architecture measurements in Polyhouse
Maker’s Mela Event (21/2/25-22/2/25)
Participated in Maker’s Mela held at Somaiya University, Vidyavihar, Mumbai
Objective: Provide a platform for innovative projects and cutting-edge technologies
– Exhibited products from Vigyan Ashram:
– H2S water testing kit
– Agri waste decomposer
– AKXY home composter
– Polyhouse data Loggers
showcased projects converted into business:
– Production of Black soldier fly and managing wet waste by black soldier fly larva
-displayed automation projects from Vigyan Ashram’s DIY lab:
1. Line follower robot
2. Motion detector robot
3. Calculator
4. Soil moisture sensor
5. Solar lamp
6. Walking robot
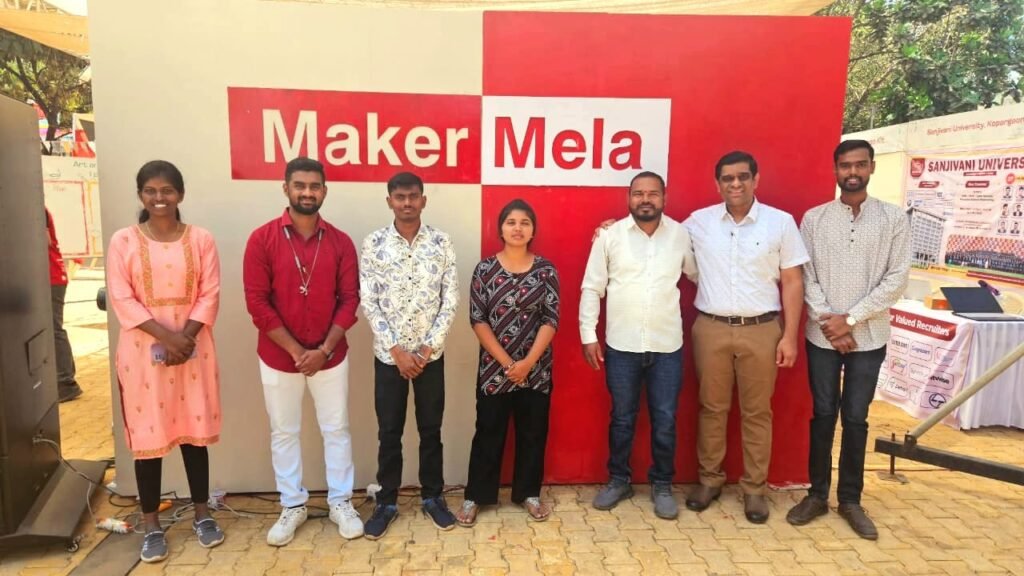
Fig. Team Vigyan Ashram at Maker’s Mela
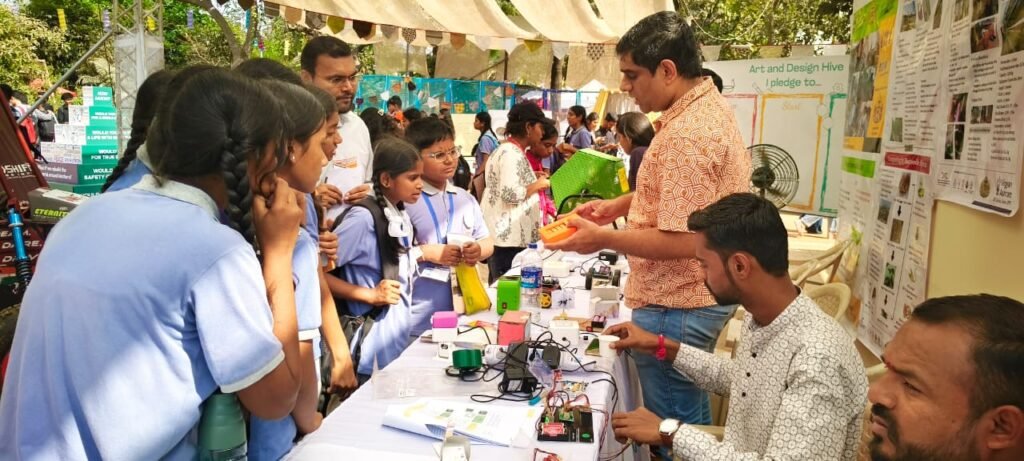
Fig. Engaged with students and stall visitors
Two days experience at exhibition was most valuable in developing my soft skills. I exchanged ideas with various visitors visiting at stall.
25/2/25—9/3/25
Sayali joined our Agrivoltaics team as an intern to assist with collecting LI-COR photosynthesis readings from plants. Before handling her with the machine, I provided thorough training, covering the fundamentals of machine operation and beyond. After two days of hands-on practice, I introduced her to the scientific principles of the machine. I intentionally delayed sharing this information to avoid overwhelming her initially.
5/3/25
Nimish sir visited Vigyan Ashram, he shared some insights about how the Li-COR data we collect from plants through photosynthesis machine is processed further. Data is processed in 2 stages by Ravi sir first and then final stage is done by Nimish sir. So he explained his part of work which he does from website of GIZ
6/3/25 – 26/3/25
Plantation of plants for plant architecture measurements was done.
Further I assisted to Sayali for taking plant photosynthesis data with her alternatively
27/3/25
Nimish Sir visited campus for discussion regarding microclimate in polyhouse. Meeting and Discussion on Polyhouse MicroclimateDiscussed about Polyhouse microclimate with Nimish sir and Dixit .
The primary focus of the discussion was on the experimental design and methodology for investigating the effects of foggers and cellulose pad treatments on the Polyhouse environment.
Fogger Testing:
The proposed experiment involves testing three different foggers (designated A, B, and C) to evaluate their performance and efficacy in controlling the Polyhouse microclimate. The foggers will be evaluated using both untreated and treated water solutions to assess the impact of algae-induced effects on the system.
Cellulose Pad Experiment:
The experiment will also investigate the effects of using different water solutions (untreated and treated) on the cellulose pad. This will help to determine the optimal treatment conditions for minimizing algae growth and maximizing the pad’s performance.
Heat Calculations:
Calculations will be performed to determine the amount of heat trapped within the fully covered Polyhouse. This information will be used to estimate the required water evaporation rate to maintain a stable and optimal microclimate.
Data Logger Placement:
The positions of data loggers within the Polyhouse will be determined to ensure accurate and representative measurements of the microclimate conditions.
Future Work:
The discussion outlined the work to be carried out further, including the experimental design, data collection, and analysis. The meeting concluded with a clear plan for the next steps in the project.
Date: 10/4/25
Preparing experimental setup for Evaluation of Algal Growth on Cellulose Cooling Pads Using Treated and Untreated Water
Objective: To investigate the effect of treated versus untreated (algae-rich) water on algal growth on cellulose cooling pads, and assess the effectiveness of oxalic acid and lime treatment in preventing algal biofilm formation, which can reduce pad efficiency due to clogging
Materials Required:
Cellulose cooling pads (2 units, each 0.12 m², reused from scrap)
Submersible pumps (2 units)
Lateral pipes (from scrap)
Water collector trays (from BSF)
Buckets (as water reservoirs)
T-angles and L-angles (for structural support)
Oxalic acid
lime (calcium hydroxide)
Experimental Setup:
Two identical cooling pad systems were assembled using above materials:
A lateral pipe was horizontally installed on a supporting pad, with holes drilled along its length at gaps of 5-5 cm to ensure even water distribution. One end of this lateral was connected to L angle pvc fitting, while the other end was joined to a submersible pump submerged in bucket serving as a water reservoir.
Water Types:
Unit A (Control): Supplied with untreated water rich in algae (“green water”).
Unit B (Treated): Supplied with the same algae-rich water, pre-treated using oxalic acid and lime.
Procedure:
Prepare two systems with identical design and operational parameters.
In Unit A, fill the water tank with untreated algae-rich water.
In Unit B, pre-treat the algae water using:
Oxalic acid is sufficient to disrupt algal cell walls.
Lime to raise water pH, creating a unfavourable environment for algal survival and reproduction.
Circulate the respective water types continuously over the cellulose pads using the submersible pumps.
Observation:
Visual algal growth on pad surfaces.
Continue monitoring over a period of one month, noting changes.
Conclusion: If a pad over which treated water is supplied doesn’t form alga then this treated water will be used to supply over pads in polyhouse.
Date: 14/4/25
Below I have share the documentation of 1 st discussion on heat measurement. This is basically theoritical ideas of how heat is transferred in polyhouse and get trapped increasing the temperature inside.
16/4/25
2th discussion on heat measurement
19/4/25
3 rd discussion on heat measurement. This calculation is done by recording actual temperature over a period of time
22/4/25
On April 22, 2025, Nimish Sir visited the VA campus to review our polyhouse heat measurement data and calculations. Following the presentation, we decided a timeline for installing foggers and data loggers to initiate controlled experiments.
Installation Timeline:
- By April 25: Complete the installation of fogging systems within the polyhouse.
- April 26–27: Hardware connections and arduino code uploading over esp32 boards; and installation of data loggers at different positions in polyhouse.
- April 28–29: Commence data recording following the experimental procedure:
- Allow the polyhouse to reach its peak maximum temperature.
- Activate the fogging system to reduce the internal temperature to match or fall below the external ambient temperature.
- After deactivating the foggers, observe and record the rate at which the internal temperature rises.
This procedure aims to analyze the polyhouse’s heat gain dynamics, particularly during periods of intense solar radiation, to better understand and manage its internal climate as we have to lower down internal temperature.
- By 1-3 of May
To determine the cooling efficiency of the fogging system in the polyhouse, a systematic procedure involving water application measurement and temperature monitoring is proposed:
1. Measurement of Water
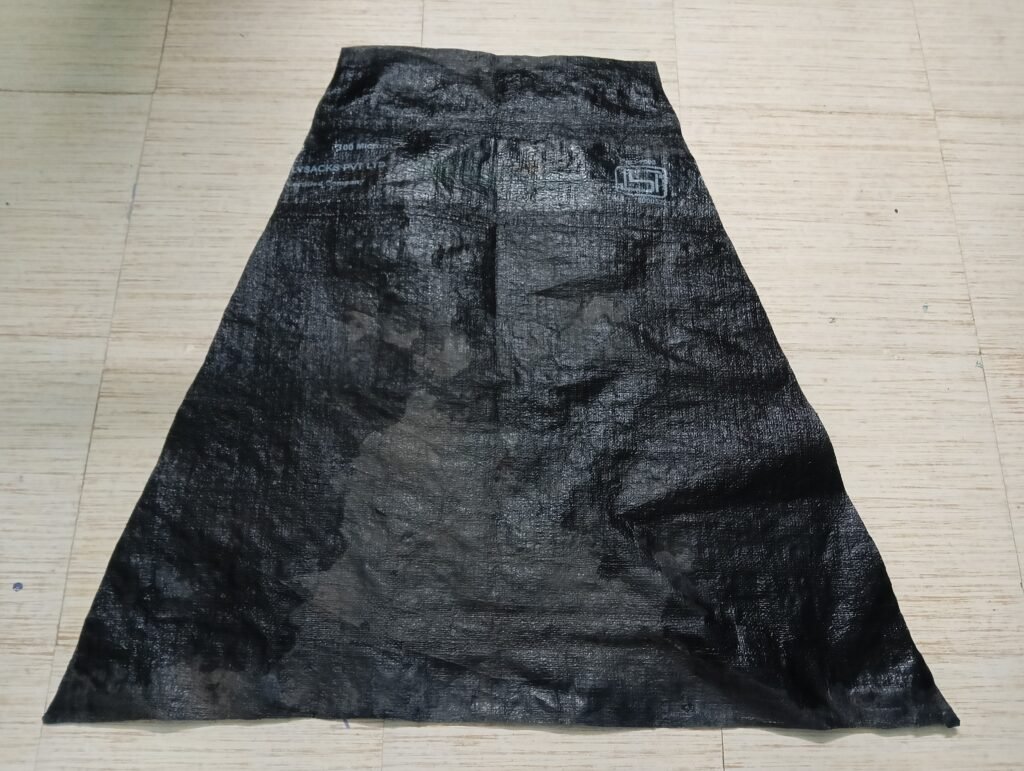
- Preparation: Place absorbent materials, such as blankets or sacks, uniformly over the polyhouse floor to capture water droplets emitted by the foggers.
- Fogging Operation: Activate the fogging system for a duration of 10–15 minutes.
- Post-Fogging Measurement: Immediately after fogging, carefully collect and weigh the wetted absorbent materials without allowing any water to drip off. This weight indicates the amount of water deposited directly onto surfaces.
- Water Usage Assessment: Record the water level in the fogger supply tank before and after the fogging operation to determine the total volume of water utilized.
- Evaporated Water Calculation: Subtract the volume of water collected on the absorbent materials from the total water used to estimate the amount of water that evaporated into the air.
2. Determination of Cooling Rate:
- Temperature Monitoring: Measure the internal air temperature of the polyhouse immediately before activating the foggers and continuously monitor it during and after the fogging process.
- Cooling Rate Calculation: Calculate the rate of temperature decrease (ΔT) over the time interval (Δt) during which the foggers are active using the formula: ΔT/Δt
This methodology provides the fogging system’s performance in reducing polyhouse temperatures.
24/4/25-26/4/25
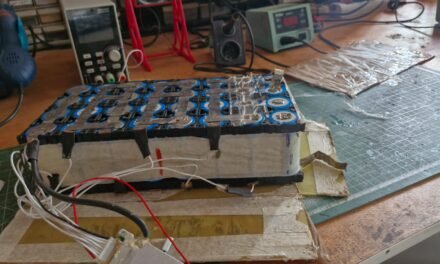
On 24/4/25 recieved 10 data loggers, first I did hardware connections then uploaded arduino code over ESP32 board.
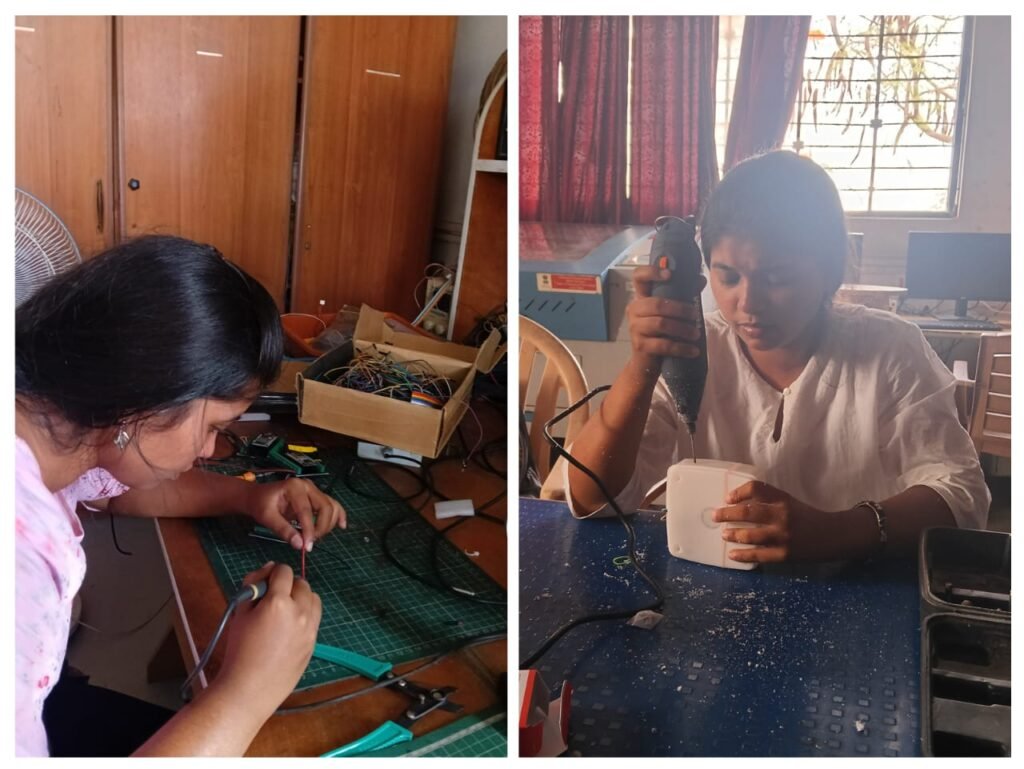
Fig. Hardware connections of Dataloggers
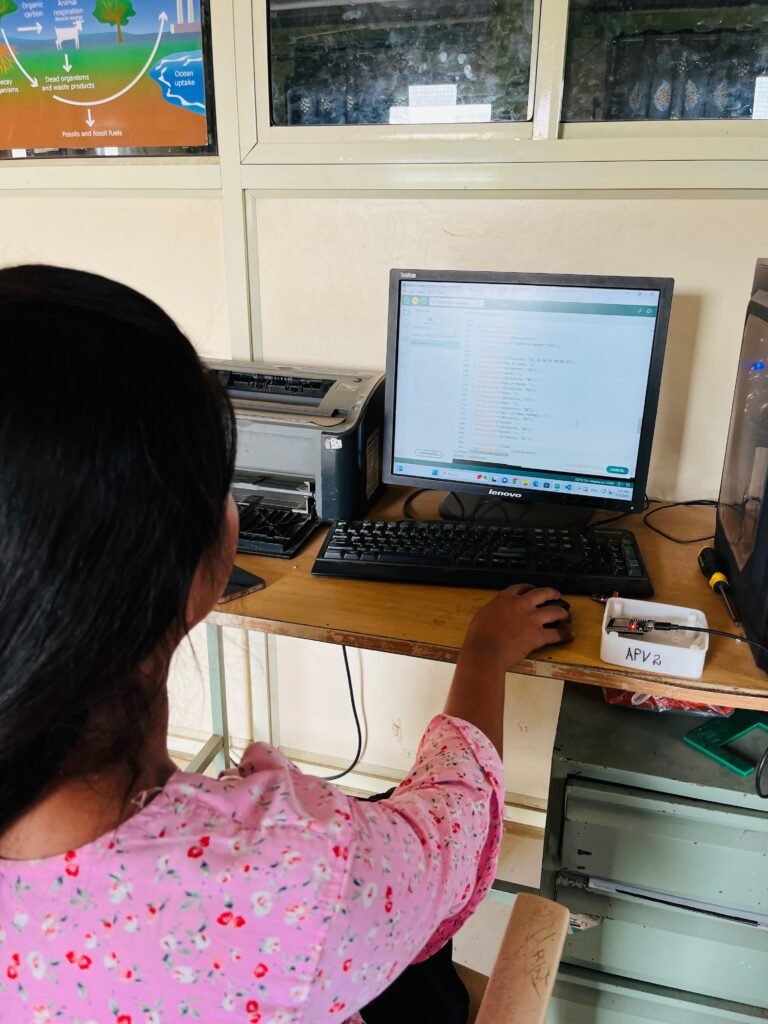
Fig. Compiling Arduino code on ESP32 boards.
27/4/25
Three poles were installed for fixing dataloggers, with one pole placed in each of the three central sections of the poly-house. This installation was done with the help of Aayush and Chaidwik.
28/4/25
Gopal did wirings for dataloggers and fixed dataloggers to poles
29/4/25
Recorded temperature curve data by reducing temperature by foggers till the outer temperature or below that and then analyse how temperature increases over a peak time when sun is on zenith. According to timeline we were to finish this experiment about 27-28 th, but due to delay in datalogger installation I recorded readings today, when I started foggers the temperature was 65 degree C and further temperature reduced till 45 degree celsius with humidity 80% . This delta of 20 degrees got within 12 mins by foggers, the temperature did’nt fell below 45 degree C even if outer temperature was 38 degree C with humidity of 17 %. Temperature didn’t reduced due to steady state of polyhouse, heat accumulated in polyhouse and there was limited internal air circulation which made it difficult to reduce temperature.
Below is the link to google sheet
So, it was decided to place a fan for internal air circulation and repeat the same readings.
7/5/25
I have attached link to discussion note and calculations for determining CFM of fans to be installed.
https://docs.google.com/document/d/1Hv3RJ3EMfanzhD_cqSiZSKfnBtXBf4nIpoV7QxySjxM/edit?usp=sharing
This note shows that at 1000W/m^2 solar irradiance the heat traps in polyhouse is 12.8 kj/s to remove this heat the air flow should be 8475 approx. 8000 CFM.
10/5/25 – 12/5/25
Objective:
To calculate the required CFM of fans for maintaining optimal temperature conditions (up to 35°C) in a polyhouse by quantifying heat gain (practically by performing experiment) and determining necessary airflow rates in CFM.
Method:
The experiment involved cooling the polyhouse using foggers, fans, and adjusting side vents. Temperature rise was recorded from a lower temperature to 35°C, and heat gain was calculated to determine the required airflow rate (CFM) so that the temperature inside polyhouse will remain to 35 degree celsius only even at higher temperatures outside.
Procedure
- Cooling Phase : Polyhouse temperature was reduced using foggers, fans, and side vents.
- After getting temperature reduce point the foggers and fan were deactivated, vents were closed and to avoid evaporation of water from soil ; surface was covered with HDPE sheet as HDPE sheet is a bad conductor of heat. The reason behind covering the surface by HDPE sheet is evaporation could consume heat (latent heat of vapourization) and slow down the temperature rise. Covering the surfaces isolates the heating process from this effect and gives more accurate temperature rise data.
- Temperature rise measurement : Temperature increase was recorded until reaching 35°C.
- Heat gain calculation : Total heat gain was calculated based on temperature rise data.
- CFM determination : Required CFM was determined based on calculated heat gain.
Following is the link to data and calculation based on it.
Heat Gain Calculation
The experiment yielded a heat gain of 2.99 kJ/s that to on a sunny day, which was lower than the calculated value of 12.8 kJ/s under 1000 W/m² solar irradiance.
To remove this 2.99 kj/s of heat the air flow required and exhaust fan flow rate required in CFM.
We will use the same heat transfer formula Q=m˙⋅cp⋅ΔT to find out mass of air
Q = heat trapped in kj/s = 2.99 Kj/s
Cp = specific heat capacity of air = 1.005 Kj/s
ΔT = (outer air temperature – internal air temp) = (30 – 27.5) = 2.5
m = mass of air
2.99 = m x 1.005 x 2.5
m= 2.99 kg/ 2.51 kg per m^3
m= 1.19 m^3/s
Air flow = 1.19 m^3 / 5.5 m^2 = 0.21 m/s
m = 1.19 m^3/s which is equal to 2521.46 CFM (Practical value)
Based on the heat gain values, the corresponding CFM requirements were:
– Approx. 8000 CFM for 12.8 kJ/s heat gain (calculative value)
– Approx. 2000 CFM for 2.99 kJ/s heat gain (practical value)
Fan Selection
Considering these values, it was decided to install fans with a CFM rating of 4000, which is approximately half of 8000 CFM (calculative value) and double of 2000 CFM (practical value).
Date : 27/05/25 – 28/05/25 – Testing CFM of exhaust fan
As we know that it is decided to install 8 fans of 500 CFM each in staggered way. So we searched fans of 500 CFM but we didn’t got the stated 500 CFM on fan as specification. The specifications were flow rate and rpm, so we got one fan with flow rate 1000 m^3/hr. Calculated CFM by converting m^3/hr to CFM. Here how I did:
1 m^3/hr = 0.5886 CFM
So,
1000 x 0.5886 = 588.6 CFM
This was calculative data, so to confirm the actual CFM of fan we decided to test the CFM of fan practically and if the CFM matches than install the fans.
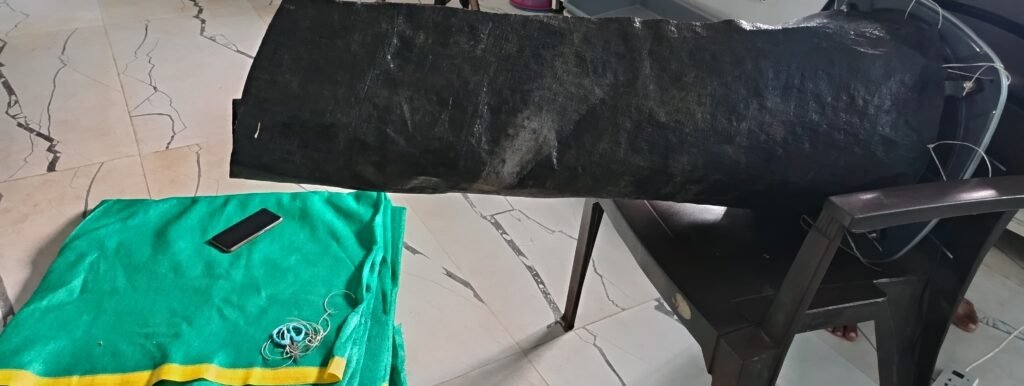
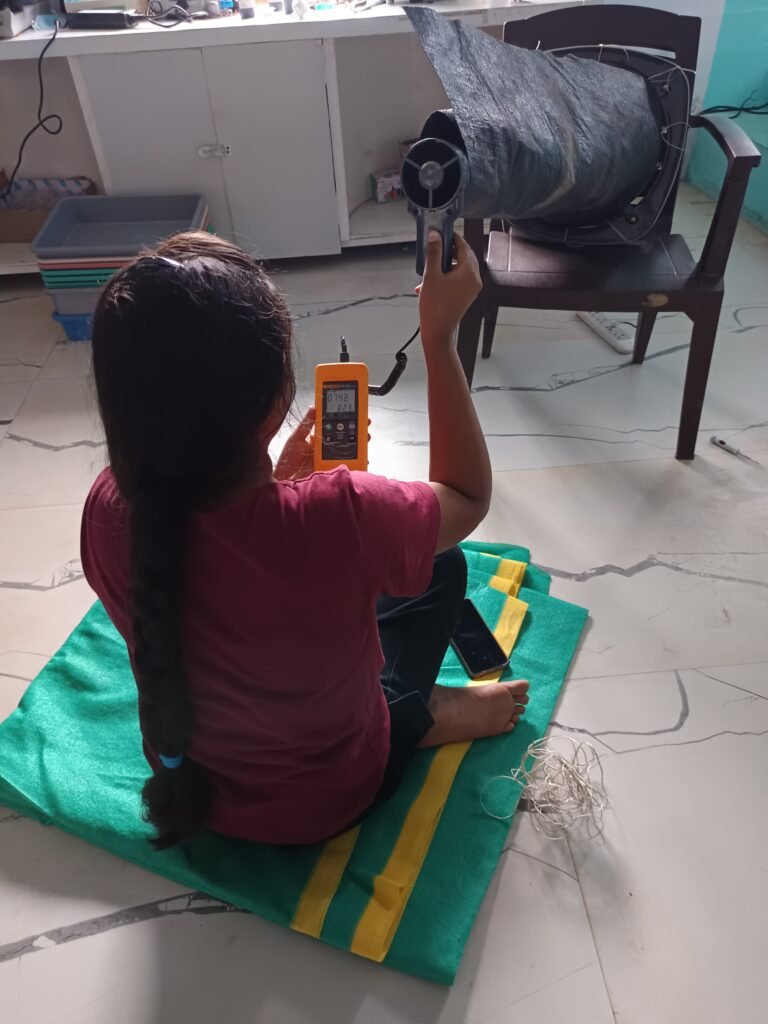
Procedure:
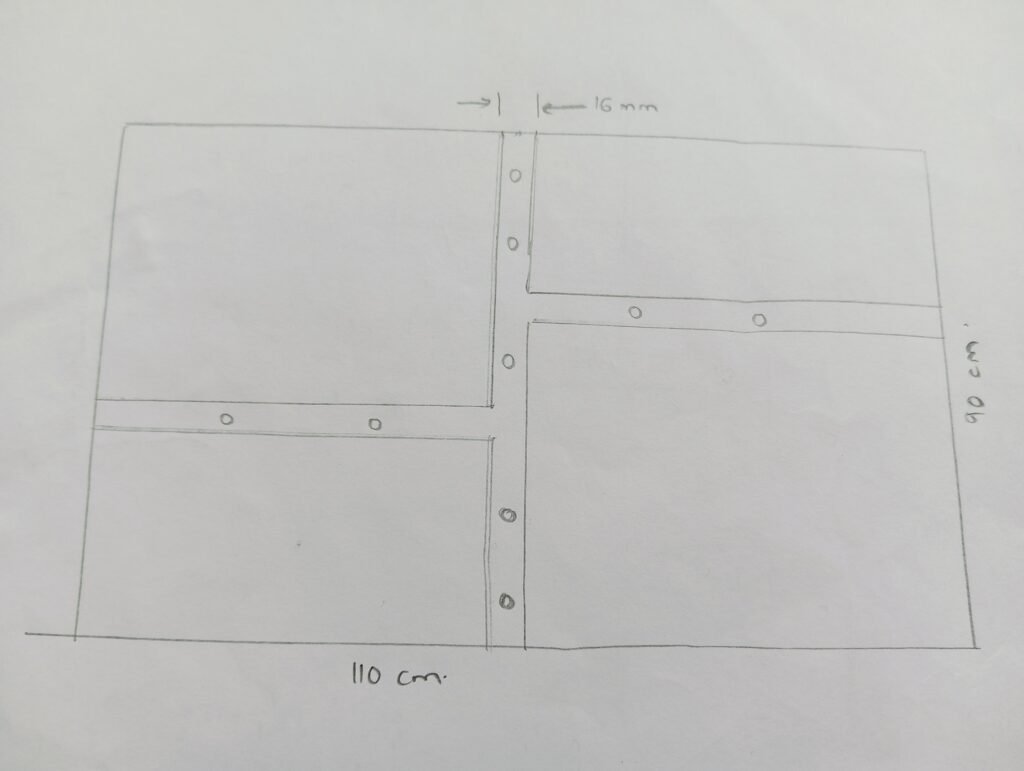
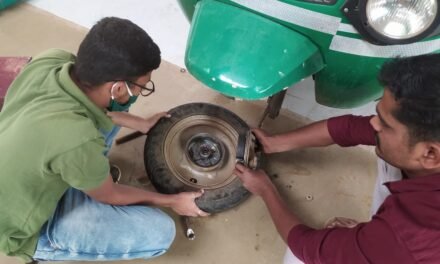
- Fabricate frustum from HDPE sheet in such a way that the diameter of one end should be equal to diameter (76.2 cm) of exhaust fan outlet and diameter of another end should be equal to diameter (7.5 cm) of anemometer fan opening.
- Maintain a straight length between 2 ends equal to 3 times of the exhaust fan’s outlet diameter to create laminar airflow at the measuring end.
- Securely attach the large end of the frustum to the exhaust fan outlet, ensuring an airtight seal.
- For checking CFM first set the cross-sectional area of smaller end, then set CFM screen on anemometer.
- Position the anemometer probe at the small end so it measures airflow without leakage around the edges.
- Run the exhaust fan and stabilize airflow for atleast 5-8 mins. to ensure steady readings.
- Record air flow.
Result :
726 CFM of airflow was recorded practically.
9/6/25-14/6/25:- Exhaust Fan installation in Poly-house
We have installed a total of 4000 CFM airflow rate using 8 exhaust fans, each with a capacity of 500 CFM, strategically positioned in staggered mode throughout the opposite wall of cooling pads in poly-house to ensure even airflow distribution and prevent heat accumulation in specific areas, thereby maintaining a uniform climate.
Reason behind installing fans in staggered mode instead of single large fan in center :
The decision to install multiple small exhaust fans (500 CFM each) in staggered mode instead of one large exhaust fan is, multiple small fans in staggered mode ensure that air is uniformly drawn across the entire length and width of poly-house , reducing dead zones, helps to create balanced airflow and prevent hotspot zones. Considering energy efficiency only the required no. of fans can be operated based on real-time temperature and humidity. This is more efficient than continuously running a single large fan of equivalent power.
For better understanding effects of single large fans vs multiple small fans refer to below schematic diagram of same.
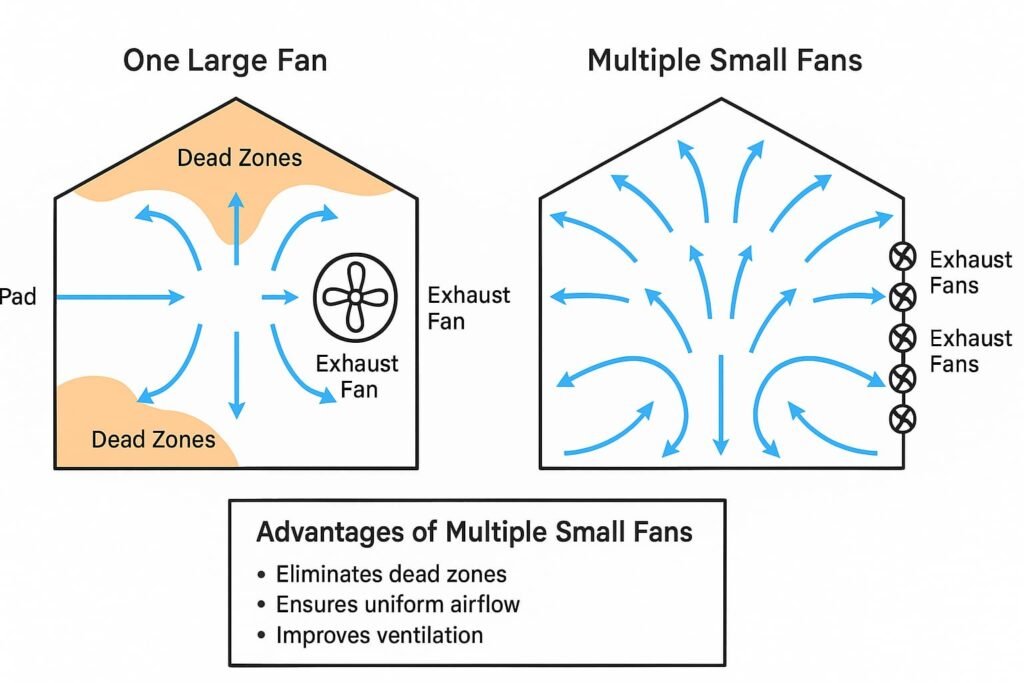
Fig. Conceptual schematic representation to compare betterment of Single large fan vs Multiple small fans
fig. source: Custom schematic created using OpenAI’s image generation tool (2025)
Fan Positioning layout :
Fig. Layout figure for positioning of fans
In above figure fan 1 and fan 2 are installed in upper section to remove heat accumulated in hemisphere. Fan 3,4,5,6,7,8 are installed on a wall in staggered mode just opposite to the cooling pads, aligned at the same height as the cooling pads, to ensure removal of humid air from all zones within.
Fig. While installing fans
Fans were installed and electrical connections were done with the help of DBRT students. Separate regulator was given to each fan for operating speed.
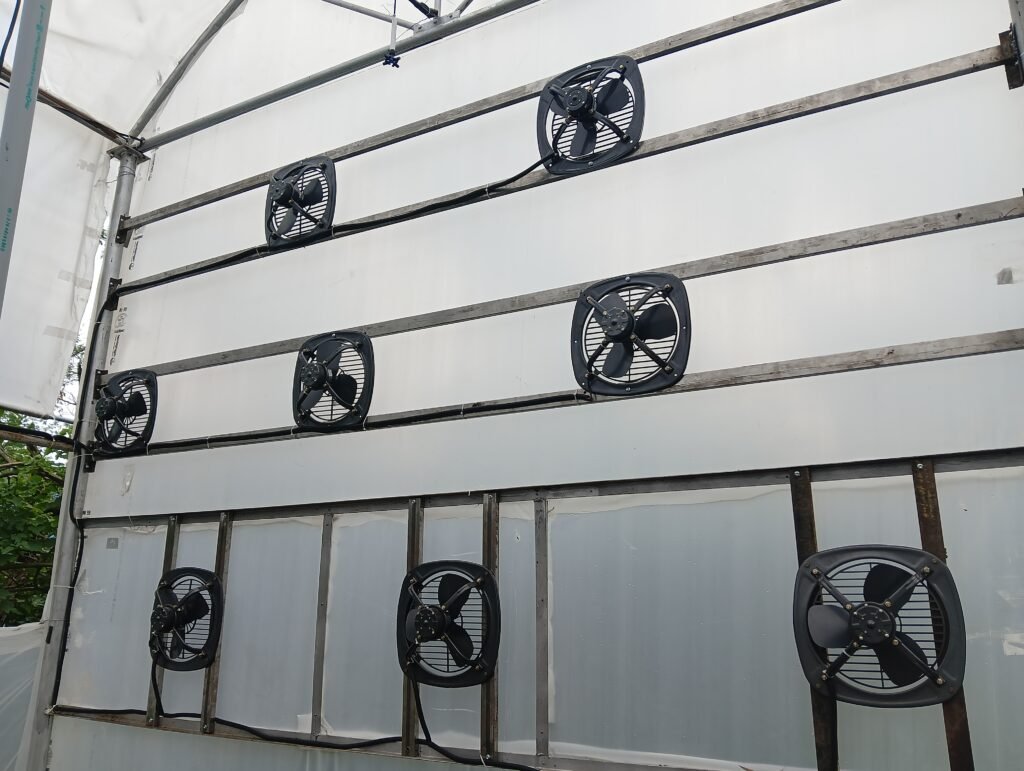
Fig. Fan set-up completed
17/6/25–
Had a call with Nimish sir in presence of Abhijeet and Ranajeet sir regarding microclimate readings
MoM of call :
- If humidity is too high, suspend micro-climate measurements till we get dry spells.
- Prior to that, to be ready with everything, so that fan- pad measurements canalso be done in same dry weather.
- Arrange sealingof side rollable vents.
- o get pad window opened and velcrowed and use the same for venting and fogging if internal temperature is too high.
- To work on experiment for choking of foggers.
- To communicate final method of measurement for fogger efficiency and keep it in written.
23/6/25 – 2/7/25 : Study of Permanent hardness
Introduction :
Fogger systems are widely used in polyhouses, greenhouses, and humidity control applications to spray ultra-fine mist. Over time, these foggers gets clogged or choked due to mineral deposits, especially when using hard water.
This experiment focuses on permanent hardness, specifically by adding calcium sulfate (CaSO₄) to RO water to simulate the type of mineral scaling seen in real agricultural conditions.
What is permanent hardness ?
Permanent hardness is the type of water hardness caused by calcium and magnesium salts that are not removed by boiling.
These salts mainly include:
- Calcium sulfate (CaSO₄) – low solubility
- Magnesium sulfate (MgSO₄) – very high solubility
- Calcium chloride (CaCl₂) – high solubility
- Magnesium chloride (MgCl₂) – very high solubility
Reasons for Studying Permanent Hardness:
1. It Simulates Real Field Conditions
- Most farmers use borewell or untreated water, which contains permanent hardness salts like CaSO₄ and MgSO₄.
- These salts do not get removed by boiling and accumulate in foggers over time, forming hard, chalky scale.
2. It Is the Main Cause of Clogging
- When foggers spray water, evaporation leaves behind minerals.
- Calcium sulfate (CaSO₄) form hard deposits that block fine nozzles.
- This directly reduces misting efficiency, cooling, and uniformity.
3. It Helps Evaluate Cleaning Methods
- By intentionally clogging foggers with permanent hardness, we can test:
- Which cleaning chemicals work best
- How often cleaning is needed
Fogger choking experiment by using CaSO4 (Calcium Sulphate)
Fogger nozzles get choked due to the presence of salts like magnesium, calcium, sulphates, chlorides, bicarbonates in water . In this experiment the choking behaviour is observed in actual field conditions. So, that we can set cleaning methods through different ways.
Choking foggers by CaSO4 represents permanent hardness caused by calcium and sulphates. This salts does not fully dissolve in water as it has very low solubility compared to other salts present in water, even if water is boiled the hardness remains, so for this reason we chosed CaSO4 for efficient choking of foggers.
Preparation of CaSO4 solution : CaSO4 Concentration (ppm) = 2100 ppm = 2.1 gm/litre (for quick choking of foggers selected highest concentration of CaSO4 )
For 700 litres of RO water = 0.0021 kg x 700 litres = 1.47 kg of CaSO4.
Why RO water and not normal water was used : RO water is used for experiment cause RO water has low TDS, that means it does not contain salts like calcium, sulphates, chlorides, magnesium, bicarbonates. This makes it a controlled, clean baseline – so when CaSO₄ is added, almost how much mineral content is present is known. Whereas, normal water already has unknown and variable amounts of hardness salts.
RO water qualities –
pH – 5.98 EC – 24 us/cm TDS – 12 ppm
RO + CaSO4 water qualities –
pH – 6.81 EC – 1445 us/cm TDS – 722 ppm
This hike in EC and TDS ensures blockage of foggers.
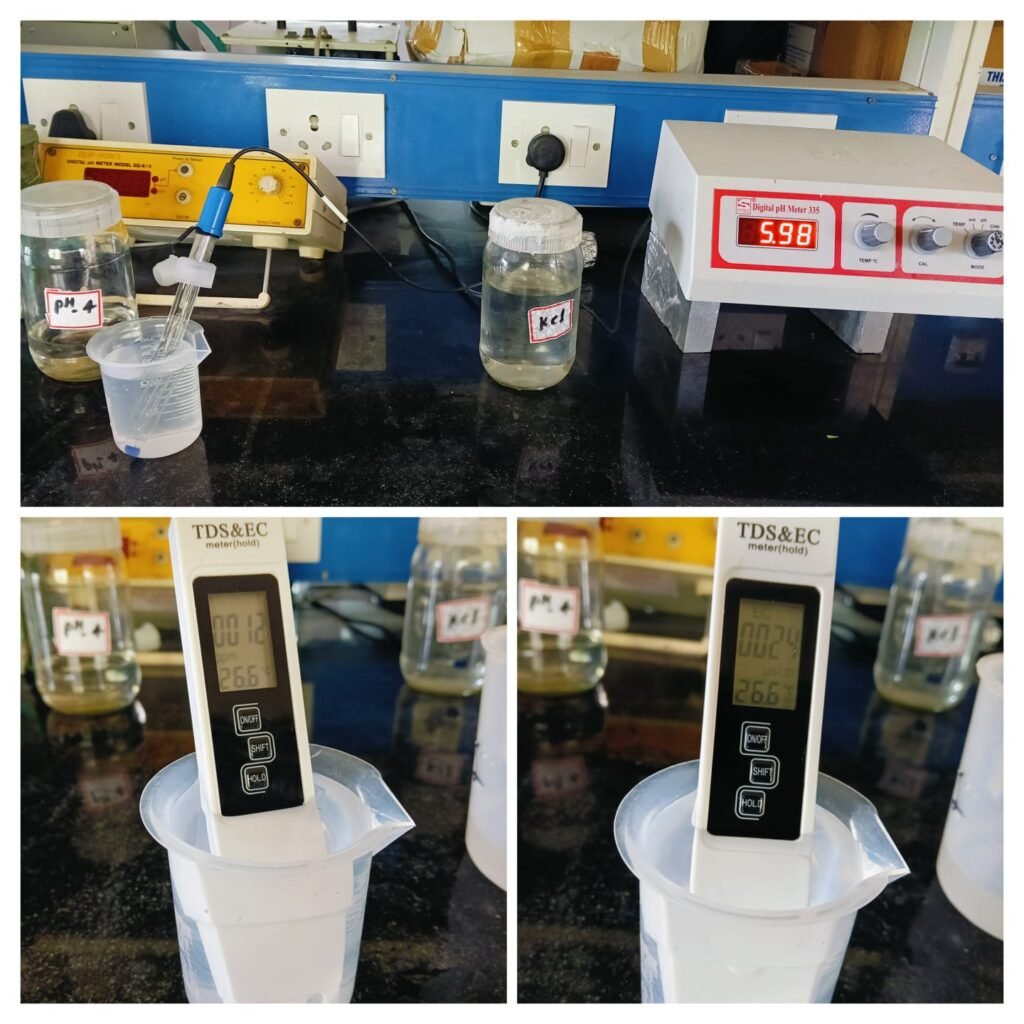
Fig. Measuring pH, EC and TDS of RO water
Experimental setup procedure :
- A 1000-litre capacity IBC tank was selected and its top cover was cut open. The tank was then filled with 700 litres of RO water for the experiment, 1.47 kg of calcium sulfate (CaSO₄) was added to the water.
- A cross-shaped (plus) structure made of lateral pipes was fabricated and mounted over the open top of the IBC tank for the installation of foggers. 9 foggers were installed for experiment.
- 1 HP motor was connected to pump the solution from the tank through PVC piping into the lateral structure, enabling water delivery to the foggers.
- With this, the experimental setup was completed. Now operate the foggers to get choke.
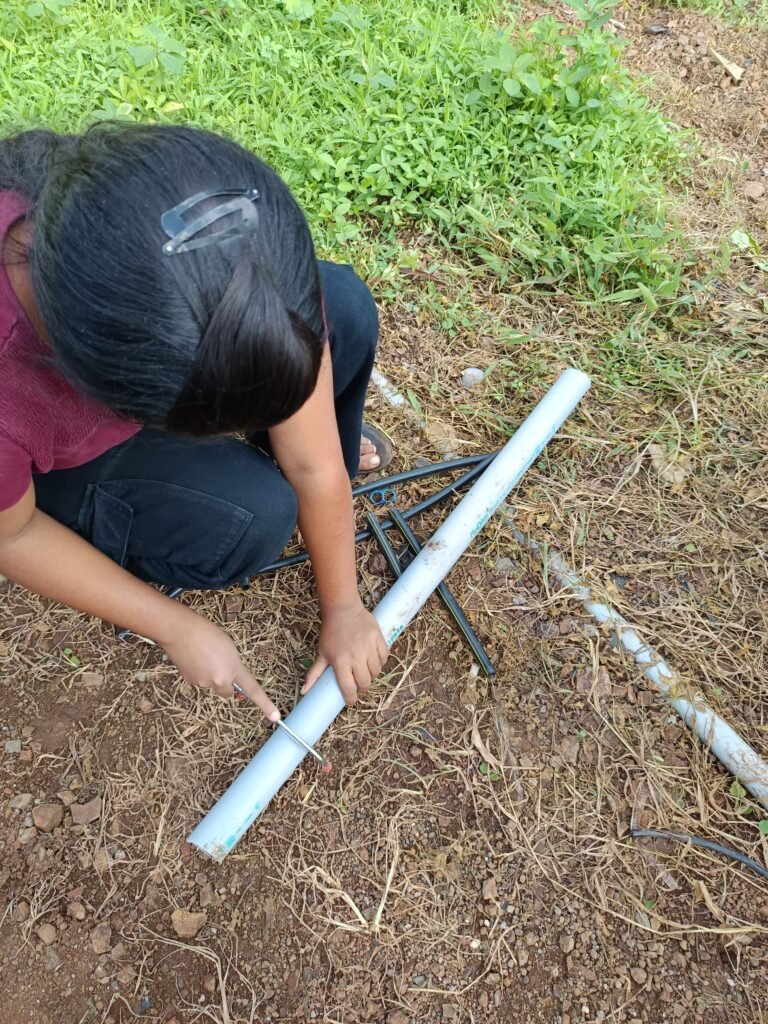
Fig. While cutting PVC pipe for preparing water supply connections
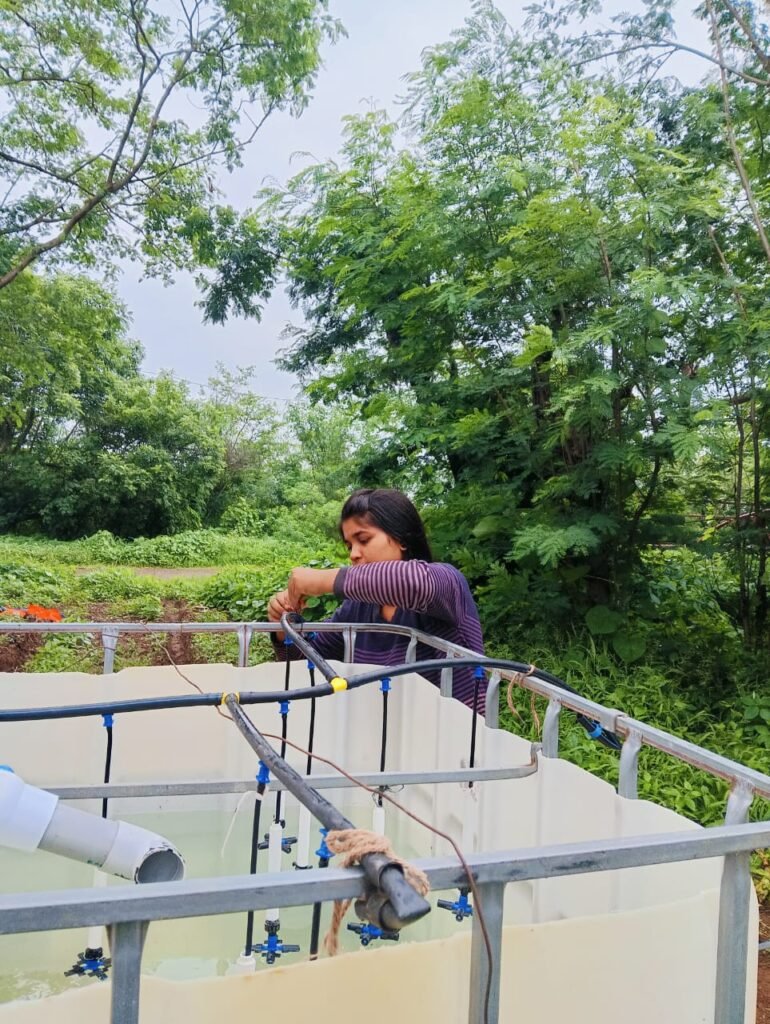
Fig. While fixing fogger structure over IBC tank
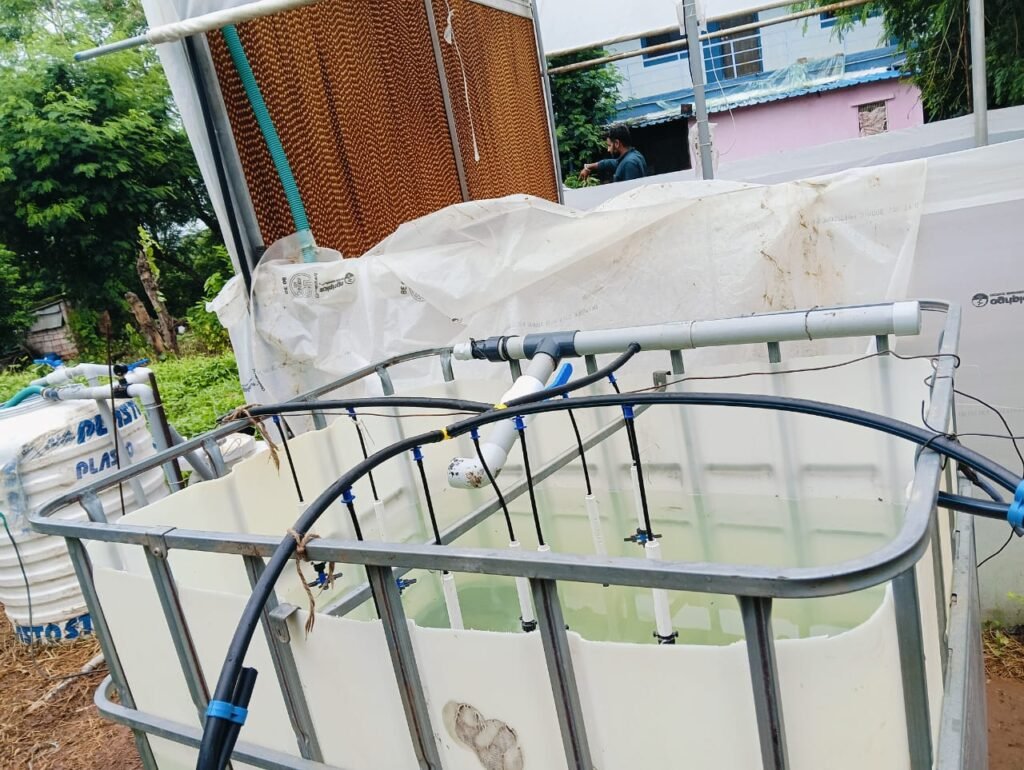
Fig. Experimental setup
2/7/25-7/7/25
During motor setup, several issues were aroused. However after addressing the problems setup was ready to start.
7/7/25-17/7/25
Result:
The foggers were operated continuously for 8 hours per day. After 2–3 days, a reduction in mist output was observed. By the eighth day, the foggers were completely clogged, and white salt deposits were found. This marked the completion of the fogger clogging experiment.
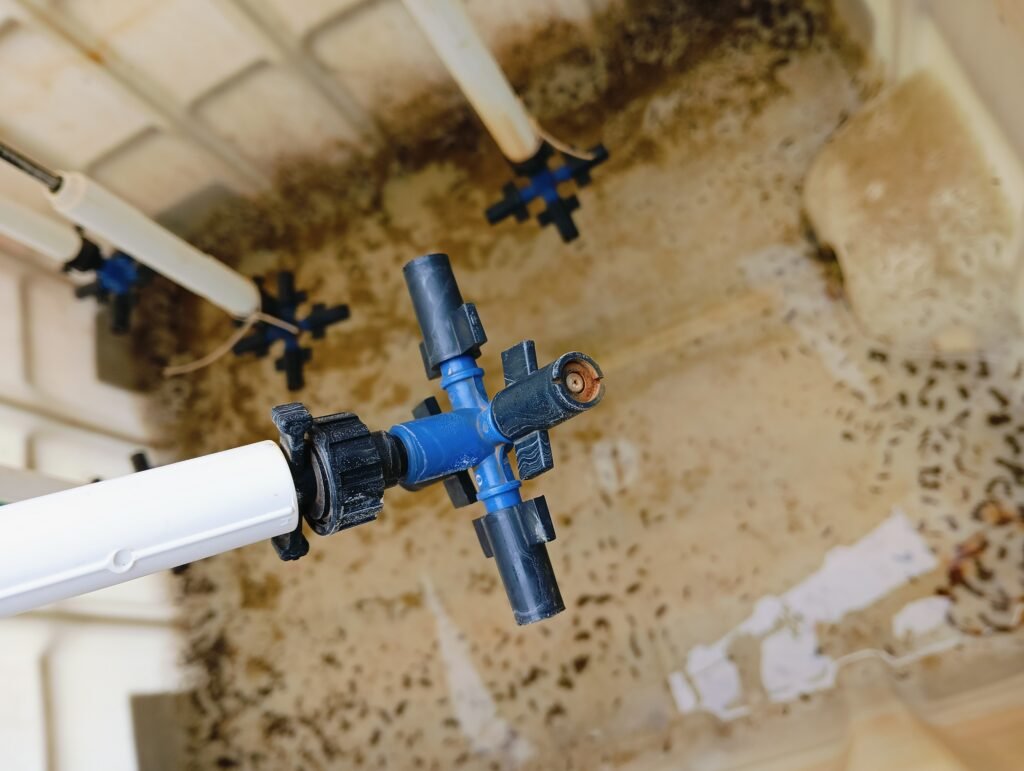
fig. Salt accumulation on foggers. A blocked fogger
This experiment I have stopped here due completion of my fellowship tenure.
17/7/25
Treatment solutions for Algae formation on cooling pads
Due to the continuous dripping of water on the cooling pads, algae layers formed over time. These algae layers blocked the cooling pads, reducing their cooling efficiency. To address this issue, we designed an experiment to observe the impact of bleaching powder on algae growth.
Two setups were prepared:
In the first setup, we added 50 grams of bleaching powder to 15 litres of algae-infested (green-colored) water.In the second setup, only algae-infested water was supplied without any treatment.Both systems were activated simultaneously.
The objective was to observe whether the bleaching powder prevents algae formation at the water source or if algae still develop on the pads.
20/7/25
3. Cooling Efficiency Test of Super Fogger
To test the cooling efficiency of the super fogger, by enclosing the polyhouse from all four sides. Once the internal humidity reached 40–50% and the temperature rose to 45–50°C, the readings should start for fogger efficiency. The foggers’ efficiency was calculated by measuring the total temperature drop (ΔT) over time.Data links for fogger efficiency are attached below:
In above data, temperature drop of 8.14 degree celsius in 16 mins is observed means cooling efficiency is 0.50 degree/min, when outer temp was 29 degree celsius and humidity was 65%
In above data, temperature drop of 4.57 degree celsius in 34 mins is observed means cooling efficiency is 0.13 degree/min, when outer temp was 29 degree celsius and humidity was 66%.
29/7/25-30/7/25
An open house exhibition was held at Vigyan Ashram on the 22nd death anniversary of the Founder, Dr. S. S. Kalbagh. I presented my project at the exhibition. I was responsible for preparing posters, a video, and a PowerPoint presentation related to my work.
During the exhibition, school children, college students, farmers, and local visitors came to my stall. I had the opportunity to explain my project to a diverse audience. It was a valuable learning experience, especially in improving my communication and presentation skills.
1/8/25-3/8/25
Data for cooling rate of three foggers were collected
- Jain 4-way fogger
- Super fogger (green)
- Cool net Pro Netafim fogger (light green)
| Sr. No. | Fogger type | Droplet size in microns | Operating pressure(kg/cm^2) | Stated flow rate (LPH) | Experimental flow rate (LPH) |
| 1. | Jain 4-way Fogger | 90 | 4 | 28 | 24 |
| 2. | Super fogger (green) | 69 | 3-3.5 | 21 | 19 |
| 3. | Netafim Cool net Pro 4-way (light green) | 65 | 4 | 22.4 | 20 |
Note-
- Make of foggers – https://www.jains.com/PDF/Catalogue/Sprinkler/Fogger.pdf
- Make of Super foggers- https://www.jains.com/PDF/Catalogue/Sprinkler/Super%20Fogger.pdf
- Make of Netafim foggers- https://www.netafim.com.au/bynder/2F4F46C9-C2FF-49EB-8831352BCD927D8F-netafim-coolnet-pro-product-sheet.pdf
- These discharge rates are essential to understanding how much water is introduced into the air for evaporative cooling and help estimate the latent heat absorbed during fogging.
Fogger cooling rate
| Sr no. | Fogger type | Temp drop (°C) | Time (min) | Drop rate (°C/min) | Water used (litres) |
| 1 | Simple 4-way fogger | 1.8 | 14 | 0.129 | 65 |
| 2 | Super fogger | 5.52 | 14 | 0.394 | 49 |
| 3 | Netafim fogger | 5.56 | 14 | 0.397 | 54 |
REPORT WRITING
I have attached my work report pdf. below.
Below is the work report submitted to GIZ and Sunseed APV.
