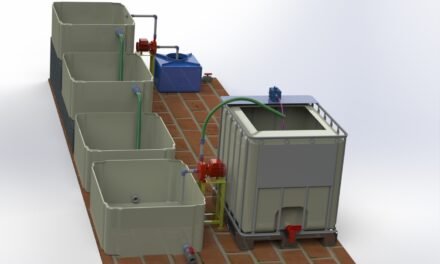
Objectives :
- Installing MBBR system for Hydroponics.
- Optimization Of Nitrate conversion.
- To optimize the formation of Calcium nitrate.
- To design MBBR system for proper growth of bacteria.
Introduction :
Nutrients required for the bacteria to grow.
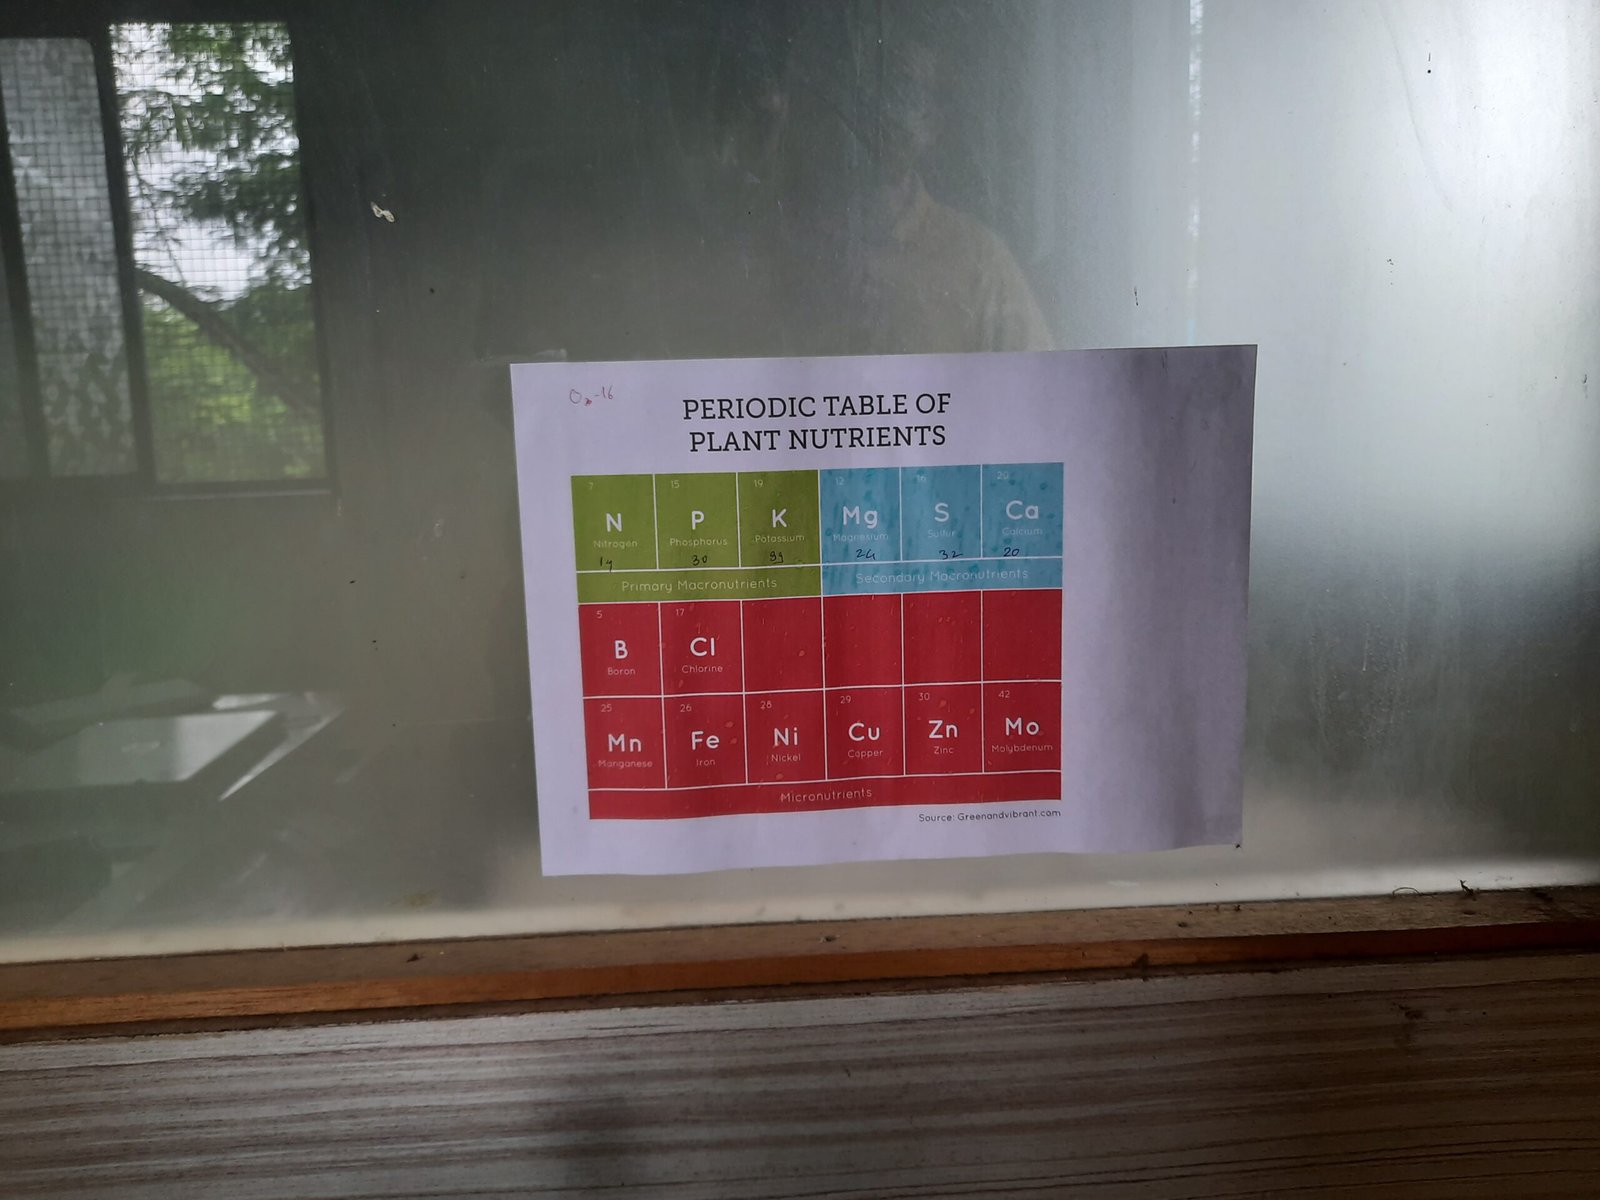
The essential nutrients for a plant or any microorganism bacteria to stay alive are among Nitrogen, Phosphorous, Pottasium, Magnesium, Sulphur, Calcium, Boron, Chlorine, Manganese, Iron, Nickel, Copper, Zinc and molybdenum.
As we are working on wastewater treatment we want these microbes to grow and form a colony so that they can clear the waste in the water. Therefore we should provide them with nutrients as mentioned above. In order for the bacteria to eat these nutrients they should be water soluble.
MBBR Process :
Moving bed biofilm reactor (MBBR) is a biological technology used for wastewater treatment process suitable for municipal and industrial application. Another common name is moving bed film reactor. It was invented in the 1980s. MBBR offer an economical solution for wastewater treatment.
This method makes it possible to attain good efficiency results of disposal with low energy consumption. This process is used for the removal of organic substances, nitrification and denitrification.
The MBBR system consists of an activated sludge aeration system where the sludge is collected on recycled plastic carriers. These carriers have an internal large surface for optimal contact water, air and bacteria.
The bacteria/activated sludge grow on the internal surface of the carriers. The bacteria break down the organic matter from the wastewater. The aeration system keeps the carriers with activated sludge in motion. Only the extra amount of bacteria growth, the excess sludge will come separate from the carriers and will flow with the treated water towards the final separator.
The system can consist of a one stage or more stage system depending on the specific demands. The specific bacteria remain in their own duty tank because of the fact that the carriers remain in only 1 tank, protected by screens.
The MBBR process can be used for a variety of different applications to attain the desired results, depending on the quality of the wastewater and the discharge regulations.
Industrial applications :
• Capacity increase
• Quality Improvement – BOD & Nitrogen Removal
• Fast recovery from Process Upsets
• Limited Footprint
• Future Expansion
• Minimize Process Complexity and Operator Attention
Benefits :
• Economical very attractive
• Compact (saves space)
• Maintenance-friendly
• Strong
• High volume load
• Simply to extend
• Financial savings on discharge costs
The Nitrogen Cycle
Nitrogen, the most abundant element in our atmosphere, is crucial to life. Nitrogen is found in soils and plants, in the water we drink, and in the air we breathe. It is also essential to life: a key building block of DNA, which determines our genetics, is essential to plant growth, and therefore necessary for the food we grow. But as with everything, balance is key: too little nitrogen and plants cannot thrive, leading to low crop yields; but too much nitrogen can be toxic to plants, and can also harm our environment. Plants that do not have enough nitrogen become yellowish and do not grow well and can have smaller flowers and fruits. Farmers can add nitrogen fertilizer to produce better crops, but too much can hurt plants and animals, and pollute our aquatic systems. Understanding the Nitrogen Cycle—how nitrogen moves from the atmosphere to earth, through soils and back to the atmosphere in an endless Cycle can help us grow healthy crops and protect our environment.
The nitrogen cycle is a repeating cycle of processes during which nitrogen moves through both living and non-living things: the atmosphere, soil, water, plants, animals and The nitrogen cycle is a repeating cycle of processes during which nitrogen moves through both living and non-living things: the atmosphere, soil, water, plants, animals and bacteria microscopic living organisms that usually contain only one cell and are found everywhere. Bacteria can cause decomposition or breaking down, of organic material in soils.. In order to move through the different parts of the cycle, nitrogen must change forms. In the atmosphere, nitrogen exists as a gas (N2), but in the soils it exists as nitrogen oxide, NO, and nitrogen dioxide, NO2, and when used as a fertilizer, can be found in other forms, such as ammonia, NH3, which can be processed even further into a different fertilizer, ammonium nitrate, or NH4NO3.
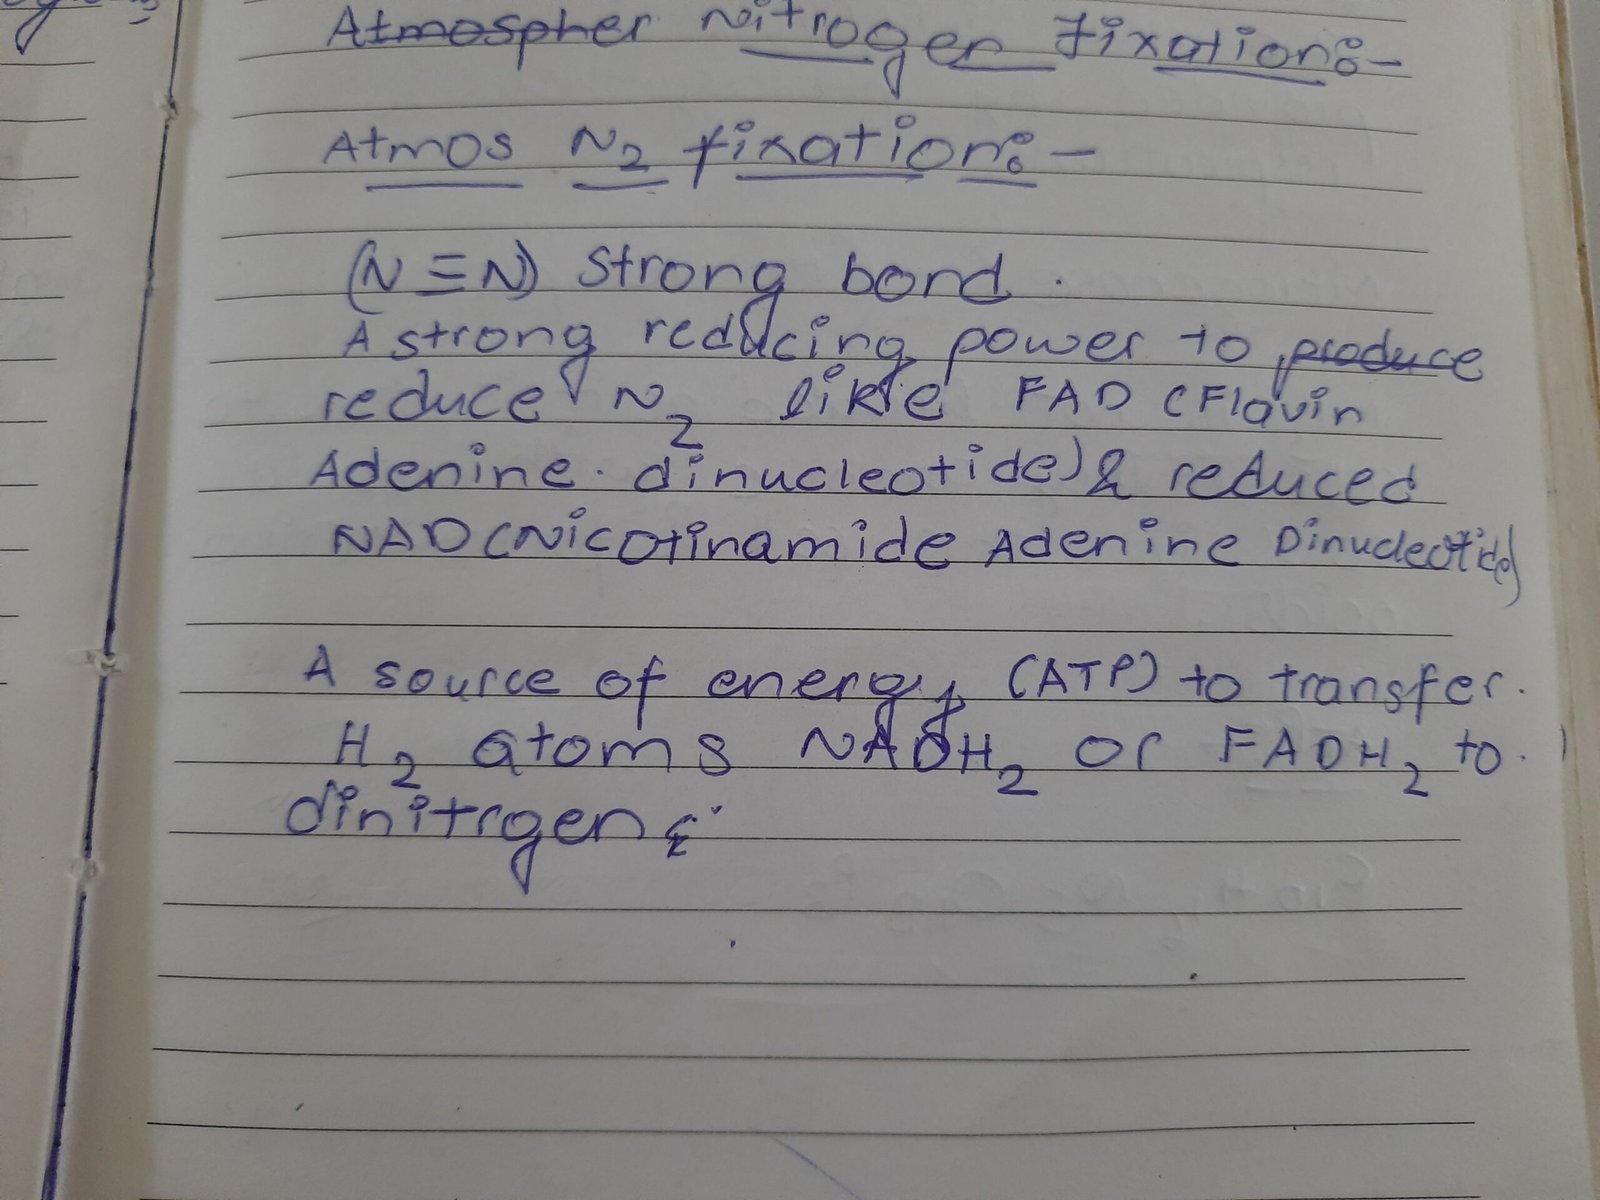
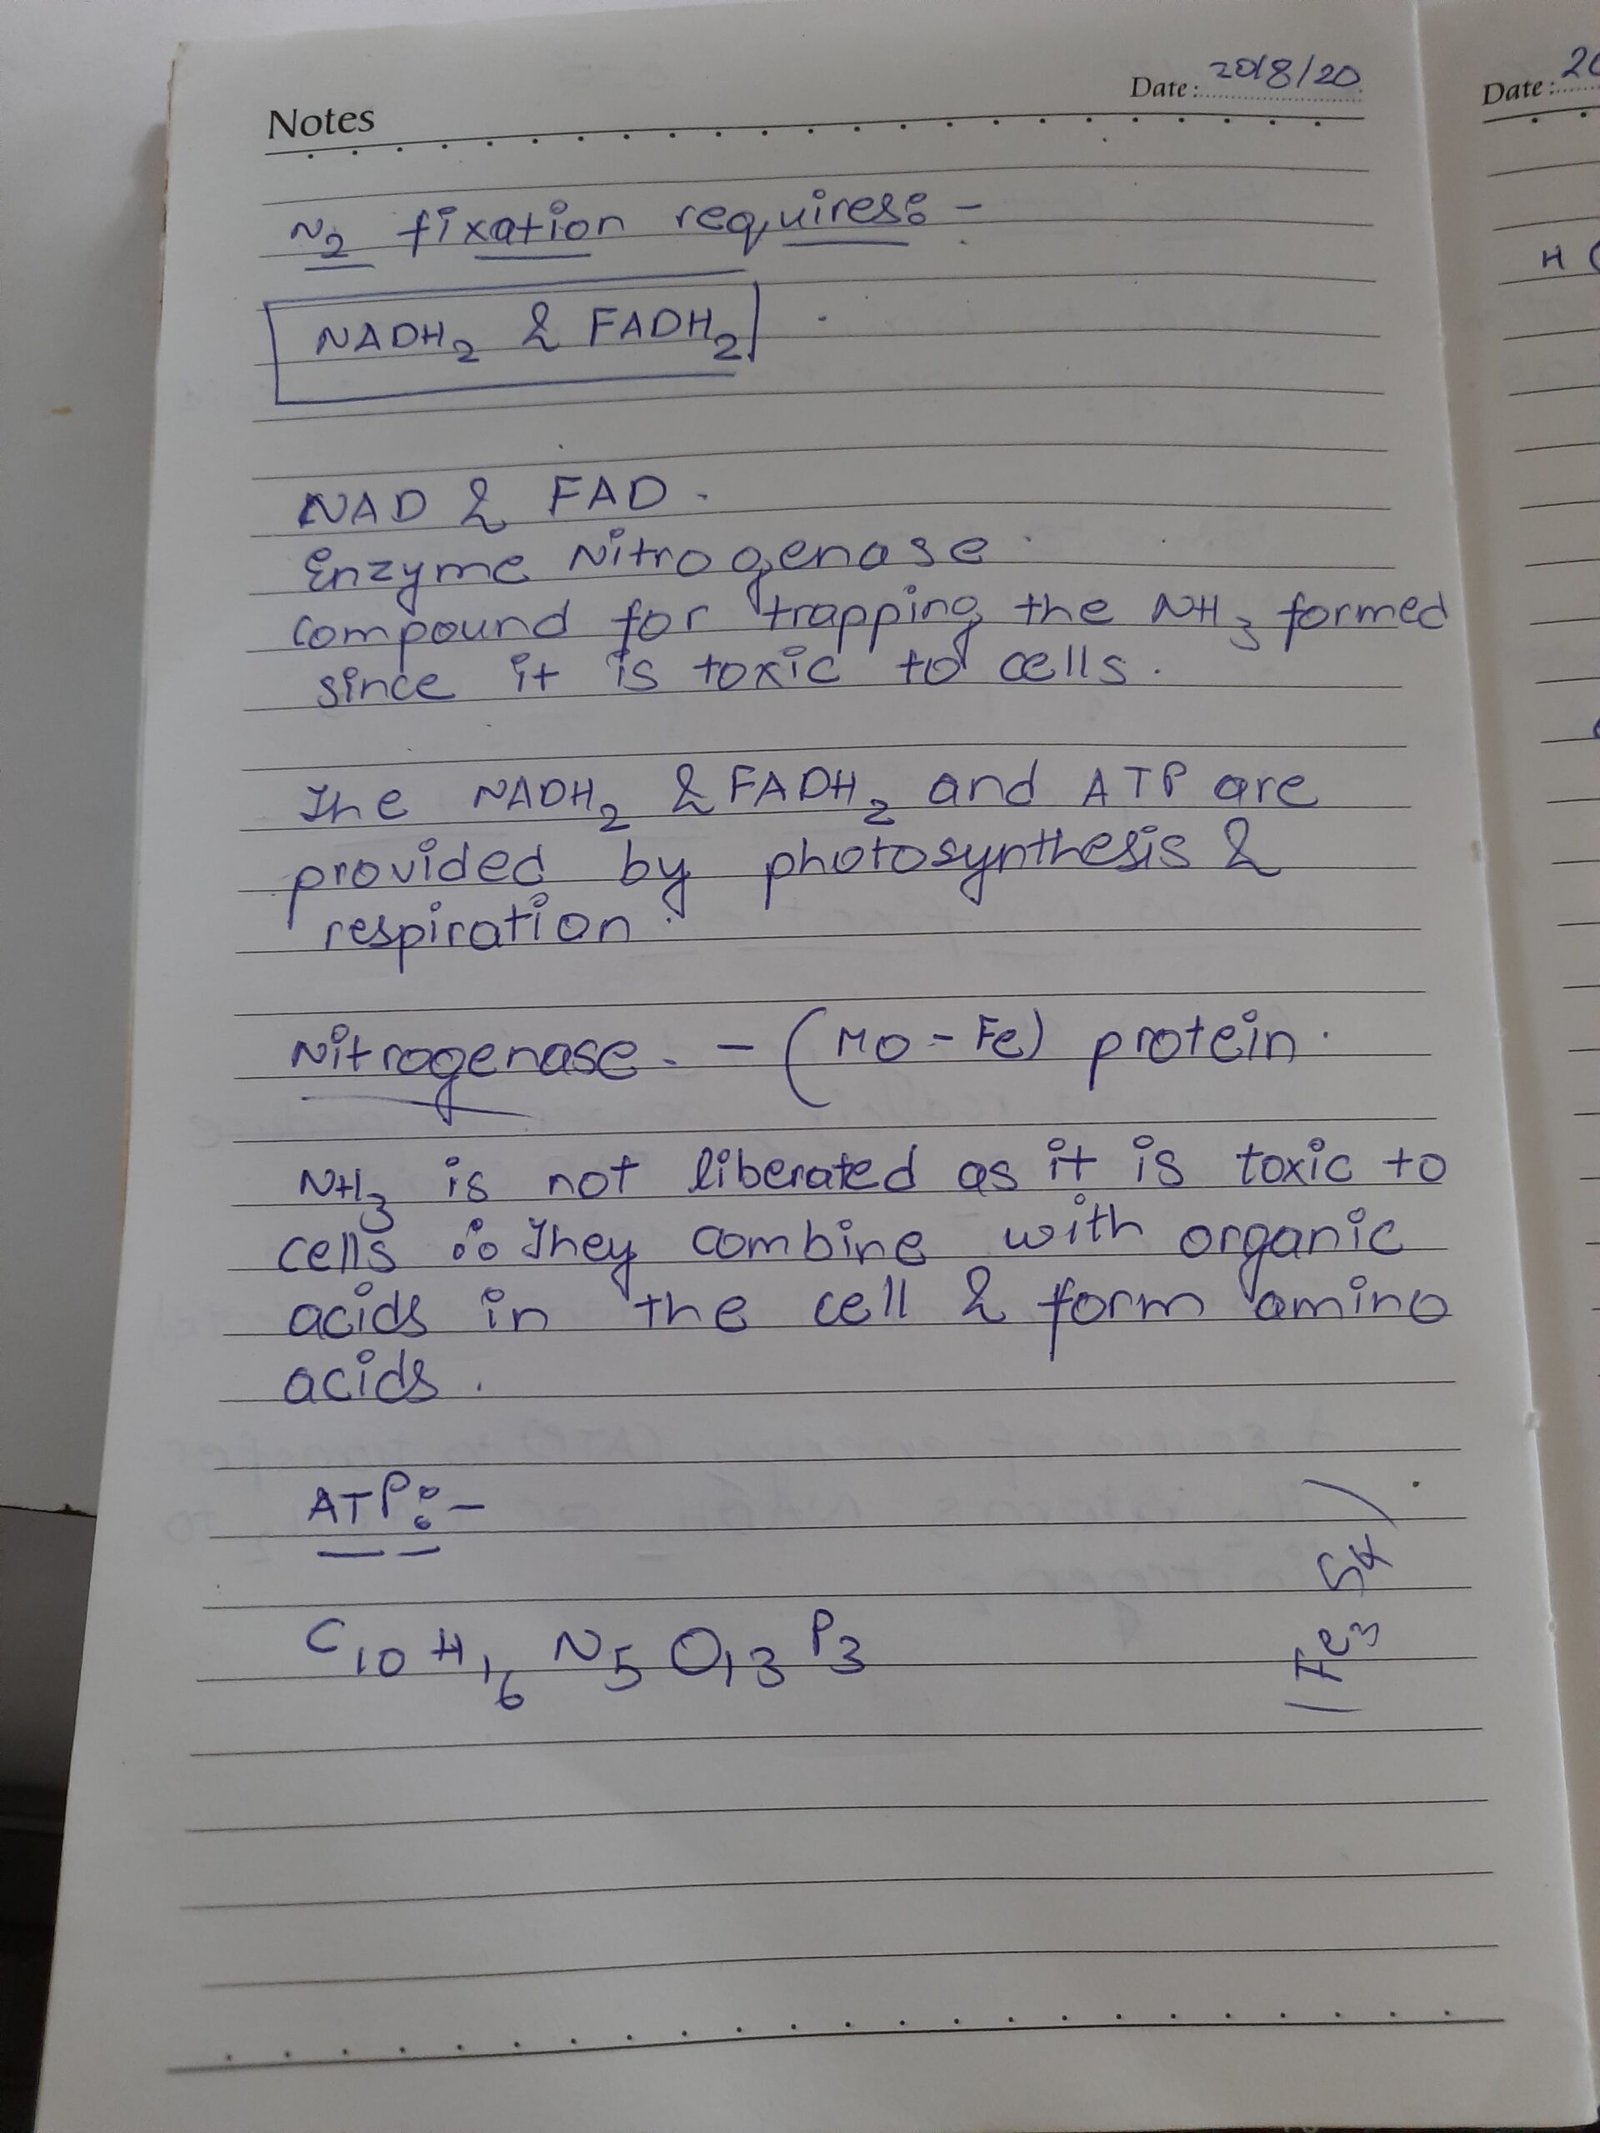
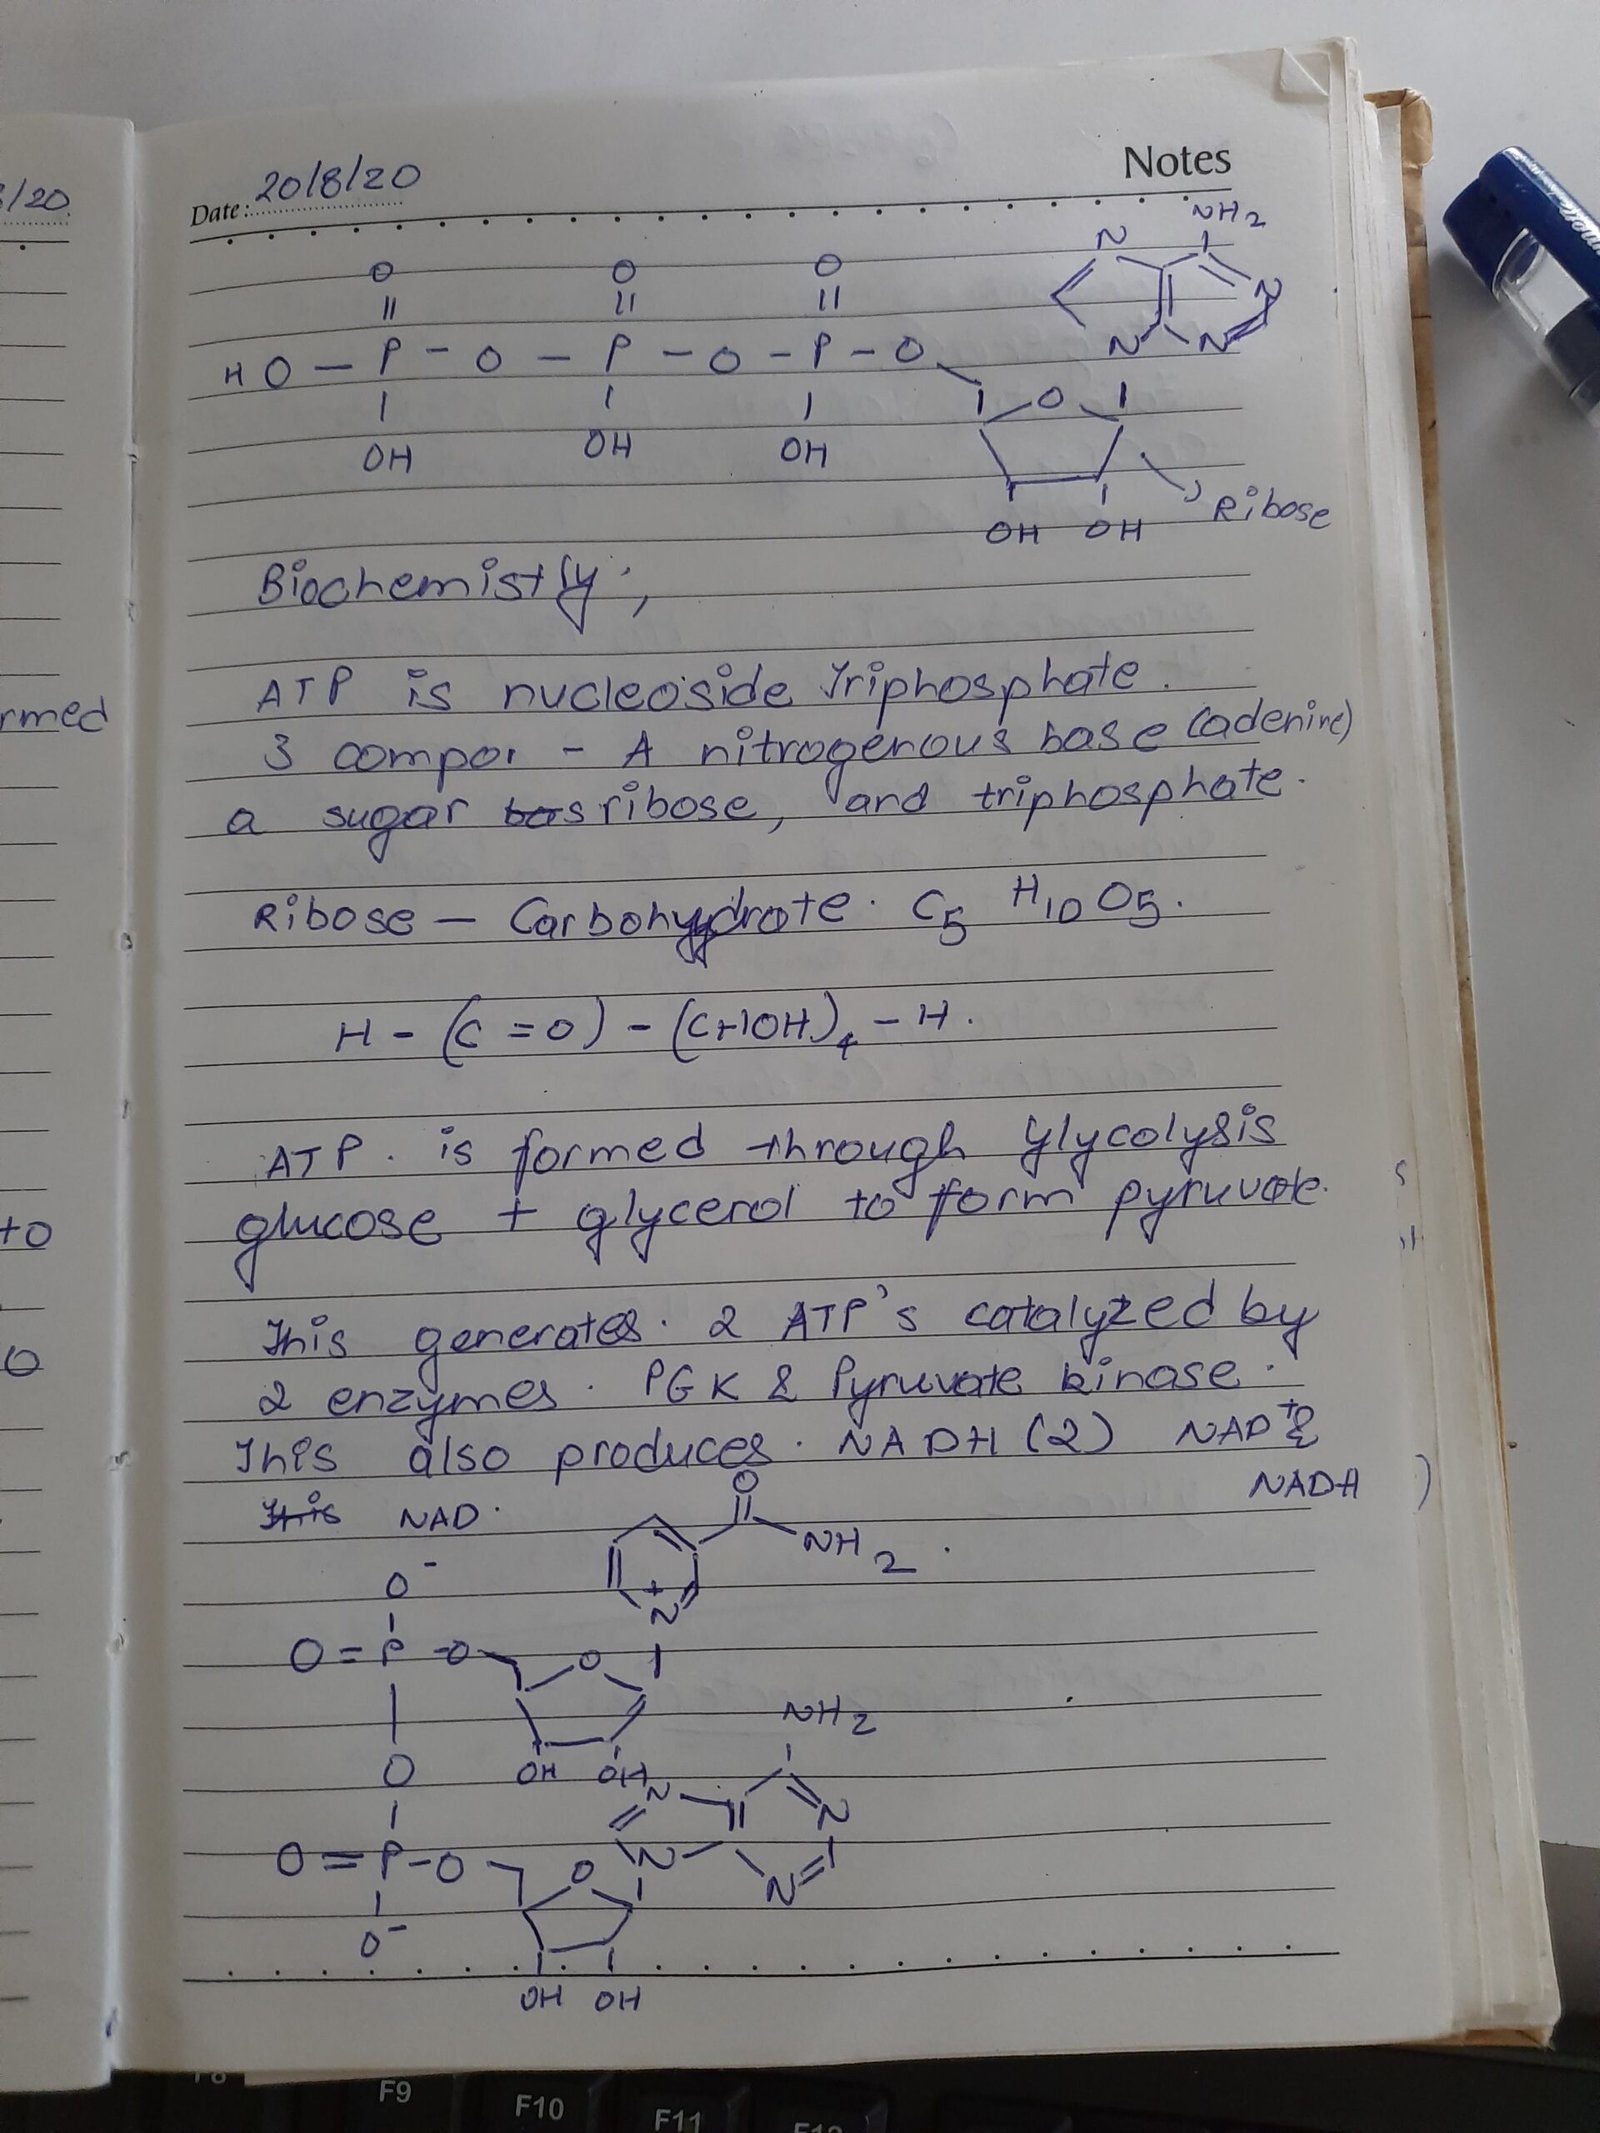
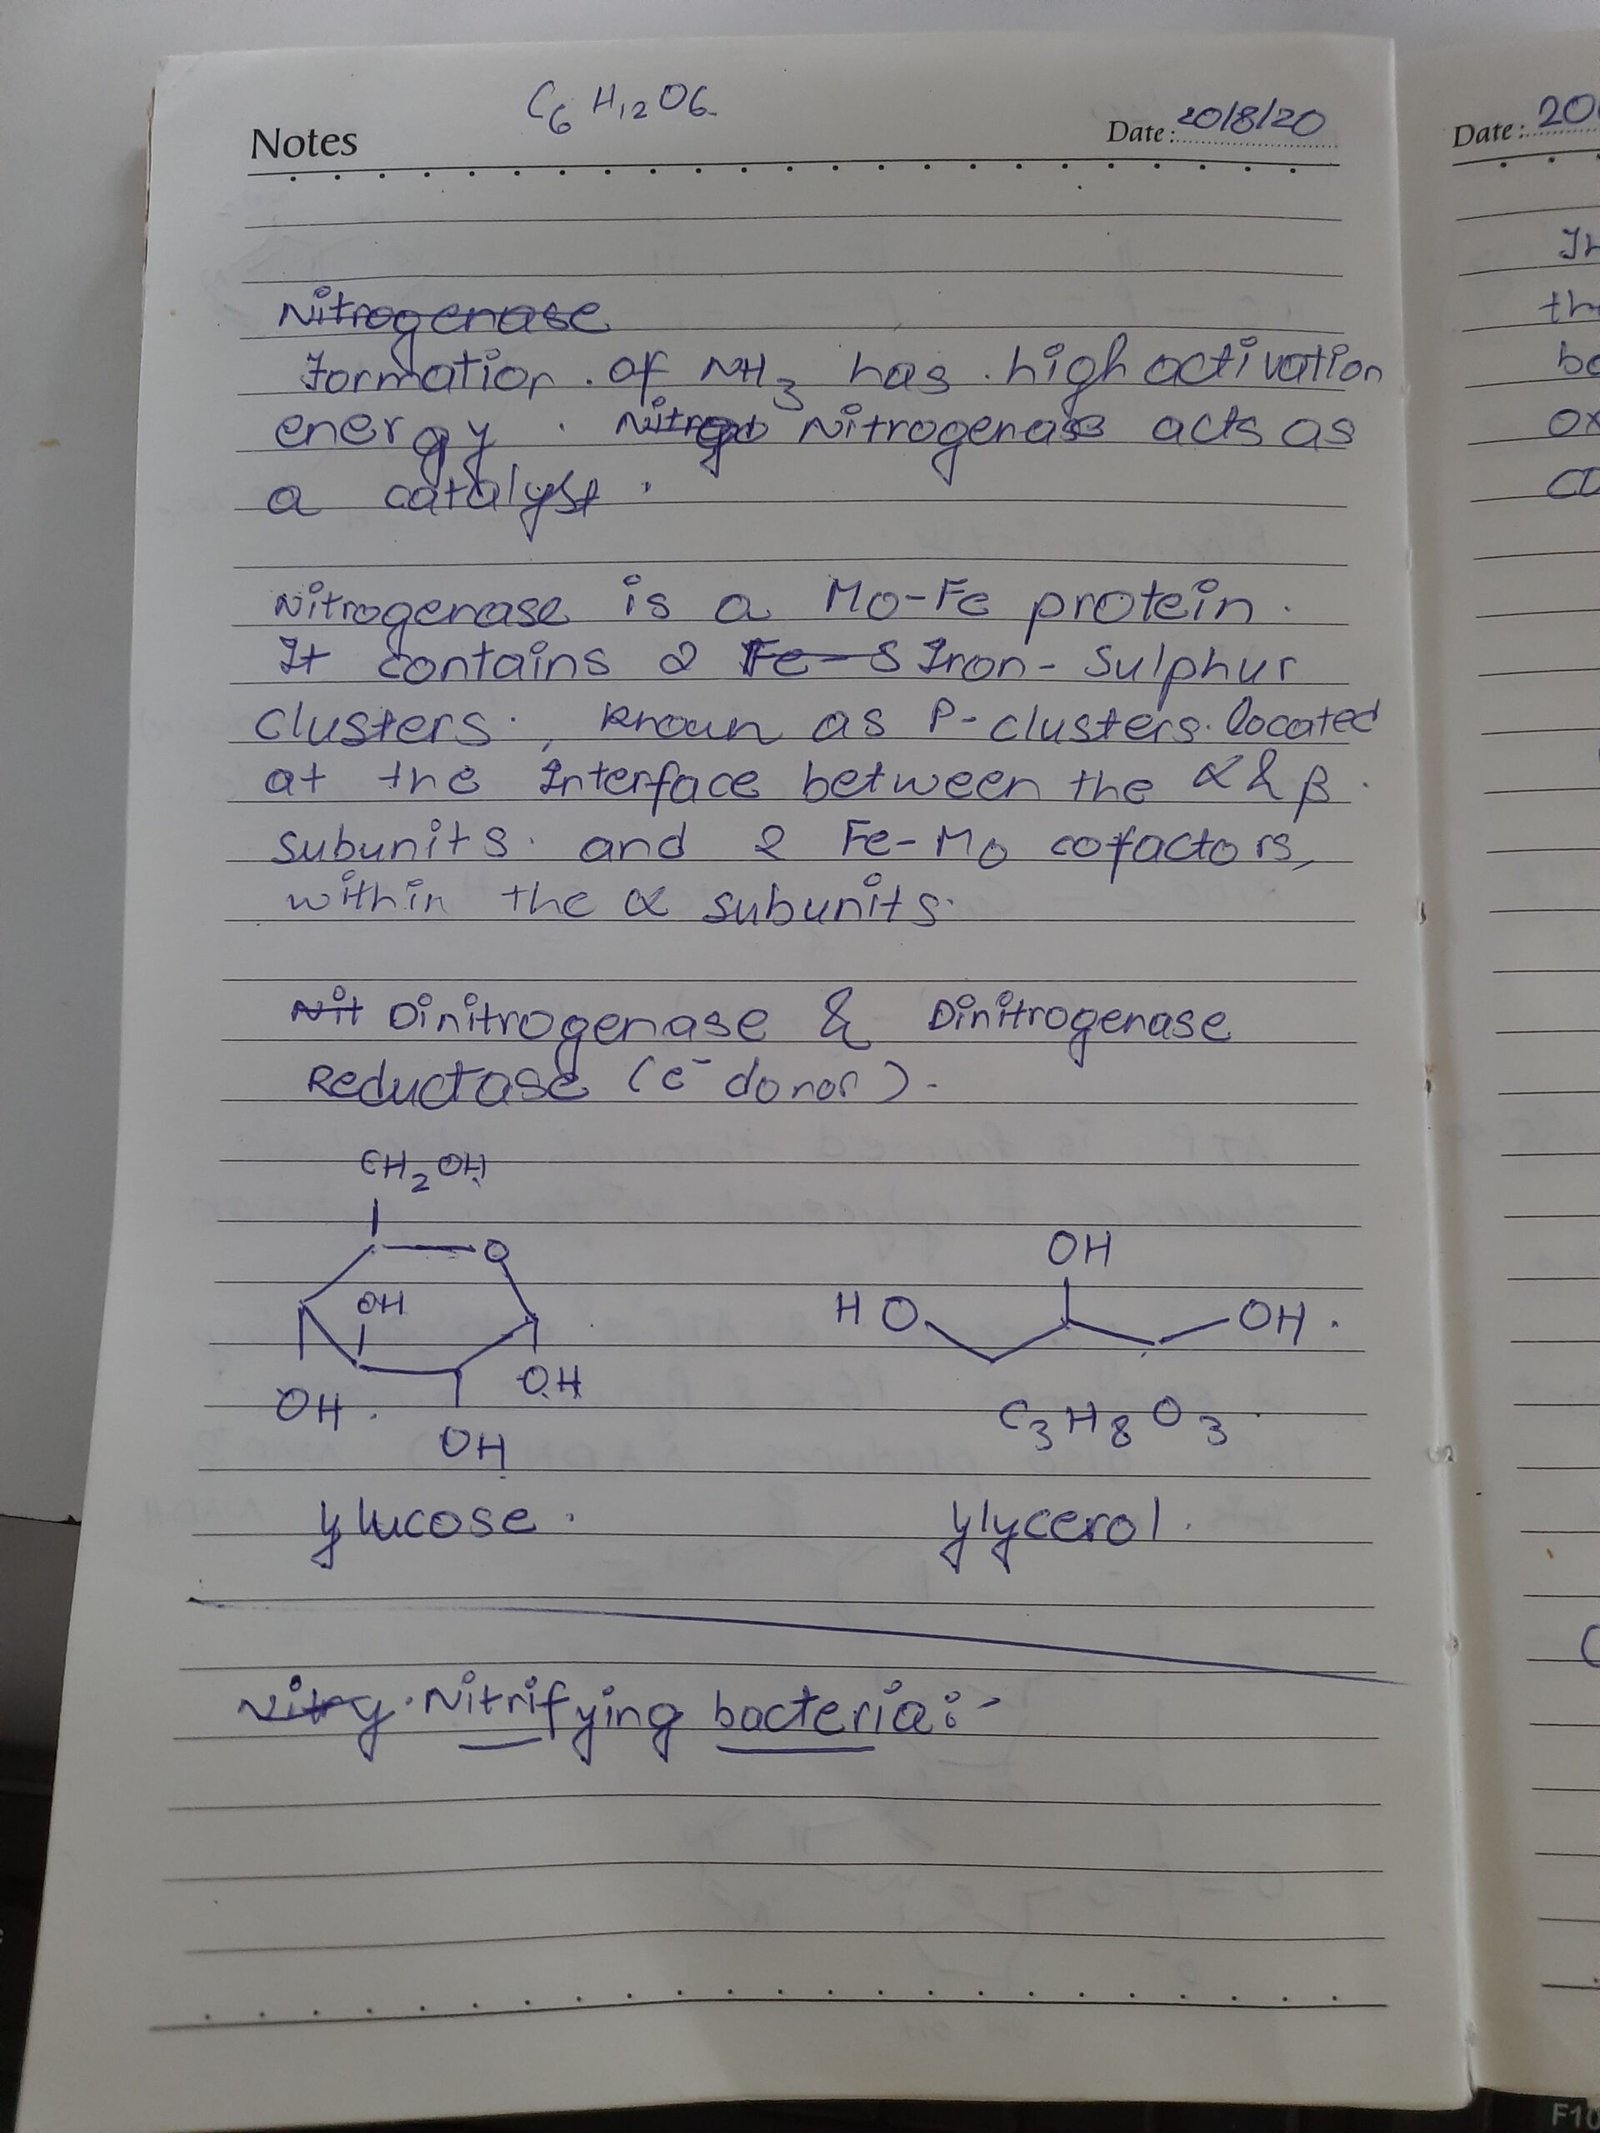
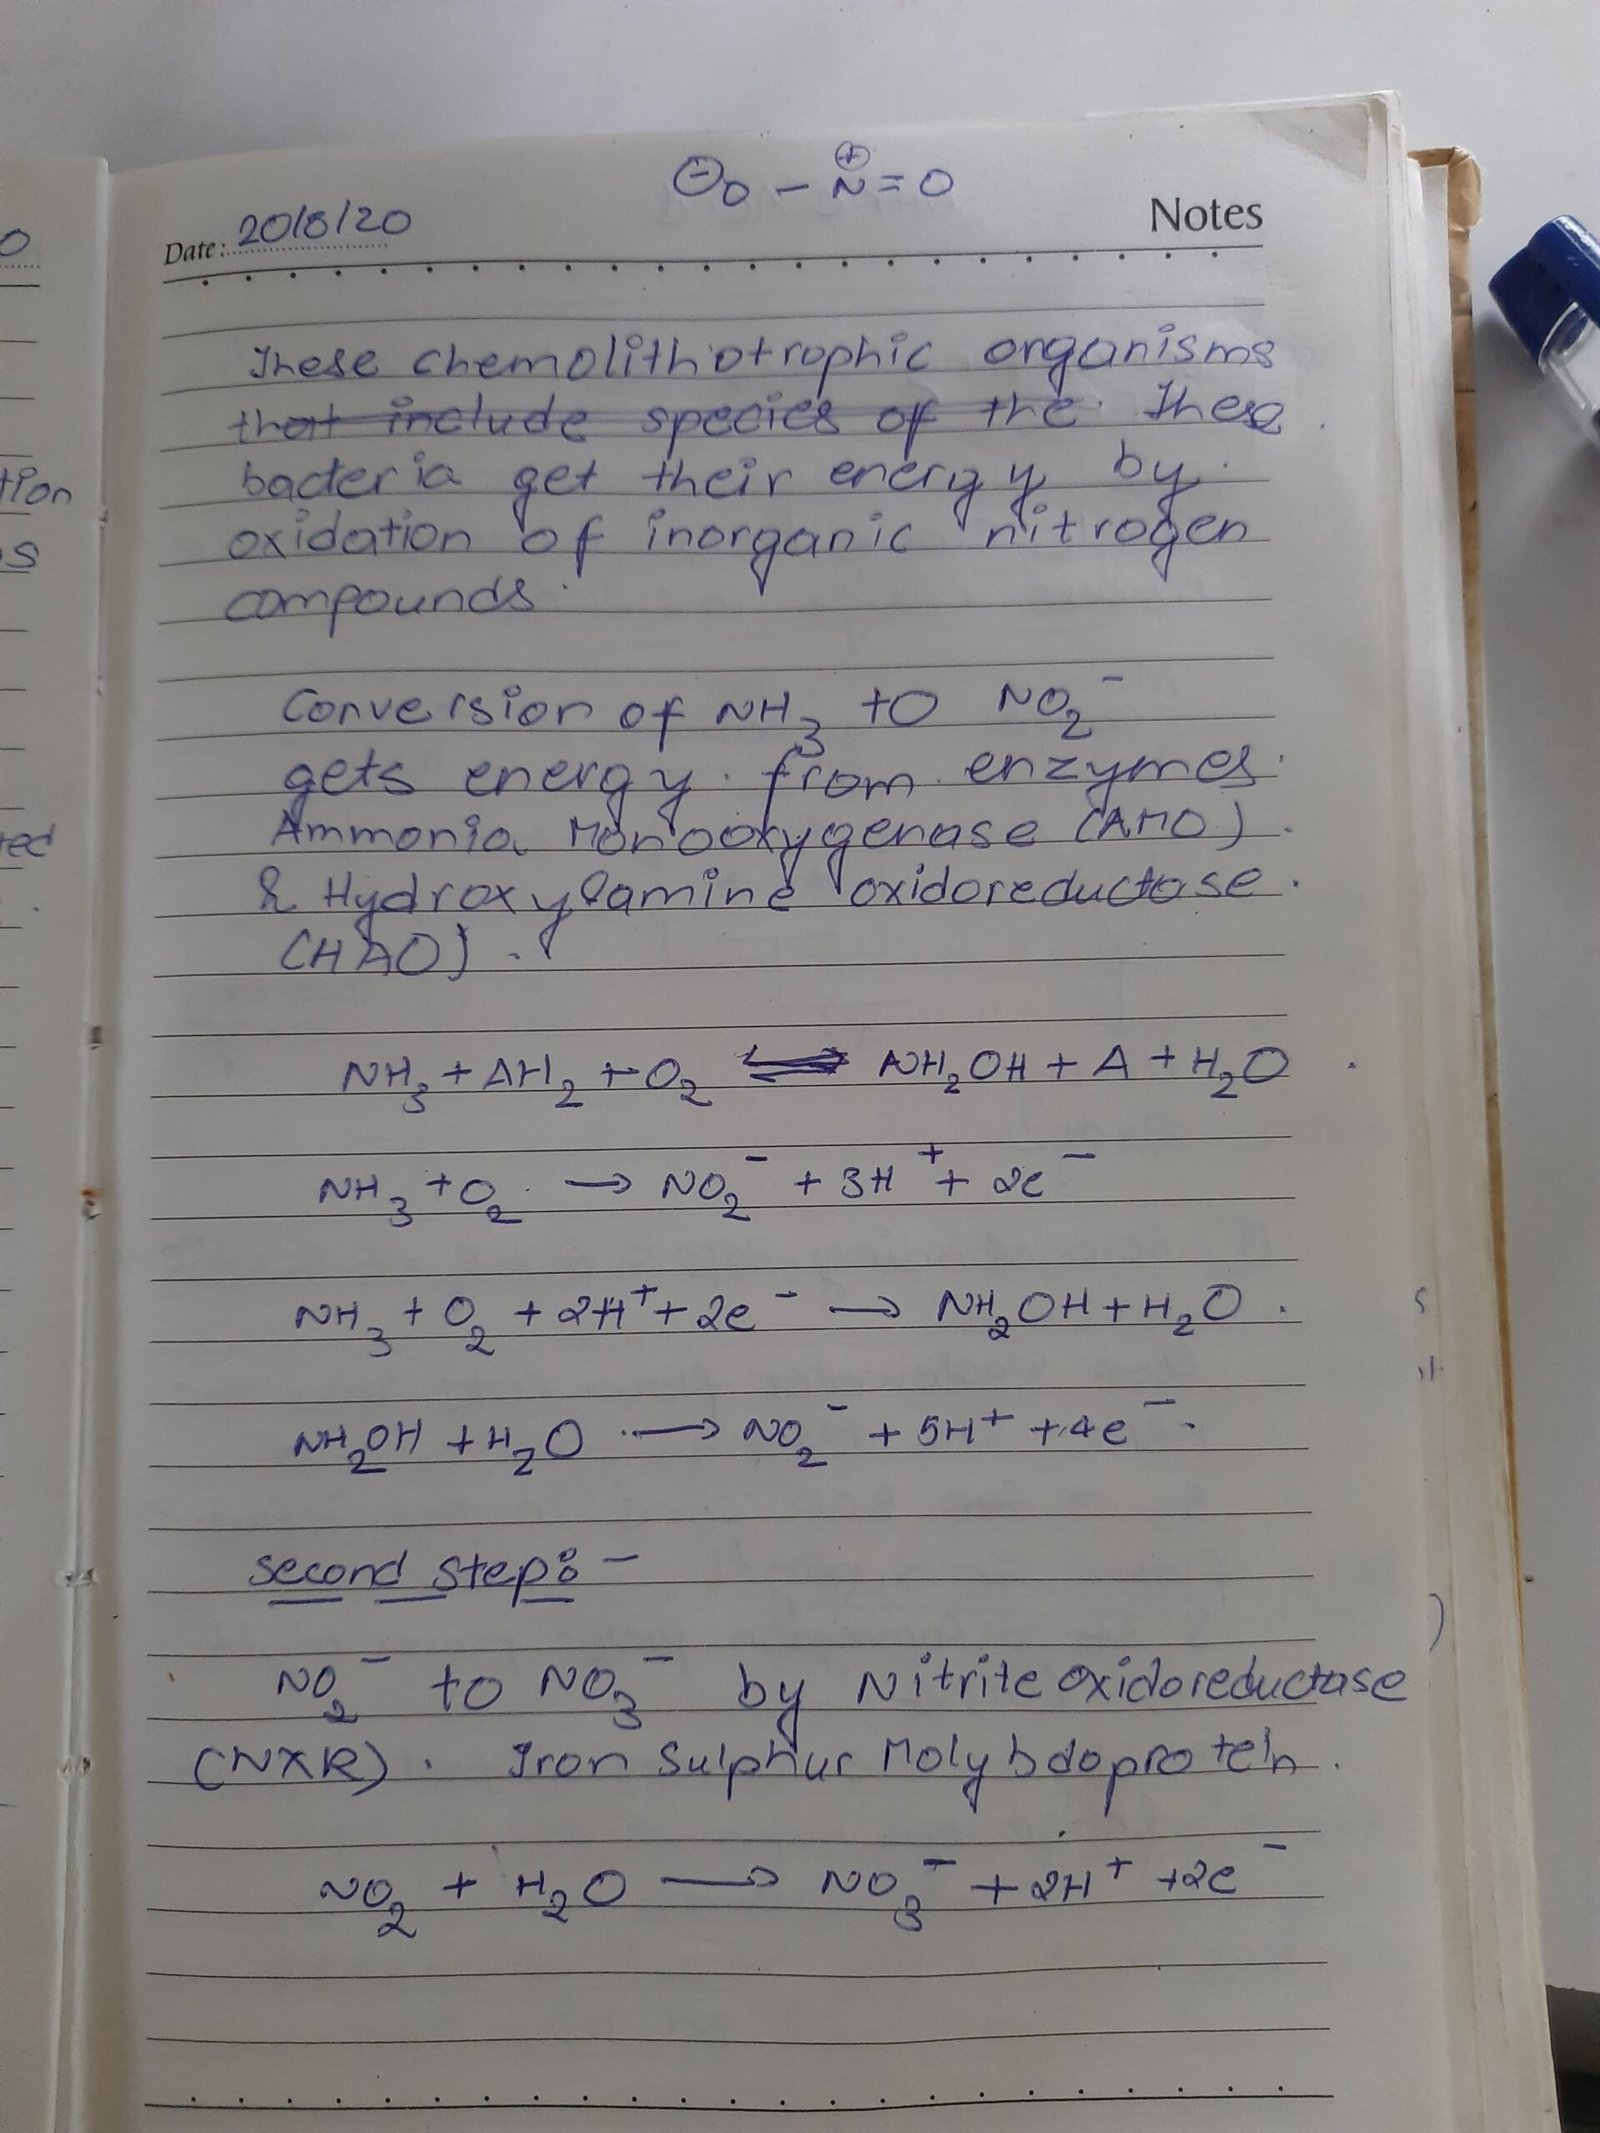
Nitrogen Fixation
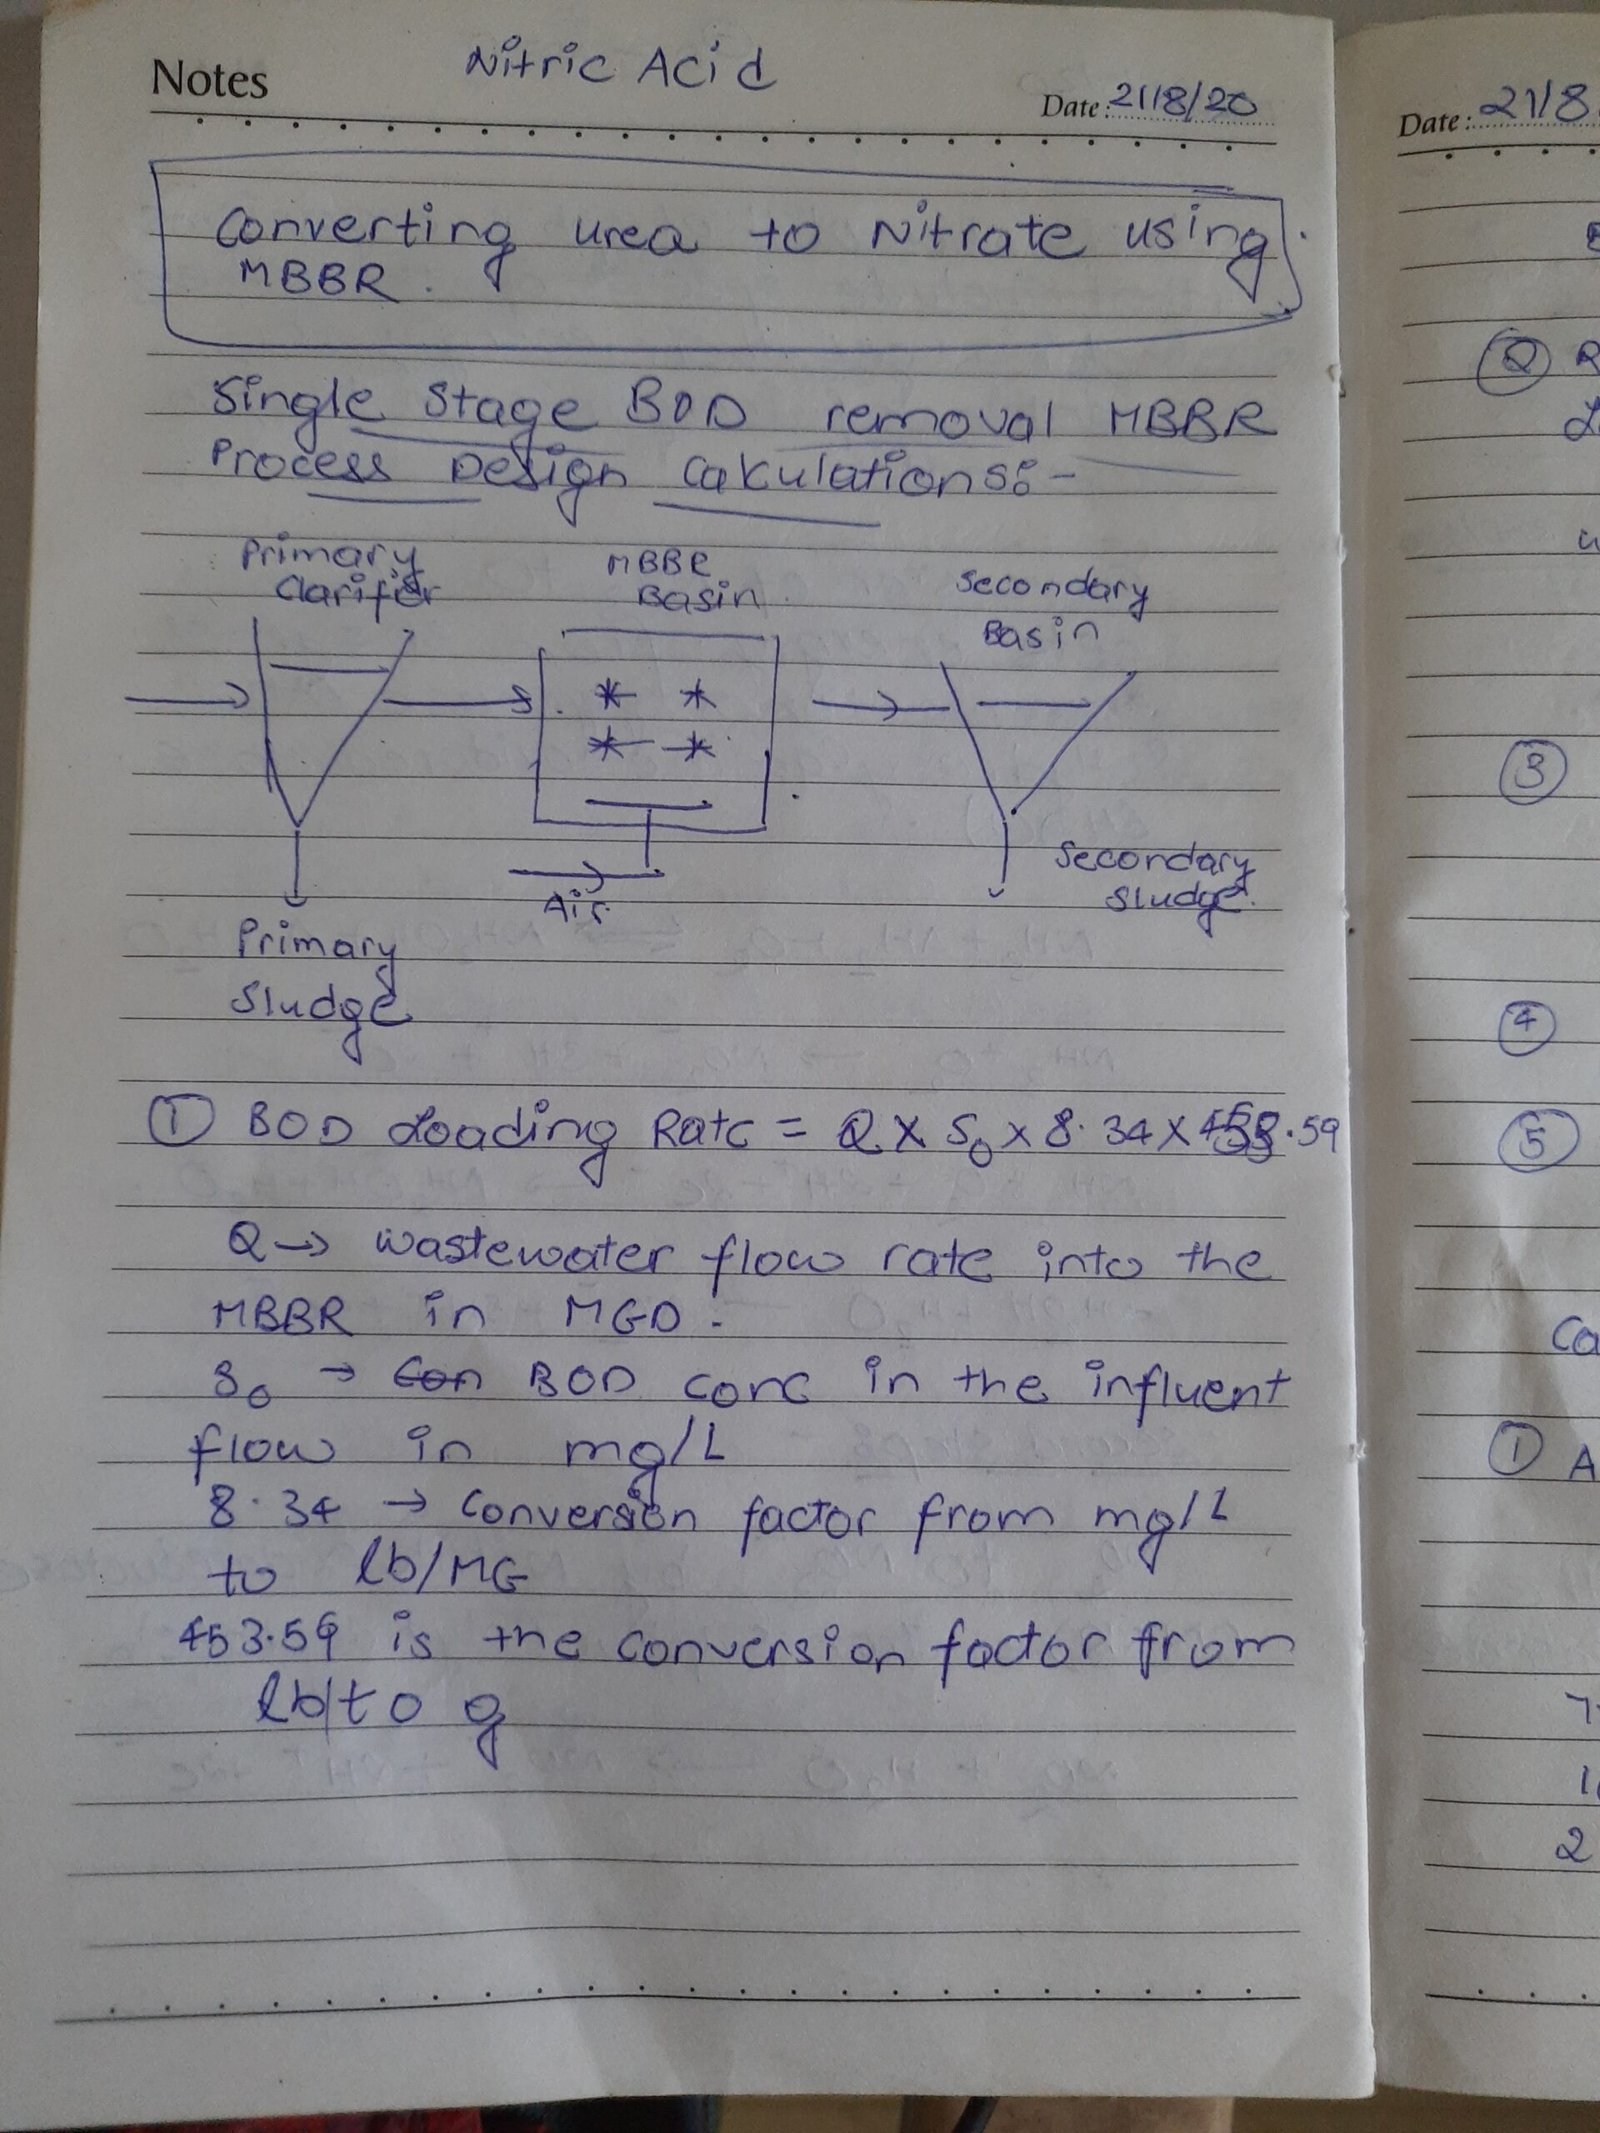
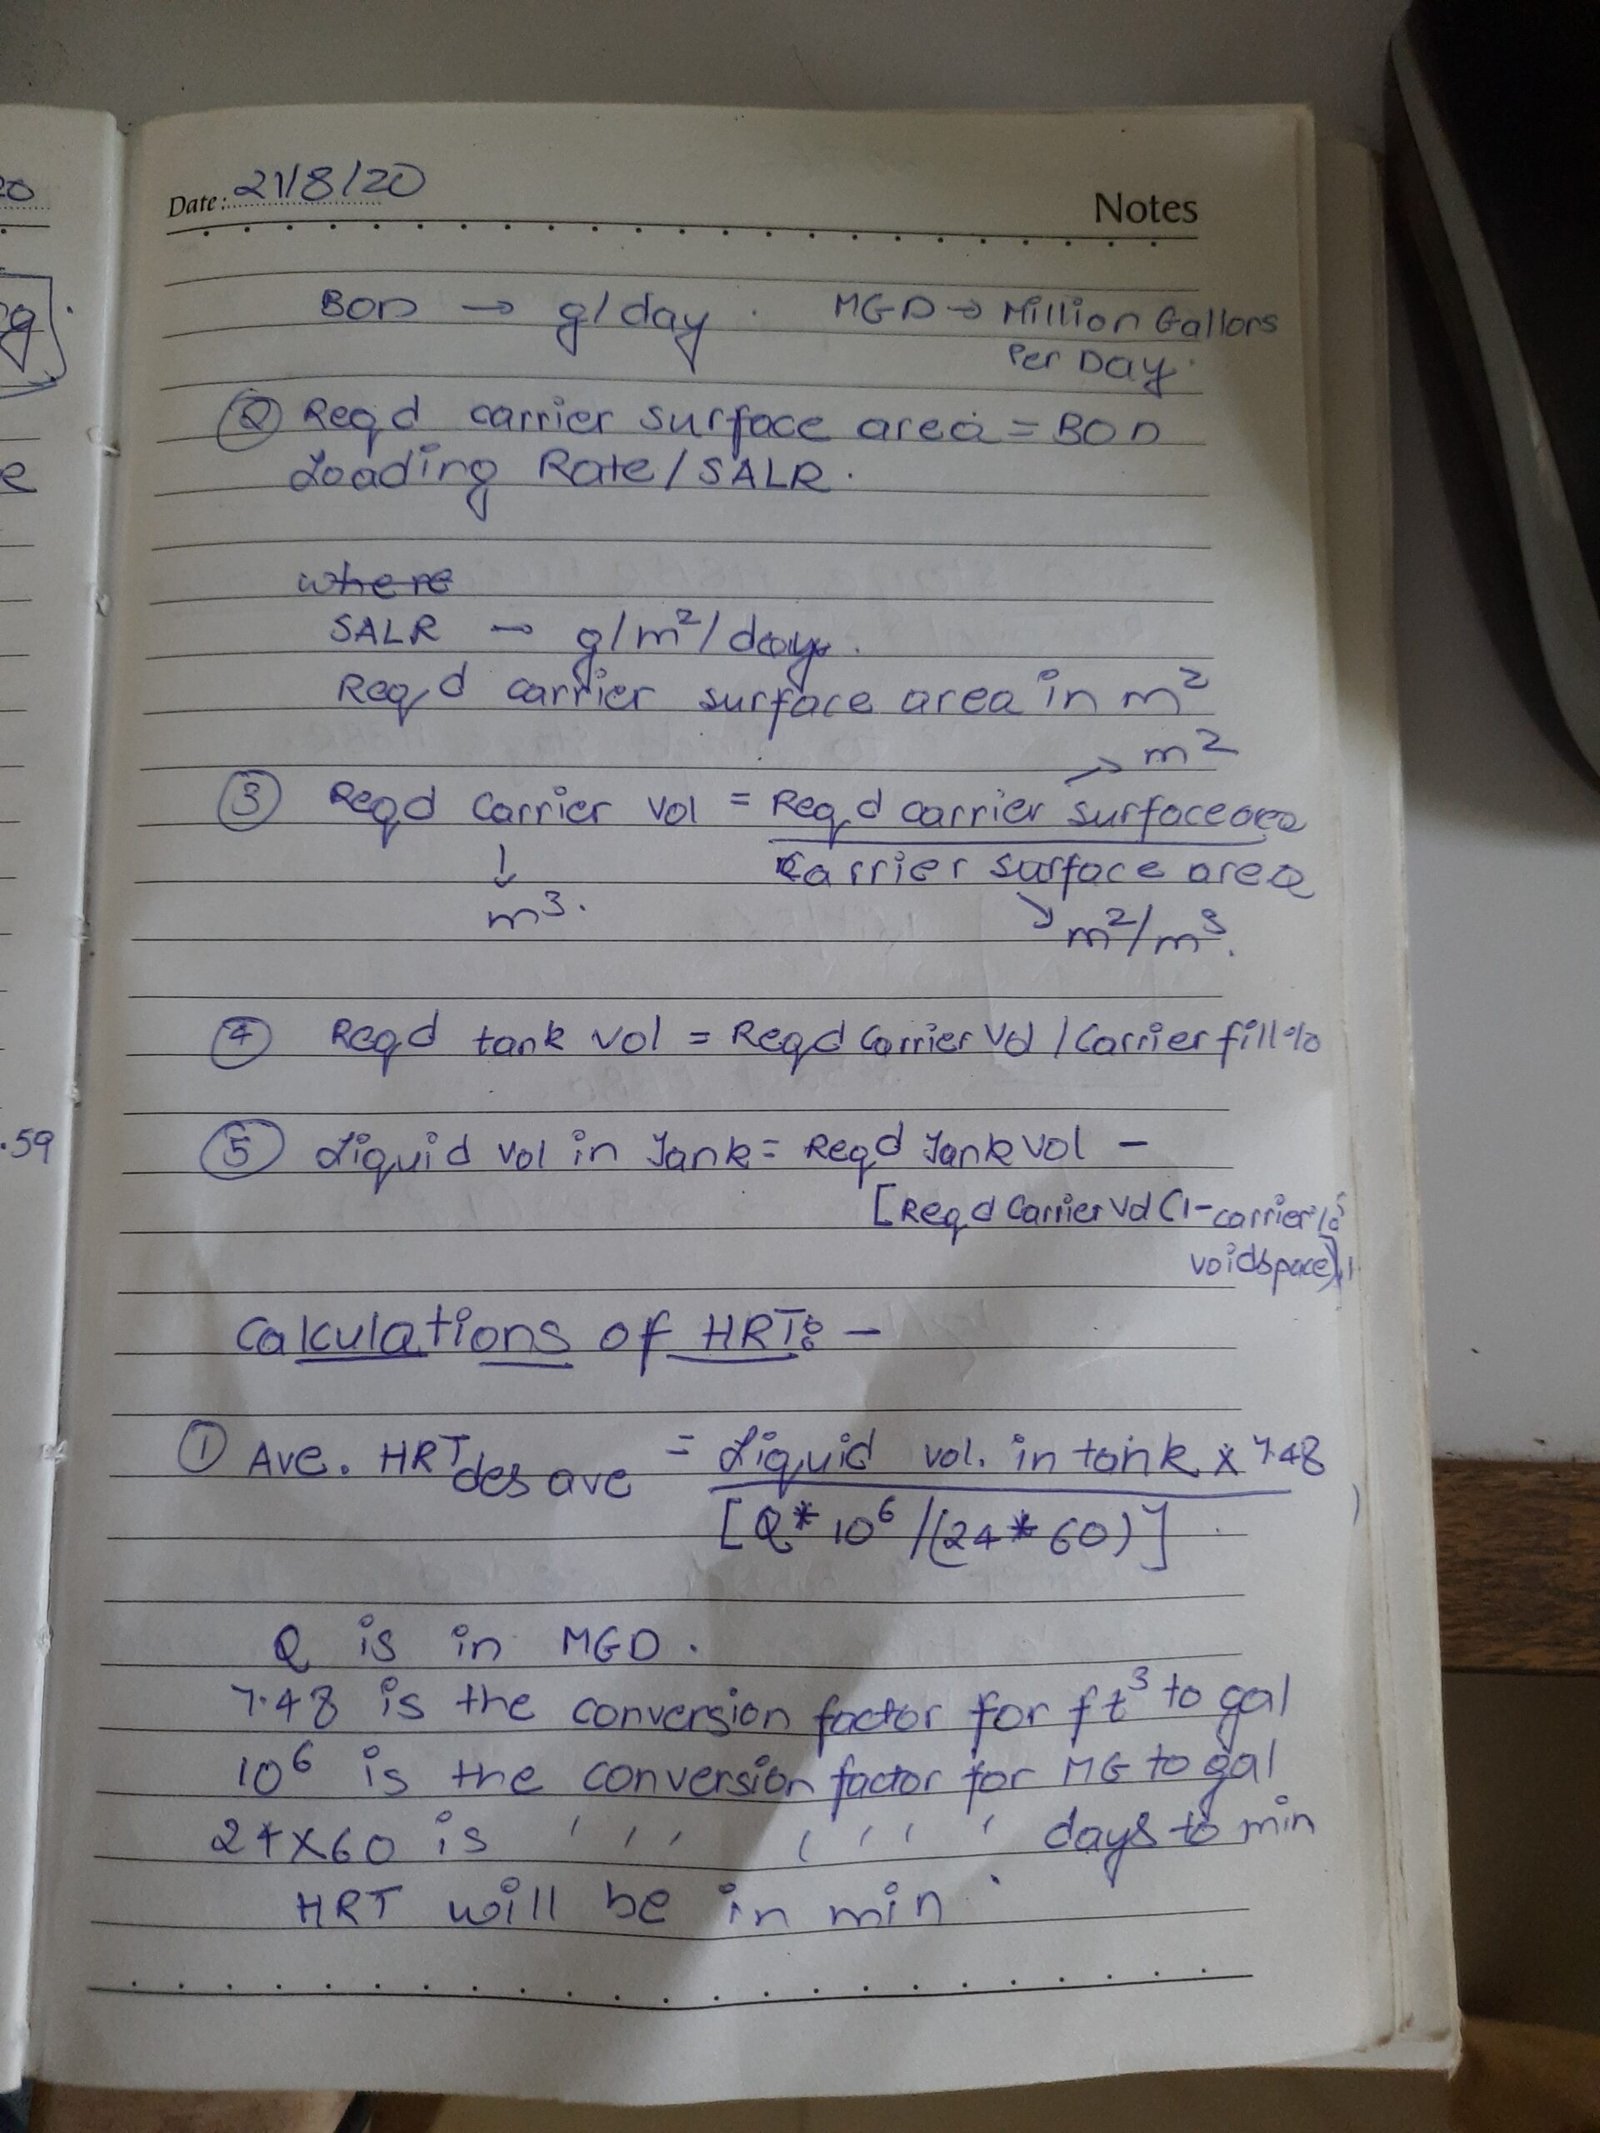
Process Design Calculation
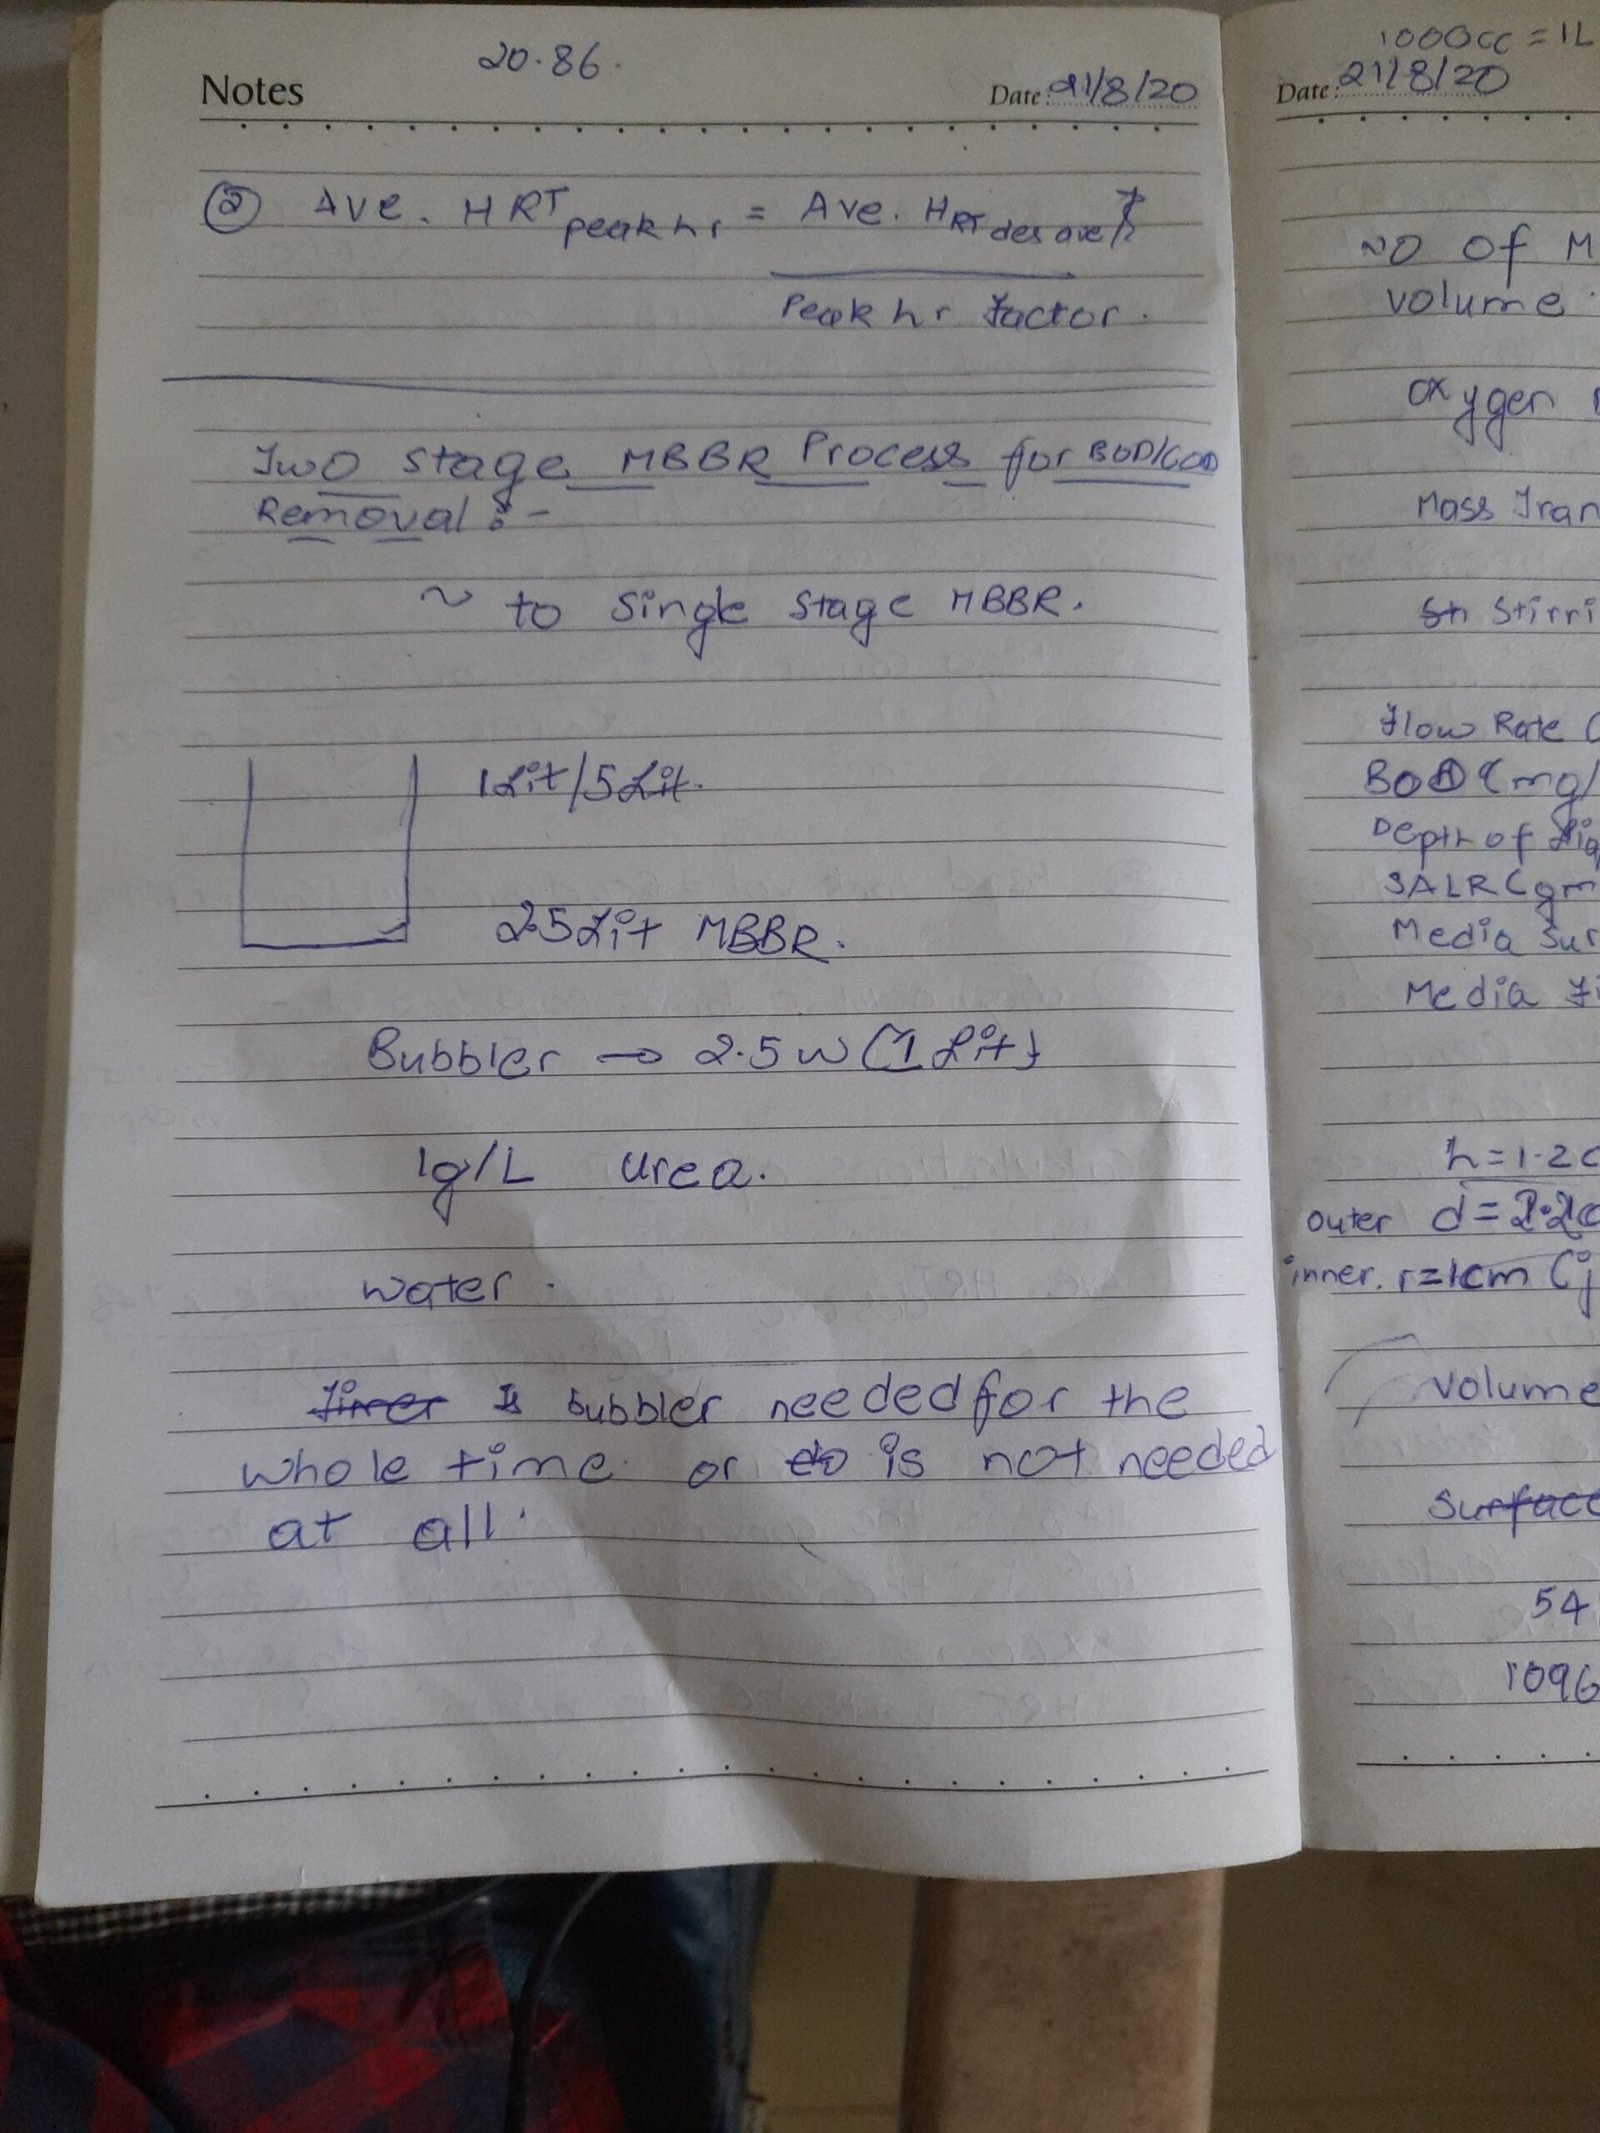
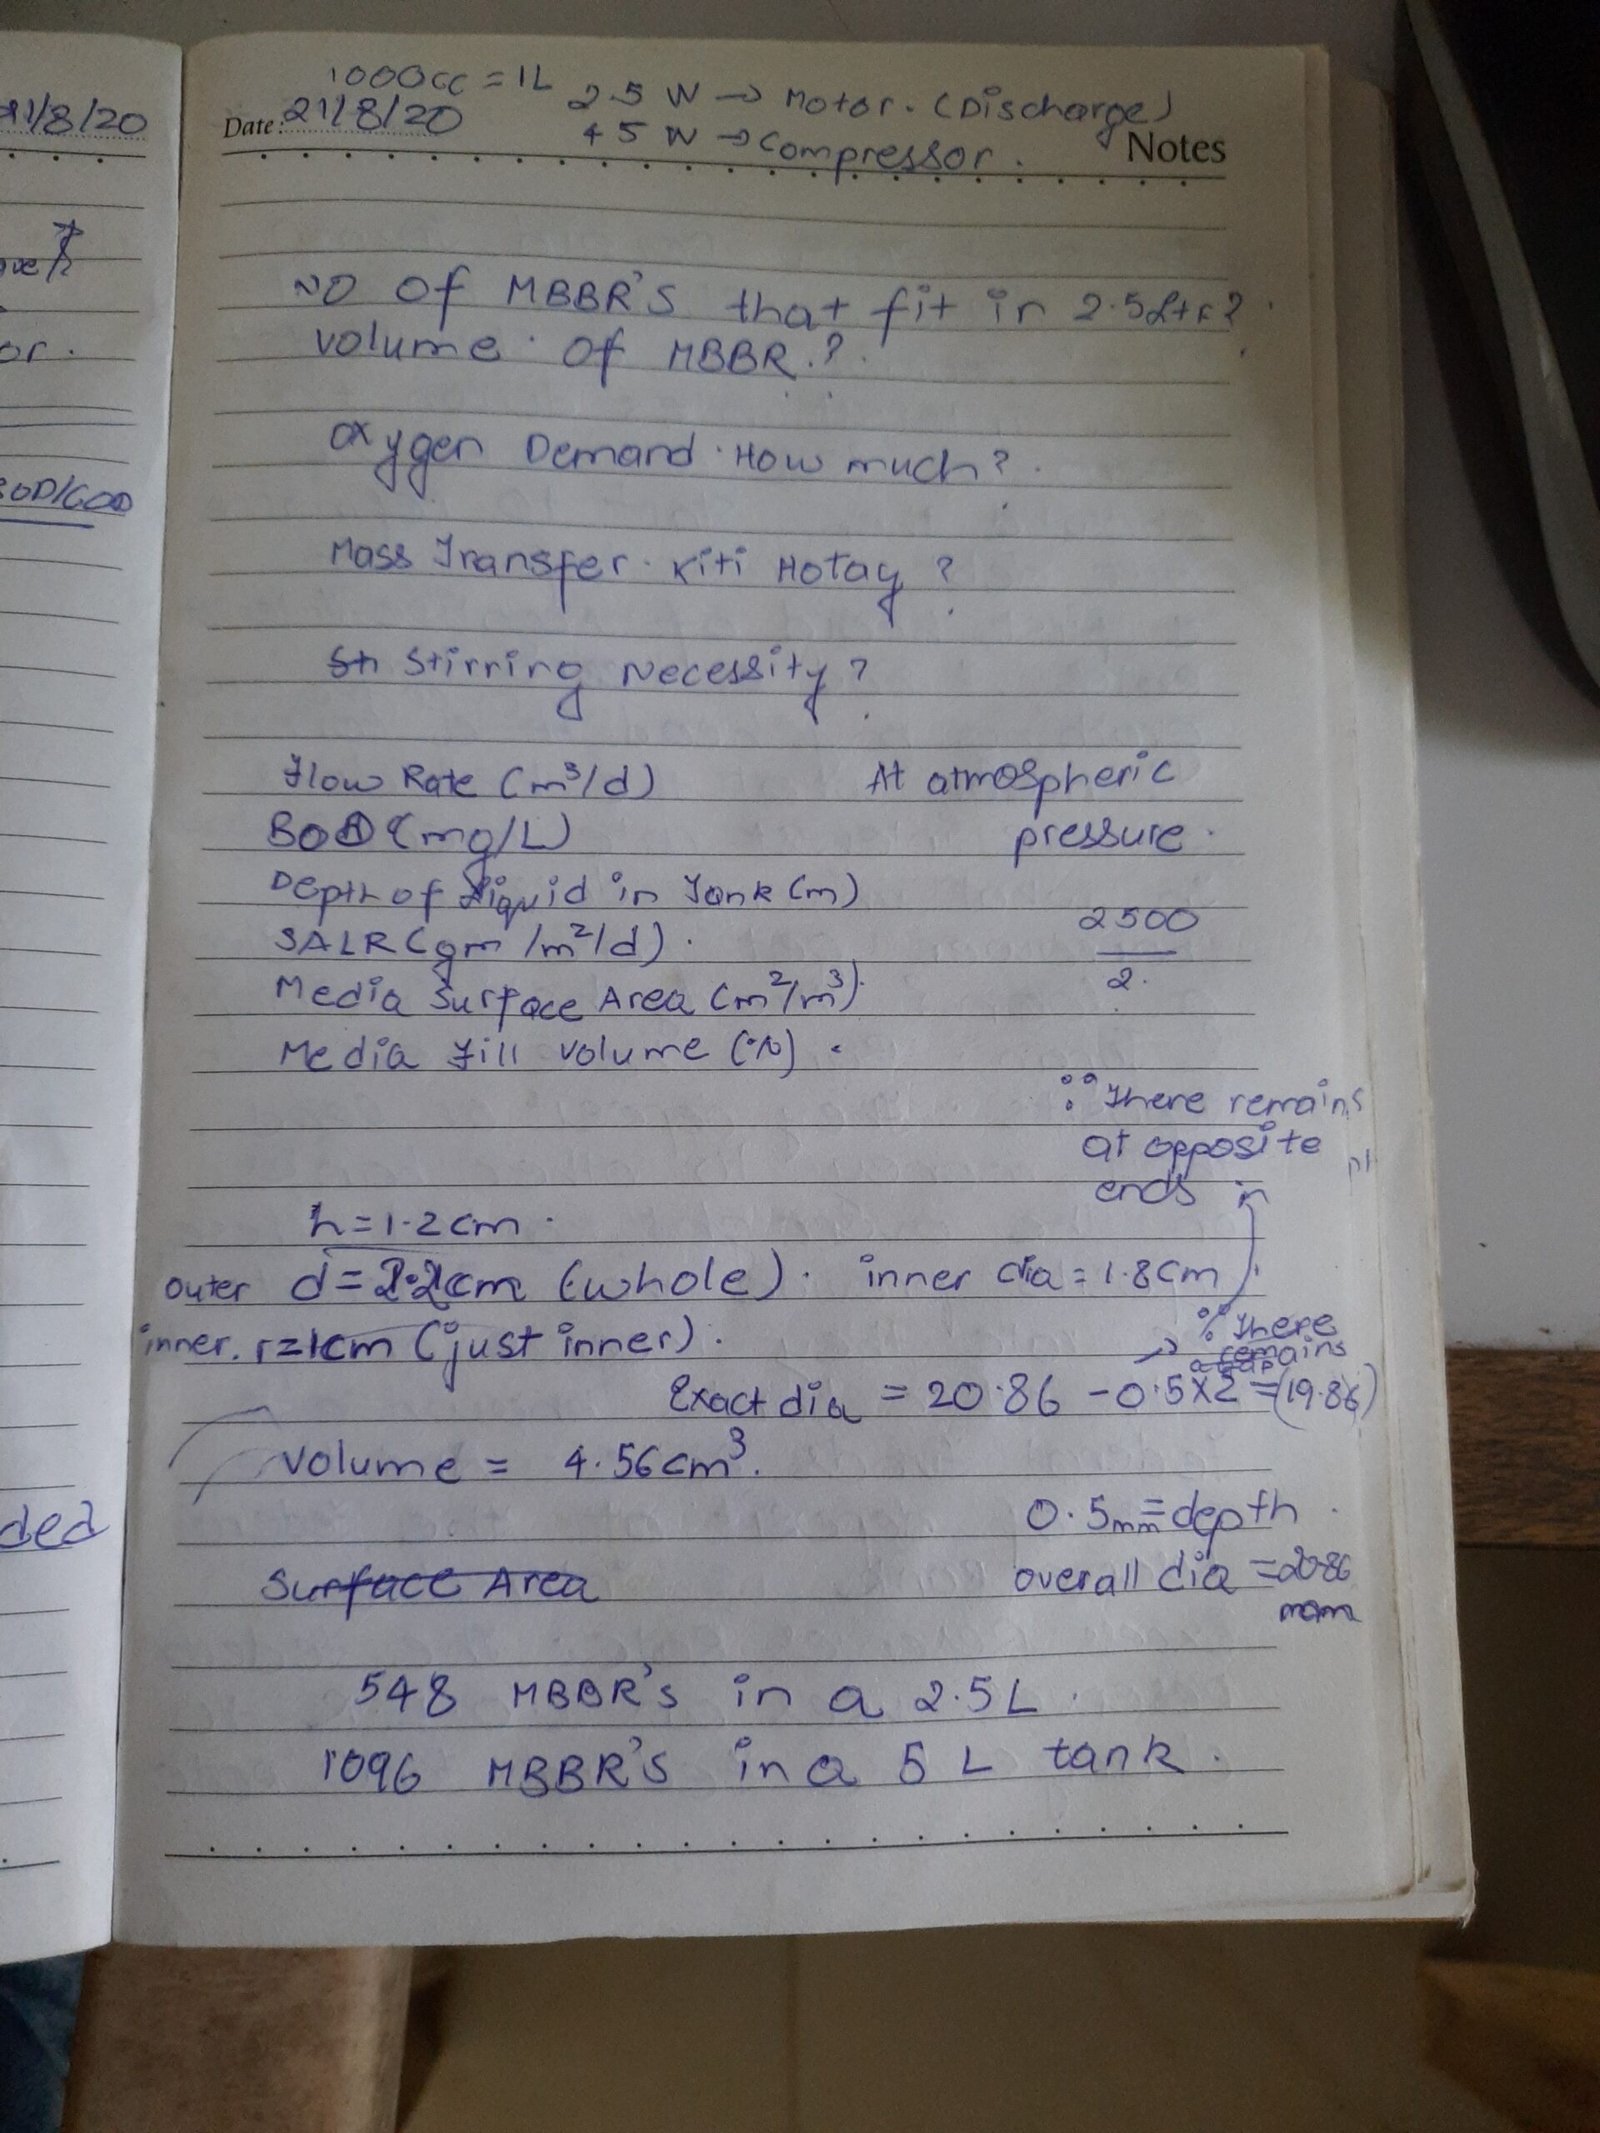
The first questions that arose while designing were
1) What will the size of the reactor be?
2) Volume of the one MBBR?
3) Number of MBBR’s that fit in the reactor?
4) How much is the oxygen demand ?
5)What is the amount of mass transfer ?
6) Is there a stirring necessity?
Also while designing, following are the considerations to be made:-
- Flow Rate
- BOD(biological oxygen demand)
- Depth of the liquid in the tank
- SALR(surface area loading rate)
- Media surface area
- Media fill volume
Experimentation:-
3 Experiments were set up at Vigyan ashram Soil testing lab. Each Experiment had Different Volume of the biofilm carriers and the consortium of bacteria. And in each experiment 1g/L(1000 ppm) Of urea was added.
The parameters that were taken into consideration while designing the MBBR experiment 1 are as follows
- Precise weight of One Biofilm Carrier = 1.093 gms
- Weight of one 1000 ml Beaker = 88 gms
- Volume of The biofilm carriers = 500 ml (50% by volume)
- No of biofilm carriers inside the reactor = 73
- Weight of reactor with the biofilm carriers = 168 gms
- Weight of biofilm carriers = 88 gms
- Volume of water added = 850 ml
- Volume of bacteria added = 150 ml
Experimental Data:-
Data as on 28 August 2020
- TDS (Total dissolved solids) = 185 ppm
- EC (Electrical Conductivity) = 395 microS/cm
- pH = 7.5
- Temperature = 27 degree celsius
Pump calculations:-
- Voltage supply = 230 V AC
- Frequency = 50 Hz
- Power supply (as mentioned on the pump) = 3W
- Power supply (Actual) = 2.5W
- Flow Rate =3L/min
- Pressure = 20 KPa
- Daily Energy consumption = 2.5 x 24 = 60 Wh
- Monthly Energy consumption = 60 x 30 = 1.8 KW
- Rate of One unit = 7 rupees
- Monthly Charges = 1.8 x 7 = 12.6 rupees
The parameters that were taken into consideration while designing the MBBR experiment 2 are as follows
- Precise weight of One Biofilm Carrier = 1.093 gms
- Weight of one 1000 ml Beaker = 88 gms
- Volume of The biofilm carriers = 300ml (30% by volume)
- No of biofilm carriers inside the reactor = 44
- Weight of reactor with the biofilm carriers = 136.092g
- Weight of biofilm carriers = 48.092 gms
- Volume of water added = 800 ml
- Volume of bacteria added = 200 ml
Experimental data for Experiment 2
Data as on 30 august 2020
- TDS (Total dissolved solids) = 337 ppm
- EC (Electrical Conductivity) = 699 microS/cm
- pH = 5.59
- Temperature = 25.2 degree celsius
The parameters that were taken into consideration while designing the MBBR experiment 3 are as follows
- Precise weight of One Biofilm Carrier = 1.093 gms
- Weight of one 1000 ml Beaker = 88 gms
- Volume of The biofilm carriers = 400 ml ( 30% by volume)
- No of biofilm carriers inside the reactor = 57
- Weight of reactor with the biofilm carriers = 153.15 gms
- Weight of biofilm carriers = 63.9 gms
- Volume of water added = 800 ml
- Volume of bacteria added = 200 ml
Experimental data for Experiment 3
Data as on 30 august 2020
- TDS (Total dissolved solids) = 354 ppm
- EC (Electrical Conductivity) = 755 microS/cm
- pH = 5.65
- Temperature = 25.2 degree celsius
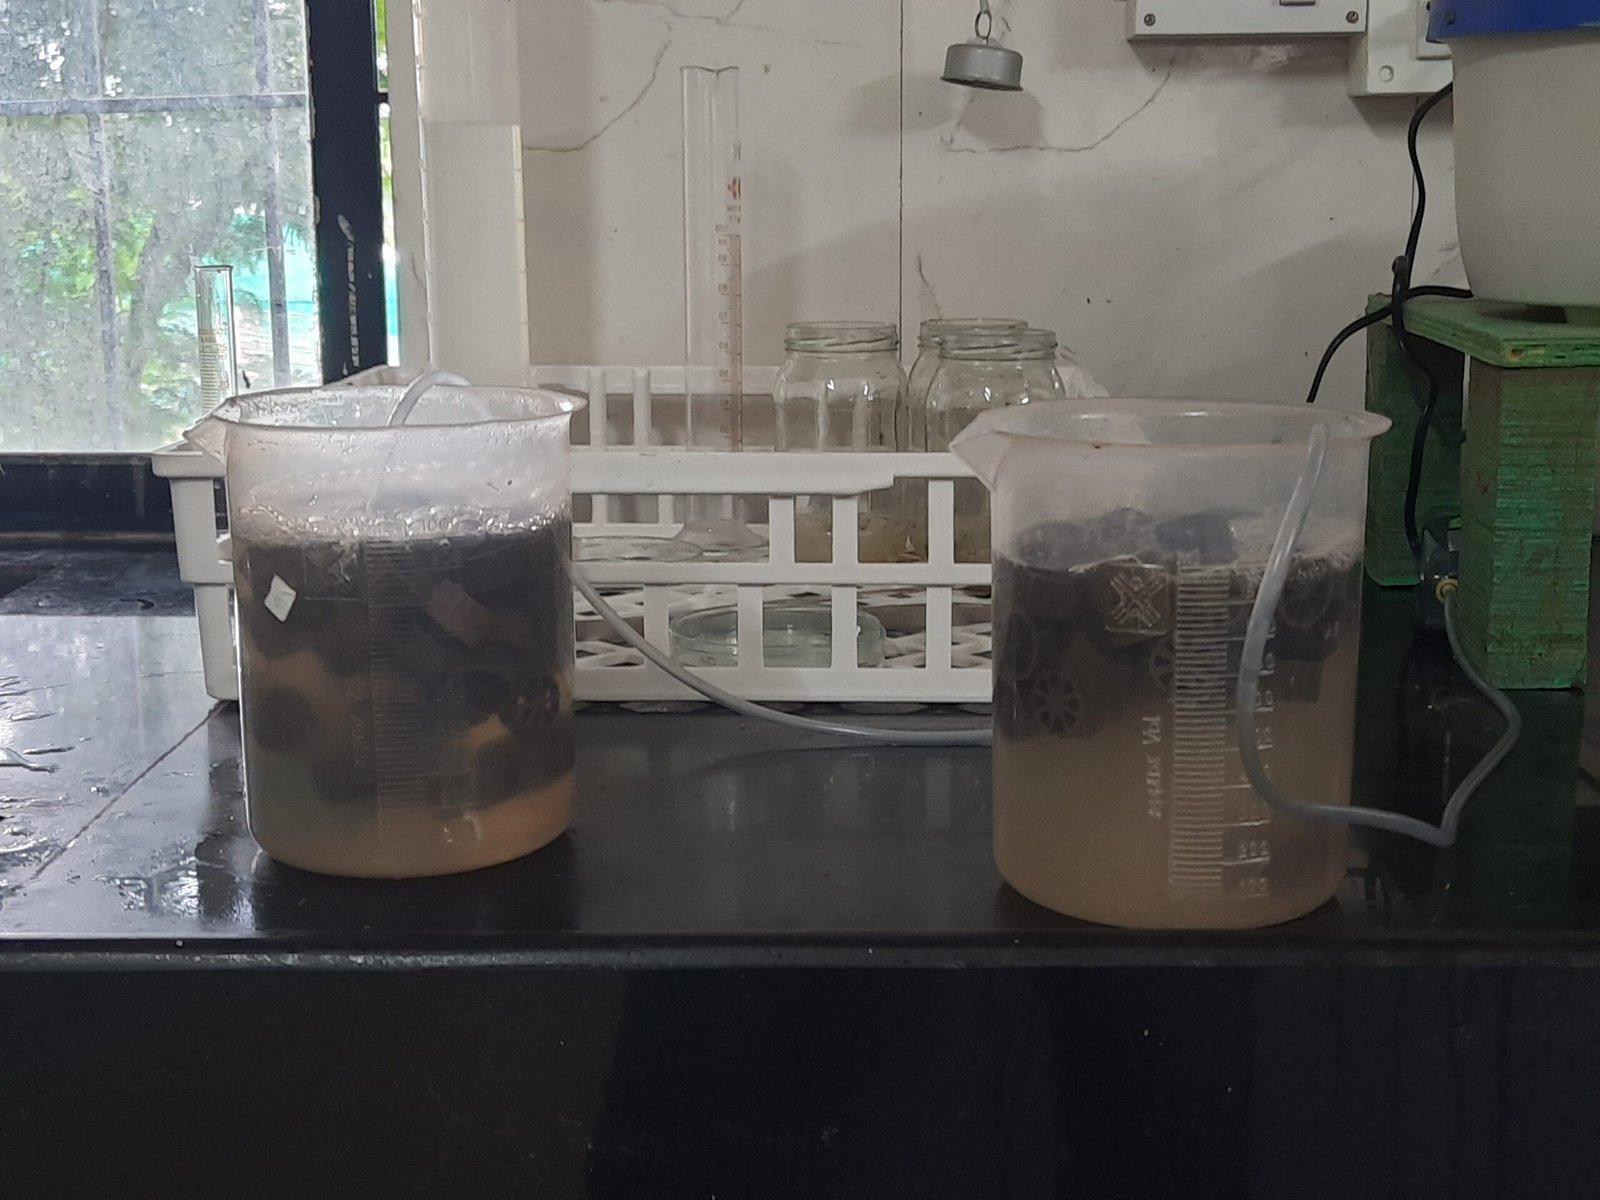
Results:-


no nitrate formation(30%By volume) 
no nitrate formation(40%by volume) 
nitrate formation(100ppm for 50%by volume)
As seen from the table The Nitrate conversion for 50% by volume of biofilm carrier the nitrate conversion reaches to 100 ppm in 5 days. Now when we see the conversion it can be interpreted as follows:-
Weight of Urea is 60 g/mol . And urea has 46.66% of nitrogen in it. Now we have added 1g/L of urea in the solution. Therefore we have added 1000 ppm of urea in the solution out of which nitrogen is 460 ppm. The nitrate formed was 100 ppm. Now the % of nitrogen in nitrate is 22.5%. Therefore the conversion of nitrogen to nitrate is 4.891%.
Now for the other two experiments no formation of nitrate was seen . This may have happened because
- Lower amount of dissolved oxygen
- The consortium of bacteria in the solution was inactive
- Proper mixing of the biofilm carrier may not have happened.
- Biofilm detachment because of constant collision and attrition.
- The bubbler couldn’t provide adequate amount of turbulence needed.
After obtaining the following results What I interpreted as the factors affecting the MBBR performance would be:-
1) Percentage of Reactor Volume comprised of Biofilm Carrier:-
With an increasing fill fraction the suspended growth concentration decreases. However low suspended biomass can lower the MBBR removal efficiency. Since they have a major role in enzymatic hydrolysis and bio flocculation in the reactor. It is observed that a fill fraction of 35% had a higher COD removal . Whereas a 66% fill fraction had slightly better nitrification due to higher concentration of slow growing nitrifiers which could be retained in the reactor.
2) Specific Surface Area:-
Typical biofilm concentration ranges from 3000 to 4000 TSS/m3. The effective area of the MBBR carrier medium is reported to be 70% of the total surface area due to less attachment of biofilm on the outer perimeter of media.
3)Presence of Dissolved Oxygen:-
DO should be kept higher than 2 mg/L for efficient COD removal. By decreasing the DO from 2 to 1mg/L can bring down the COD removal efficiency by 13%. On the other hand Increase in the DO from 2 to 6 mg/L increases the COD removal efficiency by 5.8%.
4)Flow and mixing conditions:-
The nature of the carrier media used requires development of a thin evenly distributed and smooth biofilm to enable transport of substrate and oxygen to the biofilm surface. Adequate turbulence also maintained the flow velocity necessary for effective system performances. Collision and attrition of media in the reactor causes biofilm detachment from outer surface of the media . Therefore fins are provided.
5)Biofilm Development:-
The diff between biofilm growth and attachment on one hand and detachment processes on the other can be defined as biofilm development. Which depends on adsorption and desorption of microorganisms to the solid surface, biofilm growth, thickness, biofilm adhesion as well as detachment to and from the solid surface or media. . The microorganisms grow on a small carrier element that move freely with water in the reactor. Due to erosion caused by frequent collision between the carrier elements very little biofilm grows on the outside surface of the carriers.
After finding these factors two new experiments were set up for 30 and 40% by volume of biofilm carriers by changing the consortium of bacteria and keeping the parameters same.
The parameters that were taken into consideration while designing the MBBR experiment 4 are as follows
- Precise weight of One Biofilm Carrier = 1.093 gms
- Weight of one 1000 ml Beaker = 88 gms
- Volume of The biofilm carriers = 300ml (30% by volume)
- No of biofilm carriers inside the reactor = 44
- Weight of reactor with the biofilm carriers = 136.092g
- Weight of biofilm carriers = 48.092 gms
- Volume of water added = 800 ml
- Volume of bacteria added = 200 ml
Experimental data for Experiment 2
Data as on 3 september 2020
- TDS (Total dissolved solids) = 680 ppm
- EC (Electrical Conductivity) = 1302 microS/cm
- pH = 8.56
- Temperature = 27.1 degree celsius
The parameters that were taken into consideration while designing the MBBR experiment 3 are as follows
- Precise weight of One Biofilm Carrier = 1.093 gms
- Weight of one 1000 ml Beaker = 88 gms
- Volume of The biofilm carriers = 400 ml ( 40% by volume)
- No of biofilm carriers inside the reactor = 57
- Weight of reactor with the biofilm carriers = 153.15 gms
- Weight of biofilm carriers = 63.9 gms
- Volume of water added = 800 ml
- Volume of bacteria added = 200 ml
Experimental data for Experiment 3
Data as on 3 september 2020
- TDS (Total dissolved solids) = 395ppm
- EC (Electrical Conductivity) = 835 microS/cm
- pH = 5.52
- Temperature = 27.2 degree celsius
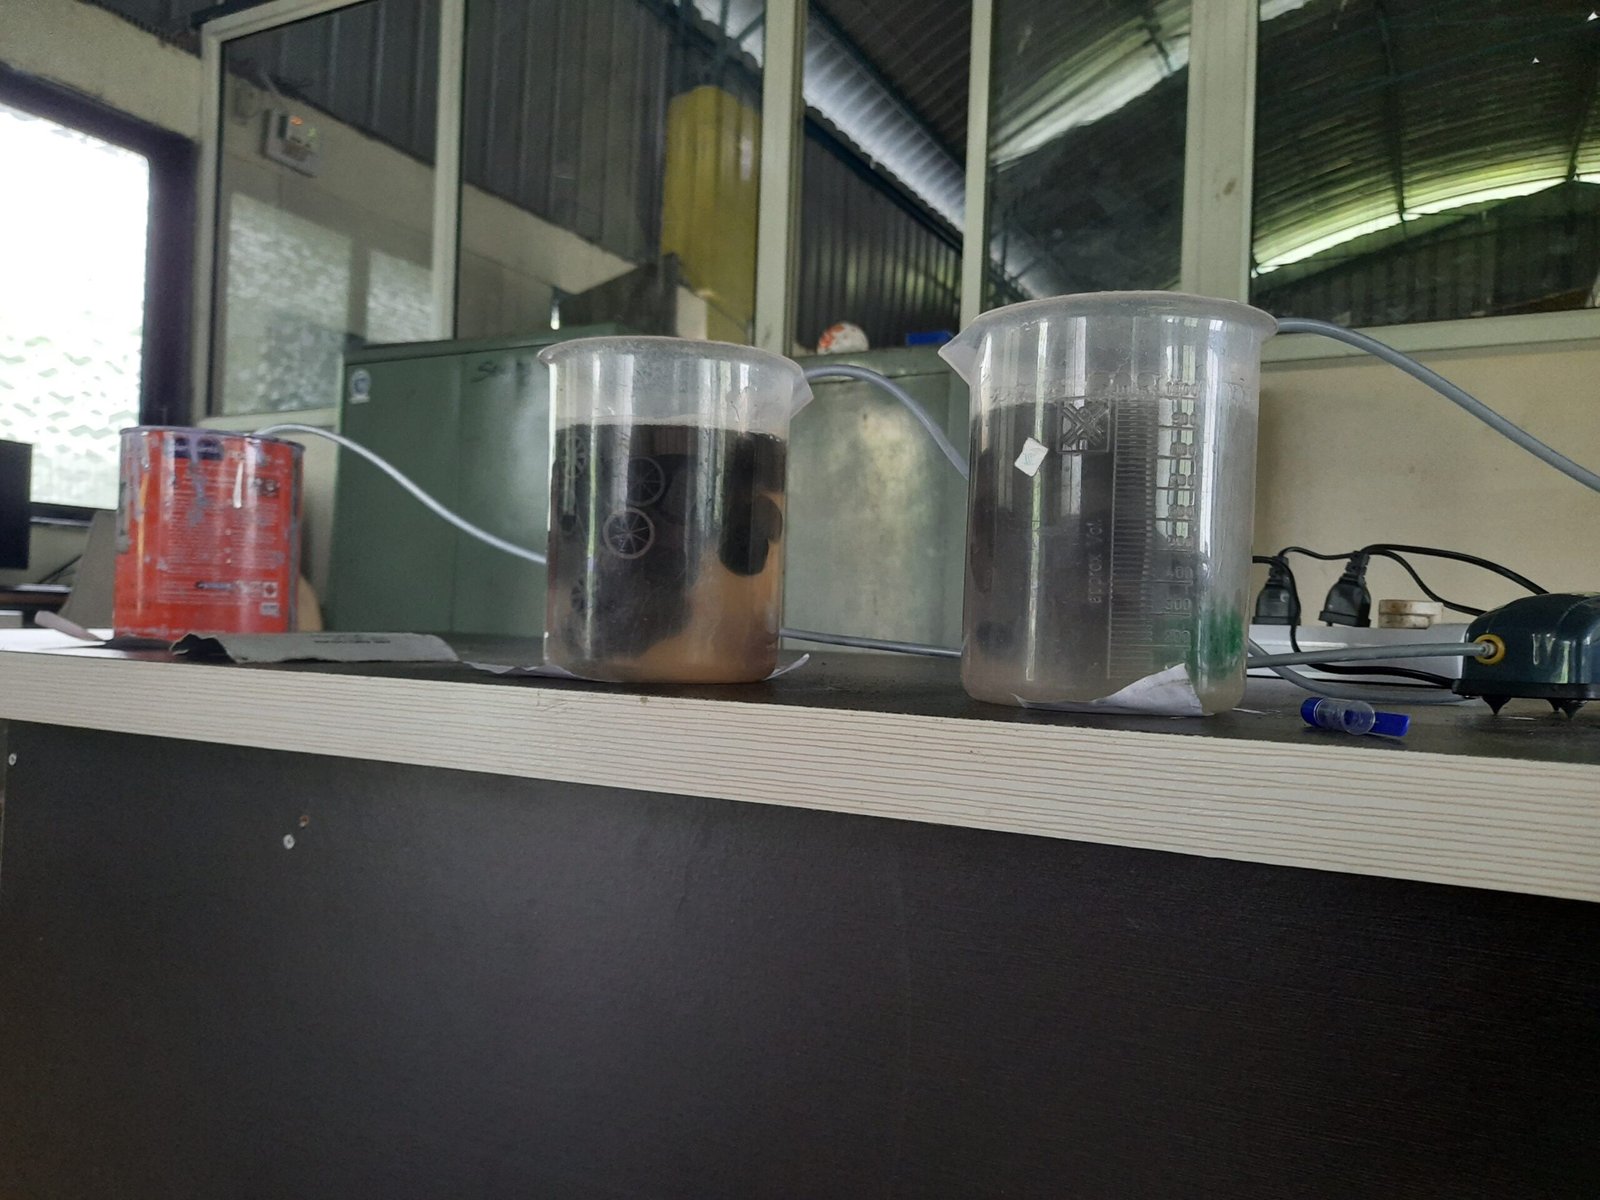
Results:-


Ph change for 30% 
pH change for 40% 
Nitrate change for 30% 
Nitrate change for 30% 
Ammonia for 40% 
Ammonia for 30%
Possible reasons for the Low conversion of Ammonia to Nitrate could be incorporated as follows
Anaerobic Ammonia Oxidizing (Annamox) Bacteria
These Bacteria can oxidize Ammonia Using Nitrite as the oxidant and form Nitrogen gas as an end product.
- First Nitrite is reduced to Nitric oxide by nitrate reductase.
- Hydrazine synthase combines with ammonia and nitric oxide to form highly volatile and reactive hydrazine.
- Hydrazine is oxidized to nitrogen gas by hydrazine dehydrogenase releasing four electrons that are used to provide energy to the early steps of the pathway.
Inhibition due to Free ammonia(FA) and Free nitrous acid(FNA)
High concentration of Free ammonia can inhibit nitrification. In Aerobic nitrifying reactors operated under constant aeration and agitation. Ammonia can be lost from the system by volatization. On the other hand the ammonia oxidation to nitrate produces protons and leads to acidification of environment. this decrease in pH value can inhibit nitrification by diminishing the availability of ammonia. The ammonia will be in the solution as the ammonium ion (NH4+) and unionized ammonia (NH3). This will be in equilibrium that is affected by pH of the solution. When pH increases the concentration of ammonia increases.
The oxidation of ammonia to nitrite is a relatively fast process then the oxidation of nitrite to nitrate. Nitrite depresses both respiration and growth of nitrosomonas. Nitrobacter is sensitive to ammonium ion but even more to free ammonia. As nitrite oxidation occurs there is a release of H+ ions that decrease the pH to an extent related to the buffering capacity of the system. The nitrite formed will exist in equilibrium with unionized Nitrous acid (FNA). As the pH decreases the concentration of (FNA) increases.
Two processes work to reduce (FA) inhibition. As the pH decrease the ammonia equilibrium will adjust and concentration of (FA) will decrease. In addition the total ammonia concentration decreases as it is oxidized to nitrite. These reductions relieve inhibition of nitrobacters caused by (FA) promoting oxidation of Nitrite to nitrate.
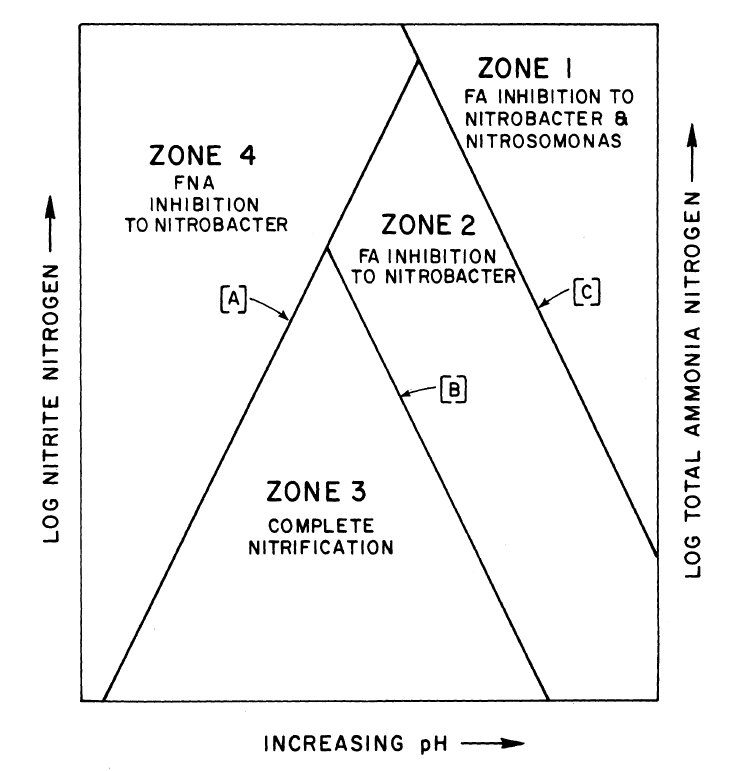
The ranges of (FA) concentration that begin to inhibit the nitrifying organisms are
- (FA) inhibition to nitrosomonas 10 to 150 mg/l
- (FA) inhibition to nitrobacter 0.1 to 1 mg/l
The inhibition of nitrifying bacteria initiates at concentration of (FNA) between 0.22 and 2.8 mg/l
Effect of HRT (Hydraulics retention time)
As seen from the results it is clear that the oxygen uptake by bacteria is less (Day1 to Day3) due to the less nitrate conversion. As the acclimatization time for 30% by volume of biofilm carriers increased the autotrophic nitrifying bacteria started to flourish and started to convert the free ammonia to nitrate. This optimum growth phase was observed during ( Day4 to Day 7/8). After 7/8 days bacteria entered the declining phase as there was lack of sufficient organic matter for their survival resulting in a gradual decrease in the trend line.
Nitrogen loss by Ammonia volatization
Aeration and mixing increase the volatization rate especially when the pH of solution is above 8. Ammonia volatization rate depends on the Ammonia concentration. Since the pKa of ammonia is 9.25 at 25 degree celsius ammonia concentration is relatively low at neutral pH . At high pH ammonia volatization rate is affected by Total ammonia nitrogen(TAN) i.e the ammonium ion and ammonia molecules together, concentration, temperature, aeration rate. Alkaline pH and higher temperature favours the unionized gaseous form. At pH 9.3 50% of ammonia is unionized at pH 8.3 about 10% and pH 7.3 about 1% is unionized. Volatization is thus enhanced at elevated pH due to equilibrium relationships and the resultant increase in the partial pressure of ammonia gas.
Nitrogen loss via Denitrification
Denitrification is carried out by various archaea and facultative heterotrophic bacteria such as achromobacter, aerobacter, acinetobacter, bacillus, brevibacterium, flavabacterium, pseudomonas, protus and microocus. These use nitrate as an electron acceptor and utilize the dissolved organic carbon in the water. Carbon limitation affects the activity of denitrifying bacteria which causes the accumalation of intermediate product such as NO and N2O and also results in Nitrate reduction to ammonium ion via the dissimilatory nitrate reduction to ammonia(DNRA).
Nitrogen loss via assimilation of heterotrophic bacteria
Heterotrophic bacteria co exist with nitrifiers and become dominant when organic carbon concentration or C:N ratio increases leading to generation of high quantity of nitrogen loss in anoxic condition and excess microbial biomaas in the form of sludge. Heterotrophs utilize Ammonium ion, nitrate, and organic carbon for cell growth so that they will be more dominant when organic carbon is available due to higher growth rate than the autotrophs. The high growth rate results in dominance of heterotrophs over autotrophs at high C:N ratio. Heterotrophs grow by consuming dissolved organic carbon under aerobic conditions. In a system where heterotrophs and nitrifiers coexist the rates of nitrate production,(TAN) consumption were reduced by 24%,56%,73% at C:N ratios of 0.5, 1, 1.5 respectively.
About Bacterial Culture
Autotrophic And Heterotrophic bacteria
Chemosynthetic autotrophic bacteria derive their energy from inorganic compounds . And heterotrophic bacteria derive their energy from organic compounds, Nitrifying bacteria are primarily autotrophs which consume Carbon di oxide and obligate aerobes which require oxygen to grow. In the autotrophic nitrification process as opposed to heterotrophic processes very small amount of bacterial biomass are produced. And because of the relatively slow maximum growth rate of nitrifying bacteria in a suspended growth process it becomes very easy to wash out the nitrifying bacteria as opposed to a fixed film system.
Systems having a consortium and C:N ratios high, heterotrophs are capable of outperforming and significantly inhibiting nitrification. At C:N ratios between 1 and 2 there is a 70% reduction of (TAN) removal rate as compared to C:N =0
High concentration of heterotrophs in biofilters drastically lowers the Dissolved oxygen and promotes anoxic condition which causes denitrification and nitrogen loss via N2O and N2 gas.
Nitrifying bacteria Require Alkaline pH (7 to 8.5) for optimal growth. At pH > 8.5 nitrobacter may be inhibited more than nitrosomonas resulting in accumalation of nitrite.
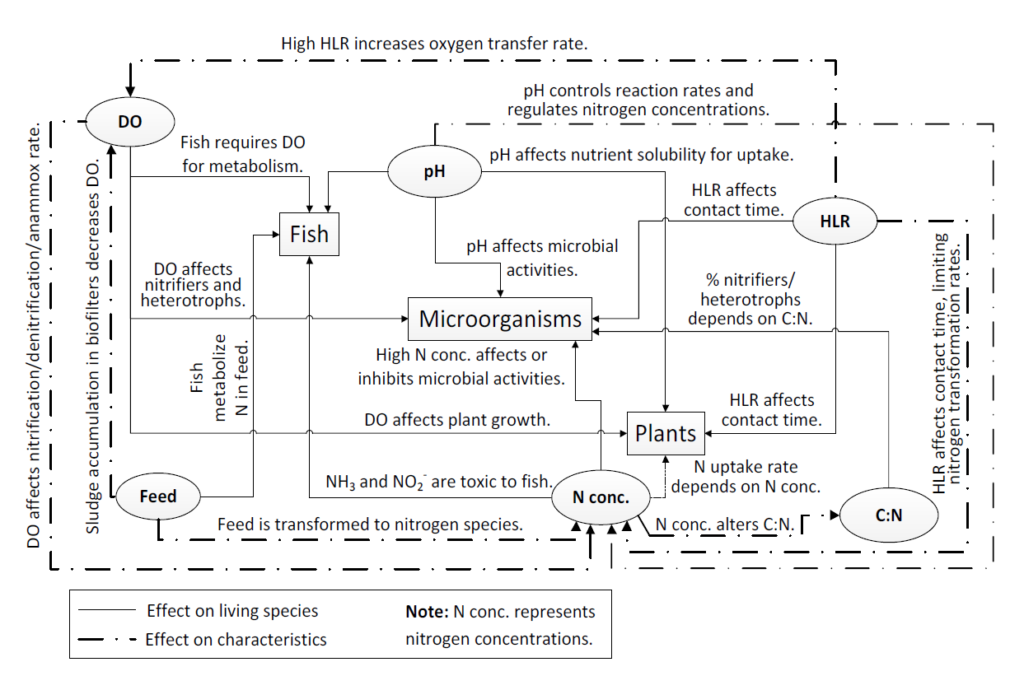
Closed system:-
As the reasons stated above and the results obtained give us a clear indication that the amount of ammonia that was in the system has been mostly lost due to volatization. And the bacterial cultures need to be optimized. And therefore there was a major need for us to shift to a closed system. And since there are heterotrophic bacteria in the solution which rely on the organic carbon source, the nitrogen source of changed from urea to liquor ammonia.
Experimentation:-
An experiment was setup at Vigyan ashram soil testing lab, Pune. A pressure cooker of 3L capacity was chosen as a reactor. The complete setup was of 1L . And the pump with a diffuser at the end of it were kept inside the reactor so that the pump generates the air that is inside the reactor. And therefore it forms a completely closed system. 500 ppm of liquor ammonia was added to the system.
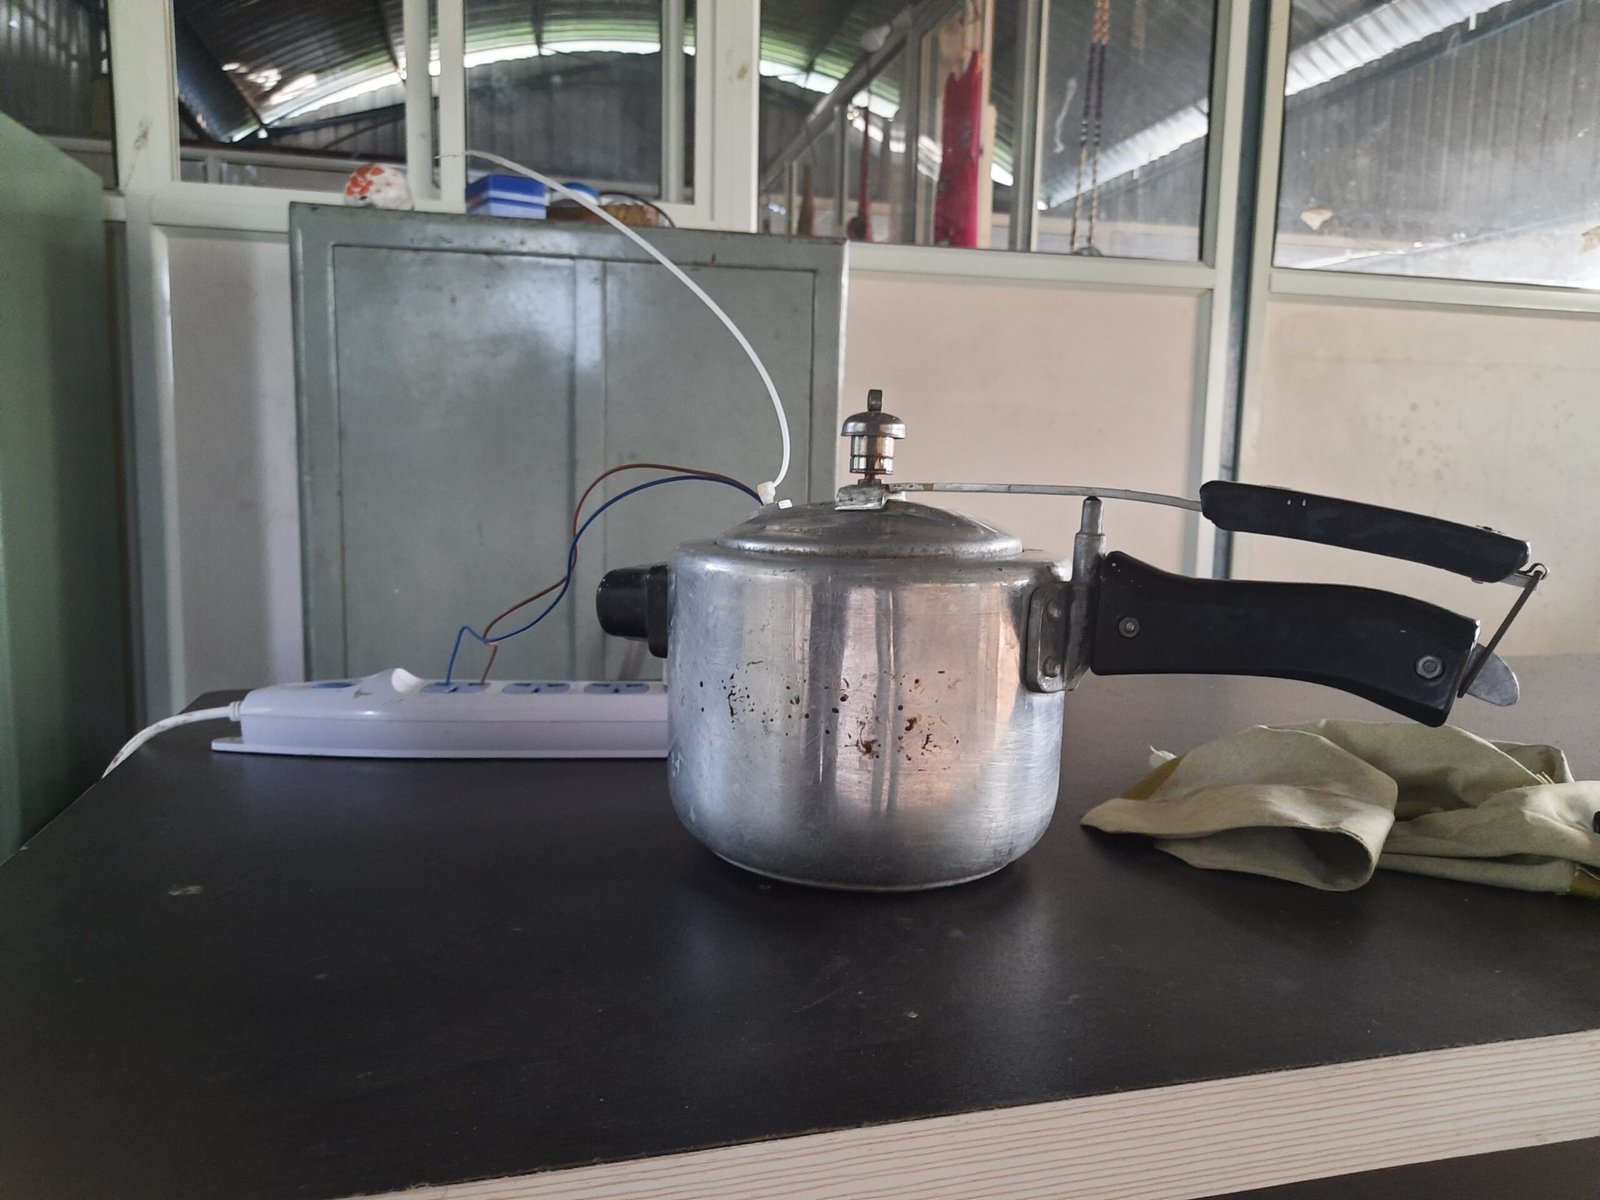
Experimental data:-
- Precise weight of One Biofilm Carrier = 1.093 g
- Volume of The biofilm carriers = 500ml (50% by volume)
- No of biofilm carriers inside the reactor = 61
- Weight of biofilm carriers = 66.673 gms
- Volume of water added = 820 ml
- Volume of bacteria added = 150 ml
Experimental data as on 27/9/20
- TDS(Total Dissolved solids)=696
- EC( Electrical Conductivity)=1490
- pH=8.11
- Temperature=26.3 degree celsius
Amount of oxygen In the reactor:-
As discussed earlier the pump will produce the air that is inside the reactor. Therefore the amount of oxygen in the system would fall short in some amount of time. And the amount of oxygen in the reactor that should brought inside the reactor for proper nitrification is as follows
The reaction of ammonia reacting with oxygen is as follows
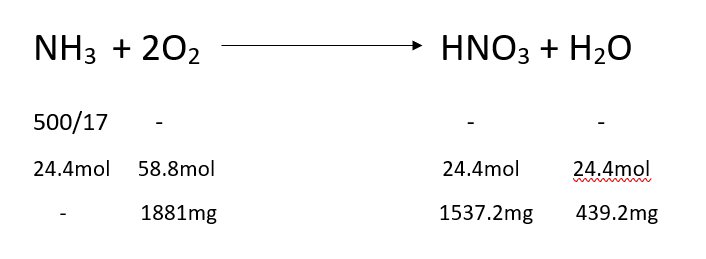
- The amount of oxygen required for complete oxidation of ammonia to nitrate is = 1881mg
- The amount of air inside the reactor is = 2 Lit
- The amount of air inside the reactor in grams = 2*1.22=2.44 gms
- The amount of oxygen inside the reactor= 2.44*0.21 =0.5124gms=512.4mg
- Therefore to cover the amount of oxygen in the reactor for complete nitrification = 1881/512.4mg=3.67 times.
Results:-

As seen from the table there is no significant formation of nitrate in the reactor. And the amount of ammonia in the reactor is huge and is not deteriorating with time. Therefore as discussed earlier the inhibition of ammonia to nitrate forming bacteria starts around 10 to 150ppm. So we decided to check that and so a new setup was done with just 100 ppm of ammonia in it and check the results.

As seen from the above table the nitrate formed was significant on the first day and then slowly goes down with ammonia. The possible reason could be that the nitrifying bacteria have a very slow growth rate and require some time to adapt to the surrounding conditions and then form nitrate. We have also seen in the previous open systems that the bacteria don’t take in oxygen on the first 2-3 days . Therefore there should be some acclimatization time for their proper growth.
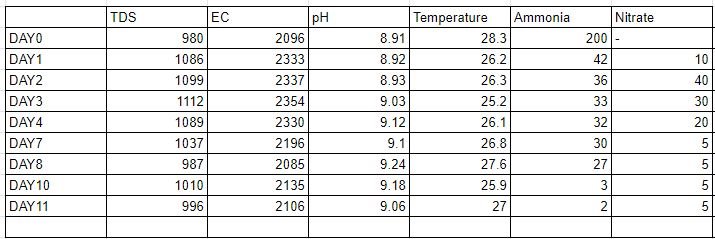
As the table suggests there is no significant amount of nitrate formation and it takes 11 to 12 days for the total ammonia to deteriorate to almost zero from the system. From this we have concluded that there are some amount of nitrifying bacteria in the system but they are not as efficient as they should be. And therefore there is a need for the same.
New Experiment design:-
Due to difficulty in the availability of efficient nitrifying bacteria we decided on working upon COD removal of wastewater. The ultimate goal of this very experiment was to bring down the COD of wastewater to 20 mg/L . For this reason the major work performed is by the heterotrophic and the mixotrophic bacteria. As these are very aggressive and fast growing organisms and with moderate or heavy bubbling can bring down the COD to atleast 80-100 mg/L .
Experimentation:-
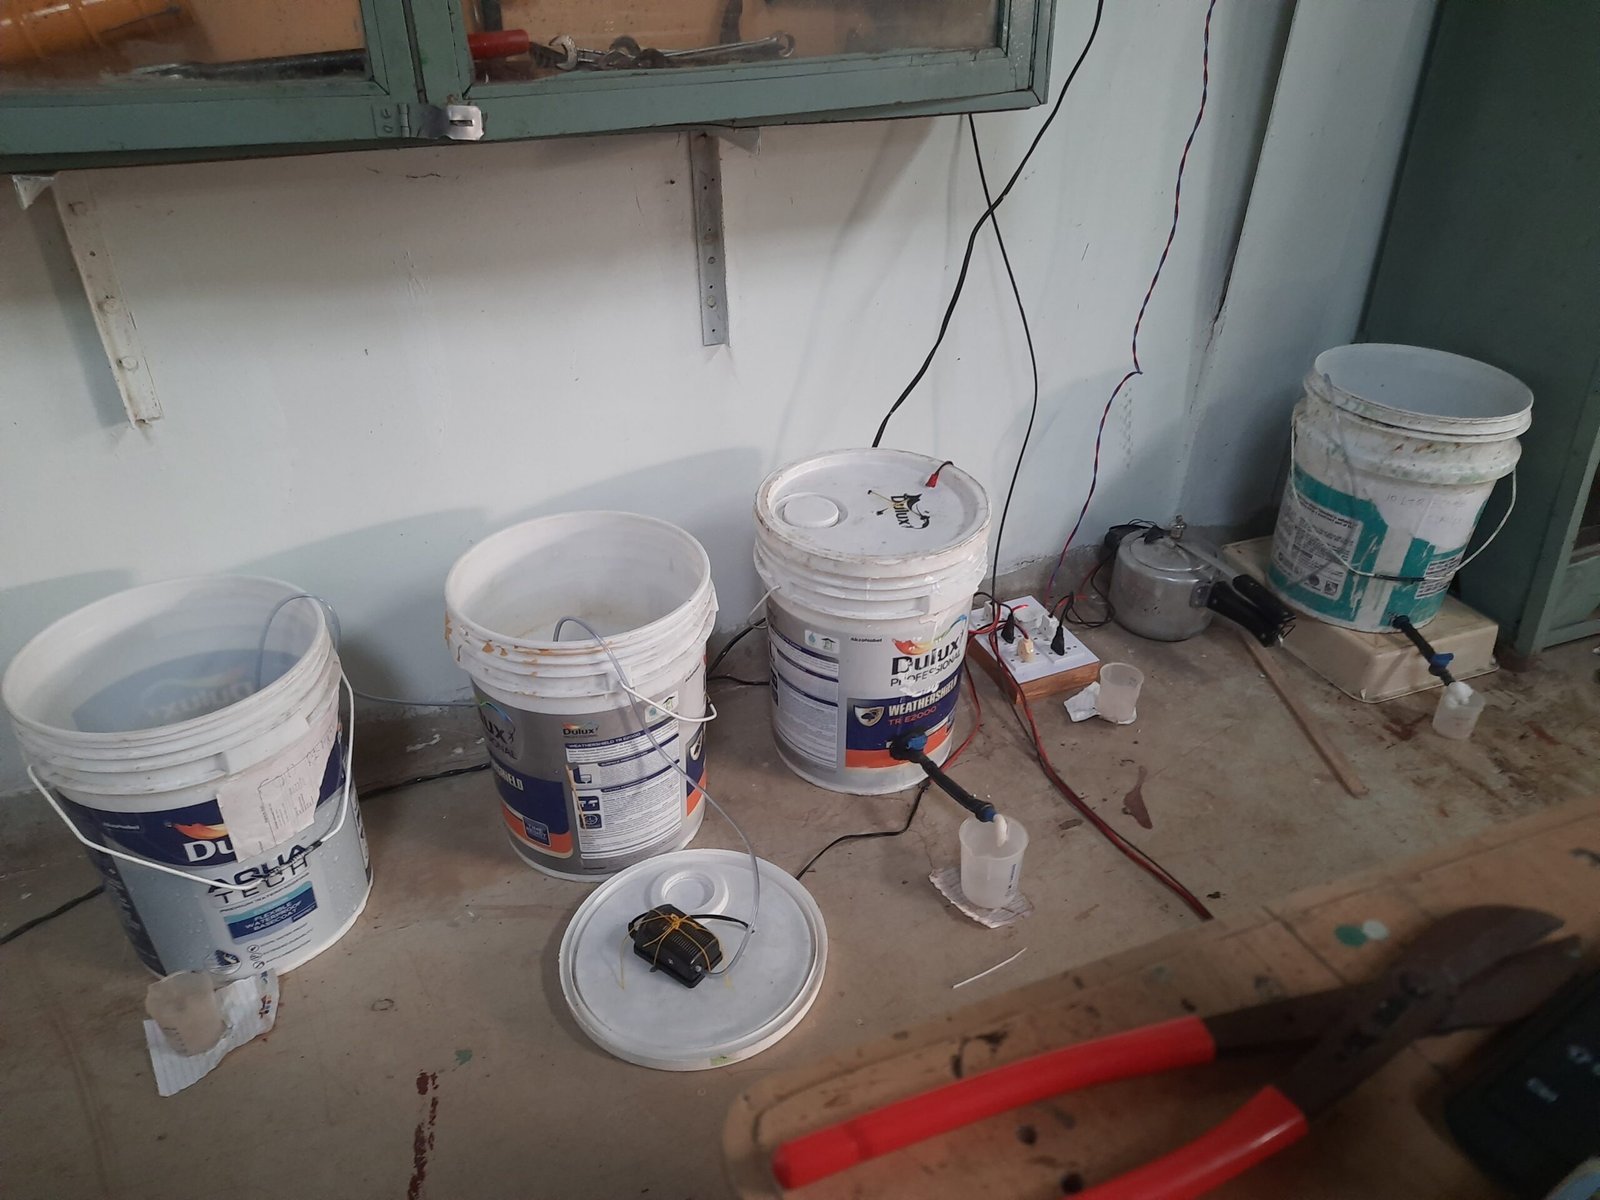
Two new experiments were set up at Vigyan ashram, Pabal. Two buckets of 18L capacity each were chosen as reactors. The actual setup was of 10L . One was a closed system while the other was an open system. In both the systems 750 ml of BARC culture and 200 ppm of ammonia was added.

10Ltr 50% MBBR Closed system 
10Ltr 60% MBBR Open System.
Experiment 1:-
The first experiment was a closed system of 10 L capacity. To this 50% by volume of biofilm carriers were added. A pump of specifications (3W, 3L/min) was enclosed inside the reactor so that it generates the air that is inside the reactor and forms a completely closed system. 750 mL of BARC culture was added to the system with 200 ppm of ammonia.
Data as on 21 October 2020
- TDS (Total dissolved solids) = 503ppm
- EC (Electrical Conductivity) = 1069microS/cm
- pH = 10.08
- Temperature = 26.8degree celsius
Oxygen Requirment:-
NH3 + 2O2 HNO3 + H2O
200/17 – – –
11.76mol 23.52mol 11.76mol 11.76mol
– 752.64mg 740.88mg 211.68mg
- The amount of oxygen required for complete oxidation of ammonia to nitrate is = 752.64mg
- The amount of air inside the reactor is = 8Lit
- The amount of air inside the reactor in grams = 8*1.22=9.76g
- The amount of oxygen inside the reactor= 9.76* 0.21=2.0496g
Therefore there is ample amount of oxygen inside the vessel.
Experiment 2:-
This experiment was a open system Of 10 L capacity. To this 60% by volume of biofilm carriers were added. A pump of specification(2W, 2L/min) was provided for moderate bubbling in the reactor. 750ml of BARC culture was added to the system with 200 ppm of ammonia.
Data as on 24 October 2020
- TDS (Total dissolved solids) = 468ppm
- EC (Electrical Conductivity) = 1508microS/cm
- pH = 9.87
- Temperature = 25.9degree celsius
Results:-
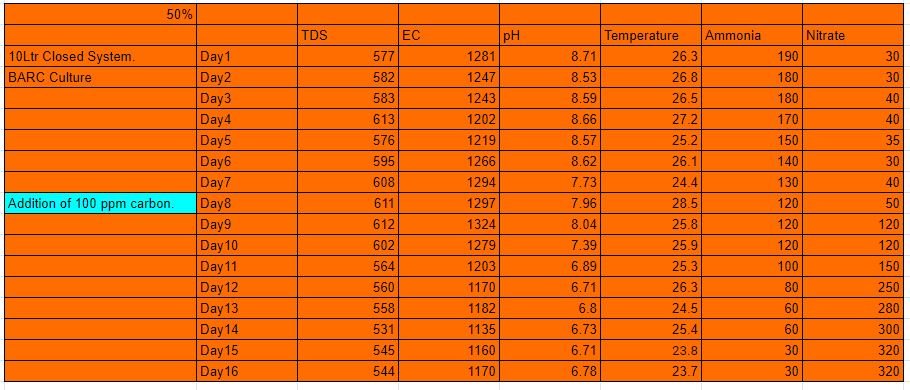
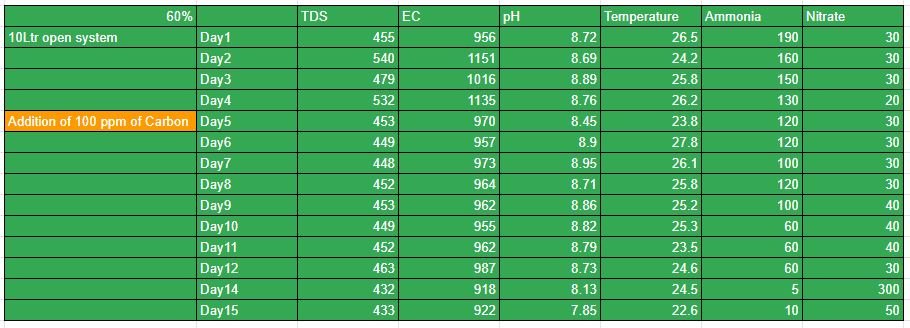

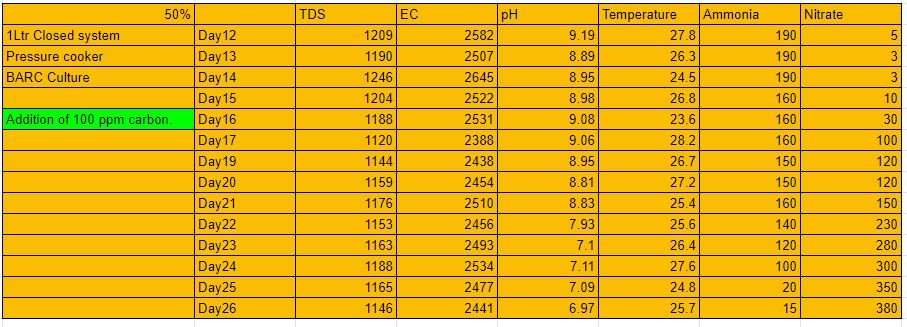

190 ppm of ammonia for closed system 
180 ppm of ammonia for open system 
30 ppm Nitrate formation for closed system 
30 ppm of Nitrate formation for open system 
100 ppm nitrate for 50% closed system as on Day 12

Ammonia for pressure cooker 
Nitrate for Pressure cooker 
Ammonia for 10 Ltr 50% closed system. 
Nitrate for 10 Ltr 50% closed system 
Nitrate for 60% 10 Ltr open System 
Ammonia for 10 Ltr 60%open system 
Ammonia for C:N=1:4 
Nitrate for C:N=1:4
New Experiments:-
In the above experiments the C:N Ratio was kept at 1:2. and as seen above it was showing us some good results. This was decided because not only do these bacteria need ammonia for their cell building but they also need carbon, potassium and other nutrients for their cell development. Therefore carbon was added to the system. Also the literature says in a system where heterotrophs and nitrifiers coexist the rates of nitrate production,(TAN) consumption are reduced by 24%,56%,73% at C:N ratios of 0.5, 1, 1.5 respectively. Therefore we setup a new experiment at C:N Ratio 1:4 .
Experiment design:-
This experiment was a open system of 10 L capacity. To this 50% by volume of biofilm carriers were added. A pump of specification(3W, 3L/min) was provided for moderate bubbling in the reactor. 750ml of BARC culture was added to the system with 200 ppm of ammonia and 1.25 g glucose i.e 50 ppm carbon.
Isolation of nitrifying bacteria:-
As we couldn’t find efficient nitrifying bacteria, we decided to isolate them from grey water system and aquaponics system at Vigyan ashram, Pabal. The samples were collected from the grow beds of grey water system and aquaponics system. The media was prepared a day before by forming solutions of Agar and potato dextrose. After the solidification of the media the samples were added to the above mentioned media.
Conversion and yield of Nitrate:-
1Ltr 50% Closed system (Pressure cooker):-
The system was run for a complete cycle of 27 days. To this system as seen above in the table, there was no significant amount of nitrate formation. To this system, there was an addition of carbon on day 16. The growth of nitrate since then was tremendous as seen above from the table. And reached a peak value of 380ppm. As discussed earlier……
- The amount of nitrate formation for 200 ppm of ammonia(theoretical) = 740.88 mg
- The amount of nitrate formation for 200 ppm of ammonia(experimental) = 380 mg
- % yield of nitrate = 51.35%
- % conversion of nitrate = 48.64%
10 LTR 50% closed system :-
The system was run for a complete cycle of 16 days. To this system as seen above in the table, there was no significant amount of nitrate formation. To this system, there was an addition of carbon on day 8. The growth of nitrate since then was tremendous as seen above from the table. And reached a peak value of 320ppm.
- The amount of nitrate formation for 200 ppm of ammonia(theoretical) = 740.88 mg
- The amount of nitrate formation for 200 ppm of ammonia(experimental) = 320 mg
- % yield of nitrate = 43.24%
- % conversion of nitrate = 56.75%
10LTR 60% open system:-
The system was run for a complete cycle of 15 days. To this system as seen above in the table, there was no significant amount of nitrate formation. To this system, there was an addition of carbon on day 5. The growth of nitrate since then wasn’t as expected as seen above from the table. And reached a peak value of 50ppm.
- The amount of nitrate formation for 200 ppm of ammonia(theoretical) = 740.88 mg
- The amount of nitrate formation for 200 ppm of ammonia(experimental) = 50 mg
- % yield of nitrate = 6.75%
- % conversion of nitrate = 93.24%
C:N = 1:4 50% open system:-
The most effective and the most efficient system of all the above-performed systems was found out to be this system. The complete cycle was of just 9 days. and 390 ppm of nitrate was obtained from the system.
- The amount of nitrate formation for 200 ppm of ammonia(theoretical) = 740.88 mg
- The amount of nitrate formation for 200 ppm of ammonia(experimental) = 390 mg
- % yield of nitrate = 52.7%
- % conversion of nitrate = 47.3%
Therefore it can be concluded from the above-mentioned systems and their respective yields that a system with C: N ratio of 1:4 is an optimal system and attain the best possible nitrate with an acclimatization time of just 9 days.
Human Urine Treatment:-
Urine is a liquid by-product of metabolism in humans. Urine has a major role to play in the Nitrogen cycle. In balanced ecosystems, urine fertilizes the soil and helps the plants to grow. Therefore urine can be used as a fertilizer. Average urine production in adult humans is around 1.4 L of urine per person per day with a normal range of 0.6 to 2.6 L per person per day, produced in around 6 to 8 urinations per day depending on state of hydration, activity level, environmental factors, weight, and the individual’s health. About 91-96% of urine consists of water. Urine also contains an assortment of inorganic salts and organic compounds, including proteins, hormones, and a wide range of metabolites, varying by what is introduced into the body. The total solids in urine are on average 59 g per person per day. Organic matter makes up between 65% and 85% of urine dry solids, with volatile solids comprising 75–85% of total solids. urea is the largest constituent of the solids, constituting more than 50% of the total. On an elemental level, human urine contains 6.87 g/L carbon, 8.12 g/L nitrogen, 8.25 g/L oxygen, and 1.51 g/L hydrogen. The exact proportions vary with individuals and with factors such as diet and health. The composition of urine is given as follows. Note:- These are average values and will differ from person to person.
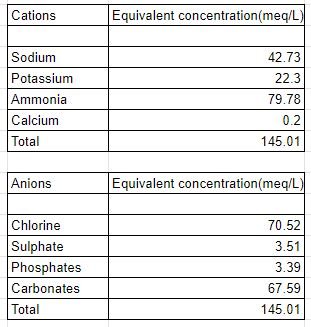
As we can see there is a lot of ammonia and a lot of phosphates in the system. These two are major components or sources for fertilizers. And the recovery of these two minerals is quite essential for the agricultural sector. There are several methods for the recovery of these minerals viz. Evaporation, reverse osmosis, forward osmosis, membrane distillation, Struvite formation, and nitrification. The highest recovery efficiencies and economical of all methods are preferentially nitrification and struvite formation.
Struvite:-
In recent years, increasing levels of phosphorus (P) and nitrogen (N) in waste streams causing eutrophication have gained global attention. Additionally, as phosphate is a non-renewable resource, the price of rock phosphate, used in the production of fertilizer, is expected to increase as reserves are depleted. Consequently, it is important to consider options for the efficient use and preservation of existing phosphate resources. One potential solution may be the precipitation of P and N from liquid waste streams as the mineral struvite (MgNH4PO4 • 6H2O). Struvite is described as a slow-release P fertilizer that can contribute to crop productivity enhancement; therefore, the application of struvite to nutrient-deficient agricultural lands could be of great benefit for agriculture.
Struvite, the common name for magnesium (Mg2+) ammonium (NH+4) phosphate hexahydrate (MgNH4PO4 • 6H2O) is a high-value, slow-release, efficient fertilizer that can be recovered from both solid wastes, such as food, animal and human waste and wastewaters, such as municipal, industrial and agricultural wastewaters. Equimolar concentrations (1:1:1) of Mg2+, NH+4 and PO3-4with alkaline pH and appropriate mixing are necessary to precipitate struvite as a solid. Struvite has a molecular weight of 245.43 g mol-1 and is readily soluble in acidic conditions, sparingly soluble at neutral conditions, but insoluble in alkaline conditions.
With the use of a very cheap source of magnesium like magnesium oxide, Magnesium chloride, magnesite, etc, and by keeping an optimal ratio of Mg:P considerable yield of struvite can be obtained with a phosphorous removal efficiency of 90-95%. The most suitable and most cost-effective magnesium source is magnesium oxide because unlike other sources like magnesium chloride, sulfate or magnesite it doesn’t add on to anions like chlorides, sulfates, and carbonates.
DOE For Nitrification:-
The above mentioned nitrification experiments wee not fully optimized, and the factors considered for efficient nitrification were not much in the above mentioned systems. There fore we took into account all the possible factors and designed the following Experiments.
| Factors | Low | High | |
| Ammonia Concentration(ppm) | 150 | 300 | |
| Flow Rate(L/Min) | 3 | 10 | |
| C:N Ratio | 1:8 | 1:4 | |
| Open Close System | Open | Close |
| Ammonia(A) | Flow rate(B) | C:N(C) | Open Close(D) |
| 150 | 3 | 1:8 | Open |
| 300 | 3 | 1:8 | Open |
| 150 | 10 | 1:8 | Open |
| 300 | 10 | 1:8 | Open |
| 150 | 3 | 1:4 | Open |
| 300 | 3 | 1:4 | Open |
| 150 | 10 | 1:4 | Open |
| 300 | 10 | 1:4 | Open |
| 150 | 3 | 1:8 | Close |
| 300 | 3 | 1:8 | Close |
| 150 | 10 | 1:8 | Close |
| 300 | 10 | 1:8 | Close |
| 150 | 3 | 1:4 | Close |
| 300 | 3 | 1:4 | Close |
| 150 | 10 | 1:4 | Close |
| 300 | 10 | 1:4 | Close |
This is a Full factorial DOE for 4 factors viz. Ammonia concentration, Flow rate, C:N ratio and an Open/ closed system. Therefore as You can see With number of factors summed down to 4 and with a two level factorial 16 experiments can be performed at the most.
But all 16 experiments weren’t possible , therefore we designed an Half factorial Design of experiments with the same 4 factors i.e Ammonia Concentration, Flow rate, C:N ratio, And an open/close system.
| Ammonia(A) | Flow rate(B) | C:N(C) | Open Close(D) |
| 150 | 3 | 1:8 | Open |
| 300 | 3 | 1:8 | Close |
| 150 | 10 | 1:8 | Open |
| 300 | 10 | 1:8 | Close |
| 150 | 3 | 1:4 | Open |
| 300 | 3 | 1:4 | Close |
| 150 | 10 | 1:4 | Open |
| 300 | 10 | 1:4 | Close |
Experiment Design:-
| Experiment 1 | |
| 10 Ltr 50% open System | |
| C:N=1:4 | |
| 150ppm ammonia | |
| 37.5ppm Carbon | |
| 37.5ppm Carbon | |
| 0.9375g Glucose |
| Experiment 2 | |
| 10 Ltr 50% Close System | |
| C:N=1:4 | |
| 150ppm ammonia | |
| 37.5ppm Carbon | |
| 37.5ppm Carbon | |
| 0.9375g Glucose |
| Experiment 3 | |
| 10 Ltr 50% open System | |
| C:N=1:4 | |
| 300ppm Ammonia | |
| 75ppm Carbon | |
| 12ml Ammonia | |
| 1.875g Glucose |
| Experiment 4 | |
| 10 Ltr 50% Close System | |
| C:N=1:4 | |
| 300ppm Ammonia | |
| 75ppm Carbon | |
| 12ml Ammonia | |
| 1.875g Glucose |
| Experiment 5 | |
| 10 Ltr 50% open System | |
| C:N=1:8 | |
| 150ppm ammonia | |
| 18.75Ppm Carbon | |
| 6mL Ammonia | |
| 0.46875g Carbon |
| Experiment 6 | |
| 10 Ltr 50% Closed System | |
| C:N=1:8 | |
| 150ppm ammonia | |
| 18.75Ppm Carbon | |
| 6mL Ammonia | |
| 0.46875g Carbon |
| Experiment 7 | |
| 10 Ltr 50% open System | |
| C:N=1:8 | |
| 300ppm Ammonia | |
| 37.5Ppm Carbon | |
| 12mL Ammonia | |
| 0.9375g Glucose |
| Experiment 8 | |
| 10 Ltr 50% Closed System | |
| C:N=1:8 | |
| 300ppm Ammonia | |
| 37.5Ppm Carbon | |
| 12mL Ammonia | |
| 0.9375g Glucose |
Nitrate Formation For 150 ppm ammonia Systems:-
| NH3 | (+) | 2O2 | (=) | HNO3 | (+) | H2O | |
| 8.823529412 | – | – | – | ||||
| 8.82 | mol | 17.64 | mol | 8.82 | mol | 8.82 | mol |
| – | 564.48 | mg | 555.66 | mg | 158.76 | mg |
Nitrate Formation for 300 Ppm Ammonia:-
| NH3 | (+) | 2O2 | (=) | HNO3 | (+) | H2O | |
| 17.64705882 | – | – | – | ||||
| 17.65 | mol | 35.3 | mol | 17.65 | mol | 17.65 | mol |
| – | 1129.6 | mg | 1111.95 | mg | 317.7 | mg |
Economics And Feasibility of a 10 Guntha Polyhouse Hydropnics unit:-
So we designed all these systems with various factors like C:N ratios, Flow rates, Ammonia Concentrations, open closed systems, liquidspace headspace etc. But we wanted to now if whatever we did till date is it feasible as a system that can replace Calcium nitrate directly. Here is the what we found .
| Area of existing hydroponic unit | 9 | m2 |
| Amount Of Nitrogen Required for 1Kg Palak | 4.4 | gm |
| Amount Of Palak generated from 9m2 per week | 8000 | gm |
| Amount Of Palak generated per m2 per week | 888.8888889 | gm |
| Area of 1 Hydroponic Unit | 27.5 | m2 |
| Area of 10 Guntha | 1000 | m2 |
| Actual Area Occupied by 24 Hydroponic unit | 660 | m2 |
| Amount Of palak Generated per week for 10 Guntha | 586666.6667 | gm |
| Amount of palak generated per day for 10 guntha | 83.80952381 | kg |
| Amount of Nitrogen required for 10 guntha/day | 368.7619048 | gm |
| Atomic Weight of Nitrogen | 28 | gm |
| Weight of Calcium Nitrate | 164 | gm |
| Ratio of Calcium Nitrate to Nitrogen | 5.857142857 | |
| Amount of calcium nitrate required per day for 10 Guntha | 2159.891156 | gm |
| Cost of Calcium Nitrate per day | 144.7127075 | Rs |
| Weight of ammonia | 17 | gm |
| Equivalent weight of calcium Nitrate | 82 | gm |
| Ratio of Equivalent Calcium Nitrate to Nitrogen | 4.823529412 | |
| Amount of ammonia required per day | 447.7823129 | gm |
| Amount of ammonia required per day assuming 52% yield | 861.1198325 | gm |
| Amount of ammonia in 1 Lit | 0.2 | gm |
| Water required for 1gm ammonia | 5 | lit |
| Amount of water per day for 10 guntha assuming 52% yield | 4305.599163 | lit |
| Amount of ammonia required / month | 25833.59498 | gm |
| Amount of Calcium Nitrate required/month | 64796.73469 | gm |
So as you see the amount of ammonia required per month is approximately 25 kg and the amount of calcium nitrate required per month to provide the actual amount of nitrates to the plants is approximately 64 kg. The rate of 1kg Calcium nitrate is Rs 67. And the rate of liquor ammonia per kg is Rs 10. But as you see the amount of water required per day for the present system that we have designed is close 4500 Litres. Therefore for a continuous system we will require 5 tanks of 5000 litres as we considered a cycle time for nitrate formation to be 5 days.
| Raw Material | Cost(in Rs) |
| IBC Tanks(X5) 5000 L | 200000 |
| Air Pump(X5) 35L/min | 14000 |
| Air Oxy tube (Diffusers)(X5) | 3300 |
| 0.5 HP Motor | 3500 |
| Electricity Cost Of Air Pump /Day | 7.2 |
| Electricity Cost of 5 air Pumps /Day | 36 |
| MBBR | 128000 |
| Electricity cost for 0.5 HP motor | 4000 |
| Piping And plumbing | 15000 |
| Rate of Liquor Ammonia /kg | 10 |
| Cost of ammonia required per day | 8.3 |
| Cost of ammonia required per month | 250 |
| Total | 367861.5 |
| Capital Cost | 363818.3 |
| Depreciation+Interest(10%+15%)/month | 7579.547917 |
Results:-
| Open System | TDS | EC | pH | Temperature | Ammonia | Nitrate | Change in ammonia Over time | Yield | |
| 150 ppm | Day1 | 416 | 809 | 8.65 | 25 | 120 | 0 | 30 | 73.87387387 |
| C:N=1:4 | Day2 | 400 | 850 | 8.86 | 23.8 | 100 | 5 | 20 | |
| BARC culture | Day4 | 372 | 796 | 8.45 | 22 | 50 | 10 | 50 | |
| 10 Ltr 50% | Day5 | 303 | 211 | 8.75 | 22.9 | 50 | 50 | 0 | |
| Day6 | 373 | 791 | 7.5 | 24.5 | 40 | 120 | 10 | ||
| Day7 | 365 | 778 | 7.23 | 23.6 | 20 | 220 | 20 | ||
| Day8 | 508 | 1000 | 6.9 | 24.4 | 10 | 320 | 10 | ||
| Day10 | 506 | 1075 | 6.85 | 24.6 | 0 | 410 | 10 |
| Open System | TDS | EC | Temperature | Ammonia | Nitrate | Change in ammonia Over time | Yield | ||
| 300 ppm | Day1 | 497 | 1055 | 8.83 | 24.1 | 250 | 10 | 50 | 67.50675068 |
| C:N=1:4 | Day2 | 407 | 1038 | 8.82 | 23.5 | 240 | 5 | 10 | |
| BARC culture | Day4 | 458 | 975 | 8.43 | 22.2 | 80 | 10 | 160 | |
| 10 Ltr 50% | Day5 | 451 | 961 | 8.75 | 23.2 | 80 | 20 | 0 | |
| Day6 | 436 | 927 | 8.1 | 24.7 | 70 | 100 | 10 | ||
| Day7 | 426 | 908 | 7.62 | 23.8 | 60 | 220 | 10 | ||
| Day8 | 566 | 1203 | 6.92 | 24.6 | 50 | 330 | 10 | ||
| Day10 | 552 | 1178 | 6.35 | 23.1 | 30 | 450 | 20 | ||
| Day12 | 625 | 1310 | 6.12 | 23.5 | 15 | 680 | 15 | ||
| Day14 | 655 | 1395 | 6.01 | 22.4 | 5 | 740 | 10 | ||
| Day17 | 674 | 1456 | 6.08 | 19.3 | 0 | 750 | 5 |
| Open System | TDS | EC | pH | Temperature | Ammonia | Nitrate | Change in ammonia Over time | Yield | |
| 150 ppm | Day1 | 406 | 864 | 8.66 | 24.6 | 140 | 10 | 60 | 85.58558559 |
| C:N=1:8 | Day2 | 420 | 892 | 8.61 | 23.5 | 140 | 5 | 0 | |
| BARC culture | Day4 | 400 | 858 | 8.25 | 22.7 | 120 | 80 | 20 | |
| 10 Ltr 50% | Day5 | 404 | 861 | 8.52 | 23.5 | 100 | 100 | 20 | |
| Day6 | 390 | 829 | 8.35 | 24.9 | 100 | 190 | 0 | ||
| Day7 | 371 | 784 | 7.91 | 23.6 | 60 | 230 | 40 | ||
| Day8 | 540 | 1146 | 7.36 | 24.7 | 30 | 290 | 30 | ||
| Day10 | 502 | 1068 | 7.25 | 23.2 | 25 | 320 | 5 | ||
| Day12 | 566 | 1126 | 6.98 | 23.8 | 15 | 460 | 10 | ||
| Day14 | 592 | 1140 | 6.54 | 23.1 | 2 | 470 | 13 | ||
| Day17 | 602 | 1156 | 6.48 | 20.7 | 1 | 475 | 1 |
| Open System | TDS | EC | pH | Temperature | Ammonia | Nitrate | Change in ammonia Over time | Yield | |
| 300 ppm | Day1 | 450 | 960 | 9.45 | 24.5 | 280 | 10 | 20 | 75.60756076 |
| C:N=1:8 | Day2 | 501 | 1068 | 8.89 | 23.5 | 240 | 5 | 40 | |
| BARC culture | Day4 | 497 | 1053 | 8.32 | 22.7 | 200 | 5 | 40 | |
| 10 Ltr 50% | Day5 | 401 | 1022 | 8.64 | 23.4 | 180 | 10 | 20 | |
| Day6 | 463 | 907 | 8.74 | 25.1 | 170 | 30 | 10 | ||
| Day7 | 438 | 930 | 8.52 | 23.8 | 120 | 60 | 50 | ||
| Day8 | 595 | 1268 | 8.26 | 25 | 120 | 150 | 0 | ||
| Day10 | 594 | 1263 | 8.01 | 23 | 100 | 200 | 20 | ||
| Day12 | 576 | 1226 | 7.89 | 23.9 | 100 | 250 | 0 | ||
| Day14 | 628 | 1345 | 7.23 | 23.5 | 90 | 450 | 10 | ||
| Day17 | 655 | 1403 | 6.98 | 20.9 | 80 | 660 | 10 | ||
| Day19 | 685 | 1465 | 6.78 | 21.3 | 50 | 780 | 30 | ||
| Day21 | 723 | 1548 | 6.56 | 20.6 | 20 | 820 | 30 | ||
| Day24 | 756 | 1612 | 6.25 | 21.3 | 5 | 840 | 15 | ||
| Day25 | 766 | 1633 | 6.28 | 21.6 | 1 | 840 | 4 |
| Closed System | TDS | EC | pH | Temperature | Ammonia | Nitrate | Change in ammonia Over time | Yield | |
| 150 ppm | Day1 | 471 | 1003 | 9.06 | 24.6 | 130 | 30 | 20 | 81.08108108 |
| C:N=1:4 | Day2 | 502 | 1071 | 8.55 | 24.5 | 130 | 30 | 0 | |
| BARC culture | Day4 | 507 | 1087 | 7.67 | 23.6 | 120 | 40 | 10 | |
| 10 Ltr 50% | Day5 | 522 | 1098 | 8.13 | 24.4 | 110 | 100 | 10 | |
| Day6 | 517 | 1102 | 7.92 | 25.9 | 90 | 180 | 20 | ||
| Day7 | 500 | 1062 | 7.64 | 24.7 | 90 | 230 | 0 | ||
| Day8 | 571 | 1214 | 7.41 | 25.8 | 70 | 280 | 20 | ||
| Day10 | 506 | 1075 | 7.01 | 23.5 | 60 | 350 | 10 | ||
| Day12 | 549 | 1169 | 7.16 | 24.7 | 50 | 350 | 10 | ||
| Day14 | 582 | 1198 | 7.08 | 24.2 | 40 | 370 | 10 | ||
| Day17 | 612 | 1265 | 7.04 | 21.8 | 40 | 380 | 0 | ||
| Day19 | 623 | 1396 | 6.82 | 20.3 | 20 | 440 | 20 | ||
| Day21 | 625 | 1398 | 6.8 | 20.1 | 10 | 440 | 10 | ||
| Day24 | 652 | 1410 | 6.75 | 21.9 | 2 | 450 | 8 |
| Closed System | TDS | EC | pH | Temperature | Ammonia | Nitrate | Change in ammonia Over time | Yield | |
| 300 ppm | Day1 | 497 | 1063 | 9.47 | 24.3 | 280 | 5 | 20 | 72.90729073 |
| C:N=1:4 | Day2 | 552 | 1177 | 9.2 | 24.3 | 250 | 5 | 30 | |
| BARC culture | Day4 | 607 | 1079 | 7.72 | 23.5 | 240 | 10 | 10 | |
| 10 Ltr 50% | Day5 | 610 | 1282 | 8.2 | 24.2 | 220 | 40 | 20 | |
| Day6 | 612 | 1296 | 8.02 | 25.8 | 200 | 120 | 20 | ||
| Day7 | 587 | 1242 | 7.79 | 24.8 | 190 | 230 | 10 | ||
| Day8 | 655 | 1397 | 7.58 | 25.4 | 180 | 340 | 10 | ||
| Day10 | 603 | 1292 | 7.22 | 23.4 | 160 | 460 | 20 | ||
| Day12 | 586 | 1249 | 7.1 | 24.6 | 120 | 520 | 40 | ||
| Day14 | 611 | 1356 | 6.9 | 23.9 | 100 | 590 | 20 | ||
| Day17 | 675 | 1498 | 6.89 | 21.9 | 75 | 680 | 25 | ||
| Day19 | 607 | 1292 | 6.63 | 21.6 | 50 | 770 | 25 | ||
| Day21 | 624 | 1342 | 6.55 | 21.3 | 20 | 800 | 30 | ||
| Day24 | 640 | 1388 | 6.48 | 20.6 | 5 | 810 | 15 | ||
| Day25 | 645 | 1398 | 6.46 | 20.9 | 1 | 810 | 4 |
| Closed System | TDS | EC | pH | Temperature | Ammonia | Nitrate | Change in ammonia Over time | Yield | |
| 150 ppm | Day1 | 409 | 869 | 9.19 | 24.2 | 140 | 20 | 60 | 88.28828829 |
| C:N=1:8 | Day2 | 522 | 1111 | 8.64 | 25.2 | 140 | 20 | 0 | |
| BARC culture | Day4 | 561 | 1194 | 7.47 | 23.5 | 130 | 40 | 10 | |
| 10 Ltr 50% | Day5 | 562 | 1193 | 7.86 | 24.3 | 120 | 100 | 10 | |
| Day6 | 556 | 1105 | 7.94 | 25.9 | 110 | 120 | 10 | ||
| Day7 | 556 | 1186 | 7.85 | 24.8 | 110 | 140 | 0 | ||
| Day8 | 674 | 1433 | 7.56 | 25.7 | 100 | 190 | 10 | ||
| Day10 | 645 | 1376 | 7.02 | 23.5 | 80 | 290 | 20 | ||
| Day12 | 623 | 1315 | 7.09 | 24.6 | 70 | 390 | 10 | ||
| Day14 | 611 | 1305 | 7.11 | 24.3 | 60 | 420 | 10 | ||
| Day17 | 642 | 145 | 7.08 | 21.5 | 50 | 480 | 10 | ||
| Day19 | 629 | 1344 | 6.03 | 21.6 | 30 | 480 | 20 | ||
| Day21 | 635 | 1346 | 6.01 | 22.5 | 15 | 490 | 15 | ||
| Day24 | 649 | 1389 | 6.08 | 21.4 | 2 | 490 | 13 | ||
| Day25 | 647 | 1376 | 6.05 | 21.8 | 0 | 490 | 2 |
Economic Feasibility after the above mentioned results:-
| 300ppm ammonia | ||
| Area of existing hydroponic unit | 9 | m2 |
| Amount Of Nitrogen Required for 1Kg Palak | 4.4 | gm |
| Amount Of Palak generated from 9m2 per week | 8000 | gm |
| Amount Of Palak generated per m2 per week | 888.8888889 | gm |
| Area of 1 Hydroponic Unit | 27.5 | m2 |
| Area of 10 Guntha | 1000 | m2 |
| Actual Area Occupied by 24 Hydroponic unit | 660 | m2 |
| Amount Of palak Generated per week for 10 Guntha | 586666.6667 | gm |
| Amount of palak generated per day for 10 guntha | 83.80952381 | kg |
| Amount of Nitrogen required for 10 guntha/day | 368.7619048 | gm |
| Atomic Weight of Nitrogen | 28 | gm |
| Weight of Calcium Nitrate | 164 | gm |
| Ratio of Calcium Nitrate to Nitrogen | 5.857142857 | |
| Amount of calcium nitrate required per day for 10 Guntha | 2159.891156 | gm |
| Cost of Calcium Nitrate per day | 144.7127075 | Rs |
| Weight of ammonia | 17 | gm |
| Equivalent weight of calcium Nitrate | 82 | gm |
| Ratio of Equivalent Calcium Nitrate to Nitrogen | 4.823529412 | |
| Amount of ammonia required per day | 447.7823129 | gm |
| Amount of ammonia required per day assuming 52% yield | 546.0759914 | gm |
| Amount of ammonia in 1 Lit | 0.3 | gm |
| Water required for 1gm ammonia | 3.33 | lit |
| Amount of water per day for 10 guntha assuming 52% yield | 1820.253305 | lit |
| Amount of ammonia required / month | 16382.27974 | gm |
| Amount of Calcium Nitrate required/month | 64796.73469 | gm |
Economics:-
| Raw Material | Cost(in Rs) | Cost(in Rs) | Cost(in Rs) |
| 200ppm ammonia | 300ppm ammonia | for (1X1) Shettala | |
| IBC Tanks(X5) 5000 L | 200000 | 45000 | 10000 |
| Air Pump(X5) 35L/min | 14000 | 14000 | 14000 |
| Air Oxy tube (Diffusers)(X5) | 3300 | 3300 | 3300 |
| 0.5 HP Motor | 3500 | 3500 | 3500 |
| Electricity Cost Of Air Pump /Day | 7.2 | 7.2 | 7.2 |
| Electricity Cost of 5 air Pumps /Day | 36 | 36 | 36 |
| MBBR | 128000 | 128000 | 128000 |
| Electricity cost for 0.5 HP motor | 4000 | 4000 | 4000 |
| Piping And plumbing | 15000 | 15000 | 15000 |
| Rate of Liquor Ammonia /kg | 10 | 10 | 10 |
| Cost of ammonia required per day | 8.3 | 8.3 | 8.3 |
| Cost of ammonia required per month | 250 | 250 | 250 |
| Total | 367861.5 | 212861.5 | 177861.5 |
| Capital Cost | 363818.3 | 209060 | 174060 |
| Depreciation+Interest(10%+15%)/month | 7579.547917 | 4355.416667 | 3626.25 |
Conclusions:-
Nitrification is a complex operation to be achieved using the MBBR technology. During my internship I have learned a lot about Nitrification and the MBBR technology starting from its basics. The goal was to generate nitrates biologically via a cheap source like ammonia or urea and to replace expensive calcium nitrate which is currently used as a major Nitrogen based fertilizer for hydroponics. During the course of my internship I have learned how to design an Experiment(i.e a Proper DOE) varying the factors like Ammonia concentration, Flow rates, C:N ratios, Liquidspace headspace, Culture concentration etc. While doing these experiments I have learned the different kinds of bacteria and their characteristics rather how they survive, what amount of food is sufficient etc. At first We had achieved a yield of just 4.98%, But after varying the factors as mentioned above we have reached a value as good as 86%. During the course of my internship I have also learned about data analysis, the pH dropping, the possible reactions happening, The amount of total dissolved solids and their indication of what’s happening inside the reactor. This internship has also helped me learn how an industry works, about the economics of a potential product, its feasibility, bill of materials, manpower required for a project and most importantly how to carry out HAZOP(hazard and operability standard).
To achieve efficient nitrification the ammonia levels should be kept not more than 300 ppm. C:N ratios should be maintained at 1:4 or 1:8 i.e for every carbon there should be 4 nitrogen or 8 nitrogen. A minimum Incubation time of 5 days should be given to the Nitrifying bacterial culture since these are very slow growing or slow adapting organisms and they need time to consume oxygen and ammonia and convert it to nitrate. pH should be maintained at 6.5 to 7 and ammonia levels should be kept down as they can inhibit nitrification. Also amount of free nitrous acid should be kept as low as 10 ppm as they too can inhibit the nitrifying bacteria. For close systems make sure the amount of oxygen inside the system is enough for the whole nitrification process. If not then the systems need to be opened for as many as times the oxygen required for the system. DO(Dissolved oxygen) should be maintained over 2 mg/L. This Internship also helped me to enhance my skills in wastewater treatment, and I learned to rectify and handle the errors encountered while performing the experiments.
RECOMMENDATIONS FOR EFFICIENT MBBR SYSTEM FOR HYDROPONICS:-
● For achieving Efficient nitrification Keep the Ammonia levels not greater than 300ppm.
● Keep the Carbon Nitrogen ratios at 1:4 or 1:8 that is for every carbon there should be four nitrogens, or for every carbon there should be 8 nitrogens.
● A minimum Incubation time of 5 days should be given to the Nitrifying bacterial culture since these are very slow growing or slow adapting organisms and they need time to consume oxygen and ammonia and convert it to nitrate.
● When the system is incubated the nitrates start to form in a huge amount and you need to check if the amount of nitrates are suitable for the growth of the crop.
● Proper aeration should be provided through air pumps with proper flow rates and proper diffusers should be provided so that there is efficient mass transfer in the system.
● DO(Dissolved oxygen) should be maintained over 2 mg/L.
- pH should be maintained at 6.5 to 7 and ammonia levels should be kept down as they can inhibit nitrification.Also amount of free nitrous acid should be kept as low as 10 ppm as they too can inhibit the nitrifying bacteria.
● For close systems make sure the amount of oxygen inside the system is enough for the whole nitrification process. If not then the systems need to be opened for as many as times the oxygen required for the system.
- A cheap organic carbon Like D-glucose can be given but make sure that it is given in a small amount because the fast growing rather aggressive heterotrophs can dominate the slow growing nitrifiers and then there won’t be proper nitrification.
- Keep the MBBR volume at 50% and give a sufficient aeration rate so that these Biofilm carriers are stagnant and don’t collide with each other every time and the Biofilm on the sides of these carrier damages.


