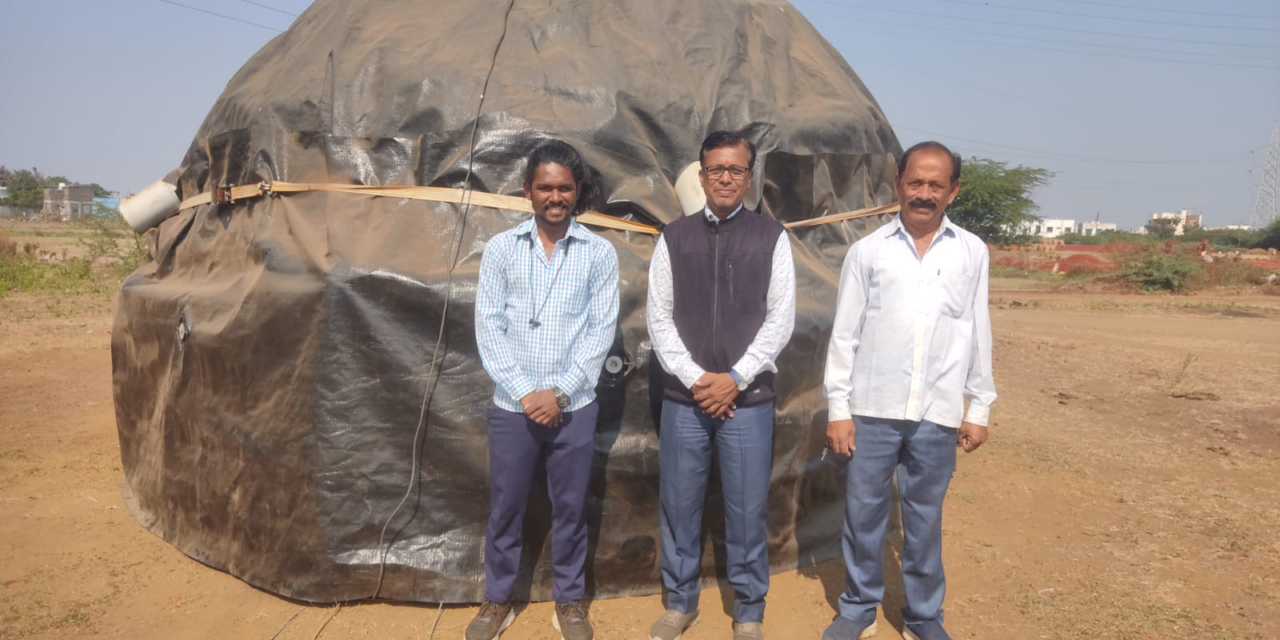
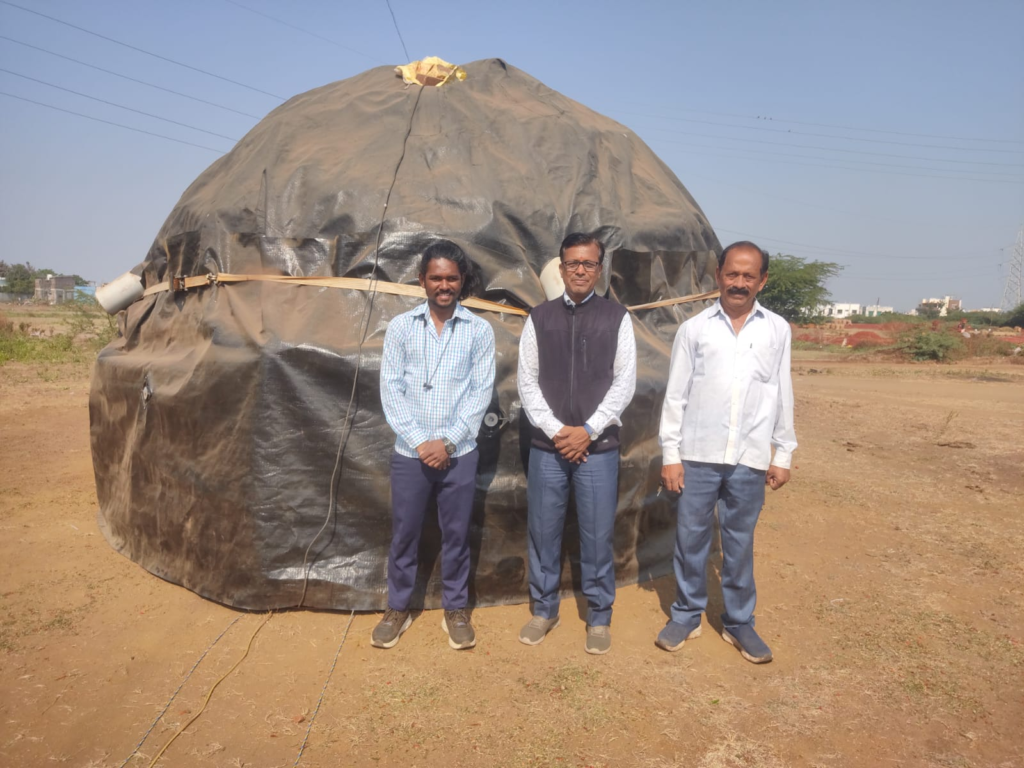
18/12/25 – on the first day, I examined the site near the Chilly dryer. The dryer was perfectly fine with a shaded black sheet. I attached a data logger to various locations to measuring Humidity and temperature. The location of the Data Loggers is as follows
| Sr. No. | Sensor/Point ID | Location Description |
| 1 | DRYER_4 | Above the dome |
| 2 | DRYER_2 | Near the exhaust fan |
| 3 | DRYER_1 | Tray 1 |
| 4 | DRYER_9 | In duct (hot air coming from the heating chamber to the drying chamber at the lower level) |
| 5 | DRYER_5 | Tray 3 |
| 6 | DIC_4 | Tray 5 |
In the evening, I place the Chill in the dome dryer given by Rajesh Kadam (8412998298) in the presence of Raghunath Marathe (7972524149) with the help of three helpers.
I placed the chill in the dome dryer as 5kg per tray in each section has 5 trays, equivalent to 5*5=25kg per section. The dome dryer has 8 sections, so 8*25=200kg of chill been placed at 4 pm.
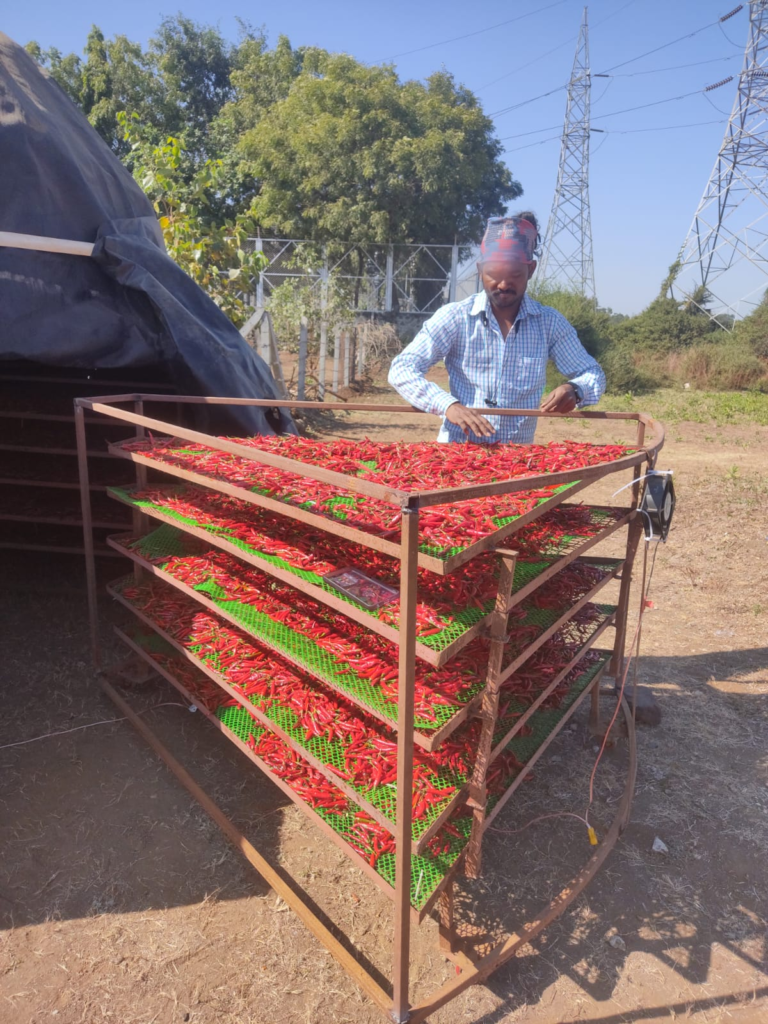
For sampleling I cut the mesh as Prasad Sir instructed, 10*10cm for the upper, middle, and lower tray, i.e., tray 1,3 and 5, respectively. On these trays, I made three sample trays are as follows –
| Sr. No. | Tray ID | Sample Position | Location Description |
| 1 | Tray_1 | 1.1 | Near the exhaust fan |
| 1.2 | Middle of the tray | ||
| 1.3 | Near the central duct | ||
| 2 | Tray_3 | 1.1 | Near the exhaust fan |
| 1.2 | Middle of the tray | ||
| 1.3 | Near the central duct | ||
| 3 | Tray_5 | 1.1 | Near the exhaust fan |
| 1.2 | Middle of the tray | ||
| 1.3 | Near the central duct | ||
For each sample, I placed 50 g of the sample on the 18th Dec 2025 as a total of 9 samples at 3 positions tray.
19/12/25- On the first day of drying, I created the Google sheet for the drying and data logger – https://docs.google.com/spreadsheets/d/155oMZhHAhT4hhW6XFJdL0GluSX1tT_9Ys31YFUCcFJU/edit?usp=sharing

