09/09/24 – 13/09/24
Introduction:
The purpose of growing crops under polyhouse is to create optimum conditions for quality production. Among the factors affecting the production under polyhouse are mainly diseases and pest attacks which require constant monitoring and implementing control measures. It involves a deep understanding of plant biology as well as knowledge of specific pests and diseases that are most likely to affect polyhouse.
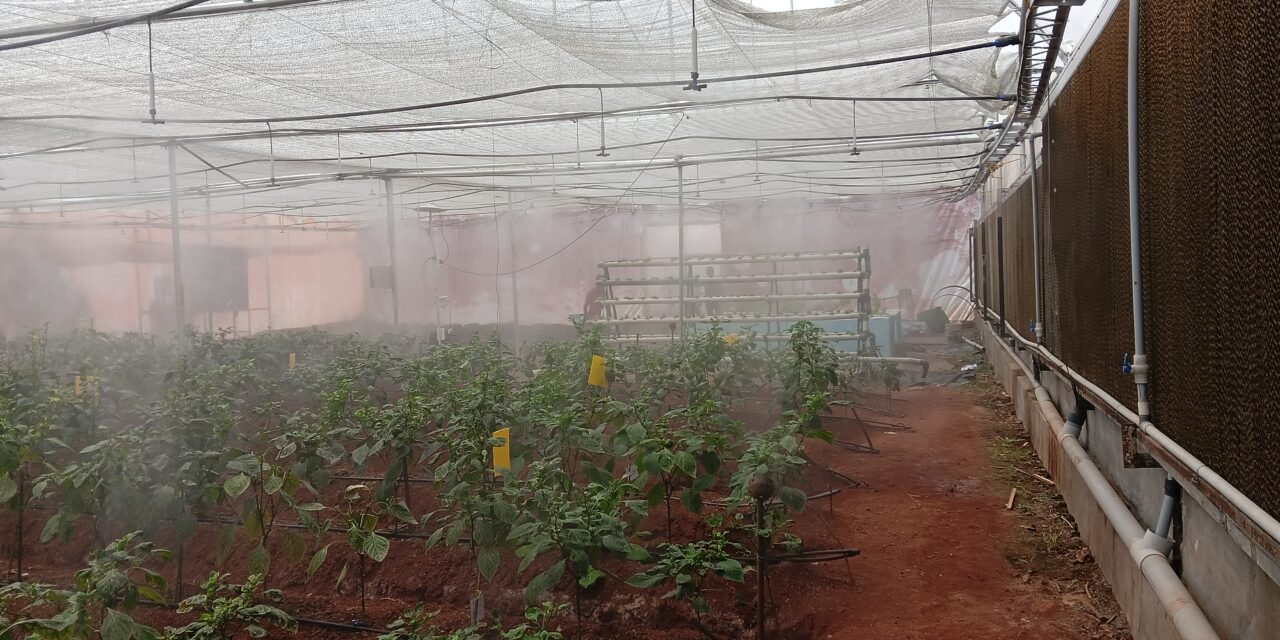
One of the primary preventive measures in disease management is maintaining a controlled and sanitized polyhouse environment that minimizes the risk of disease outbreak. This includes ensuring proper ventilation and air circulation, managing humidity and temperature. So, to prevent polyhouse crop from disease and insect attacks here in polyhouse of Vigyan Ashram, Pabal we are mainly focusing on environment inside polyhouse.
Fogging systems operate by creating a fine mist or ‘fog’ in the greenhouse, which reduces temperature and increases humidity level in a controlled manner. A fogging system primarily contains a high-pressure pump, a distribution network of pipes or tubes, and a series of nozzles. The high-pressure pump is very important for the system ;as it forces water through the distribution network in a controlled manner. As the water reaches the nozzles, it is atomized into microdroplets, and a fine mist or fog is created.
Fan-Pad System consists of exhaust fan at one end of the greenhouse and a pump circulating water through and over a porous pad installed at the opposite end of the exhaust fan. If all vents and doors are closed when fans are operated, air is pulled through the wetted pads and water evaporates. Removing energy from air lowers the temperature of the air being introduced into the greenhouse.
Methodology:
. 1) To collect temperature and humidity data inside polyhouse.
2) To measure the airflow rate and light intensity at various locations.
3) To check the flow rate of foggers.
4) To integrate and analysis above data to design algorithm for polyhouse automation.
As a part of my project decided to check the flow rate of foggers fixed in polyhouse.
Need to check the flow rate of foggers?
. 1) Evenly distribution of water throughout the fogger system.
2) To check how much water is discharged from each foggers.
Process:
- There are total 84 foggers fixed in polyhouse. There are 12 lines each line contains 7 foggers. What I did is collected 36 PET bottles made containers out of it to hang on foggers, so that fogger should discharge it’s flow in container.
- Each line contains 7 foggers, we hanged containers alternately to 3 foggers in each line.
- Kept foggers ‘ON’ for 20 seconds and measured the collected water discharge in containers.
- Repeated the same process 2 times.
Below table contains readings of flow rate measured.
Table: 1.1
| Fogger lines | Containers | Flow rate(ml/20sec)(1) | Flow rate(ml/20sec)(2) |
| 1 | A1 | 65 | 50 |
| A2 | 200 | 200 | |
| A3 | 125 | 130 | |
| 2 | B1 | 230 | 195 |
| B2 | 175 | 170 | |
| B3 | 350 | 225 | |
| 3 | C1 | 60 | 60 |
| C2 | 140 | 150 | |
| C3 | 190 | 190 | |
| 4 | D1 | 175 | 180 |
| D2 | 145 | 170 | |
| D3 | 115 | 150 | |
| 5 | E1 | 120 | 120 |
| E2 | 165 | 170 | |
| E3 | 140 | 160 | |
| 6 | F1 | 170 | 175 |
| F2 | 135 | 140 | |
| F3 | 150 | 175 | |
| 7 | G1 | 150 | 160 |
| G2 | 135 | 175 | |
| G3 | 145 | 150 | |
| 8 | H1 | 150 | 150 |
| H2 | 155 | 150 | |
| H3 | 235 | 230 | |
| 9 | I1 | 145 | 160 |
| I2 | 160 | 165 | |
| I3 | 145 | 150 | |
| 10 | J1 | 370 | 375 |
| J2 | 125 | 160 | |
| J3 | 85 | 100 | |
| 11 | K1 | 140 | 155 |
| K2 | 85 | 135 | |
| K3 | 175 | 170 |
15/9/24-18/9/24
From this day I started collecting temperature and humidity data by devices like hygrometer, digital thermo-hygrometer and air flow with the help of anemometer
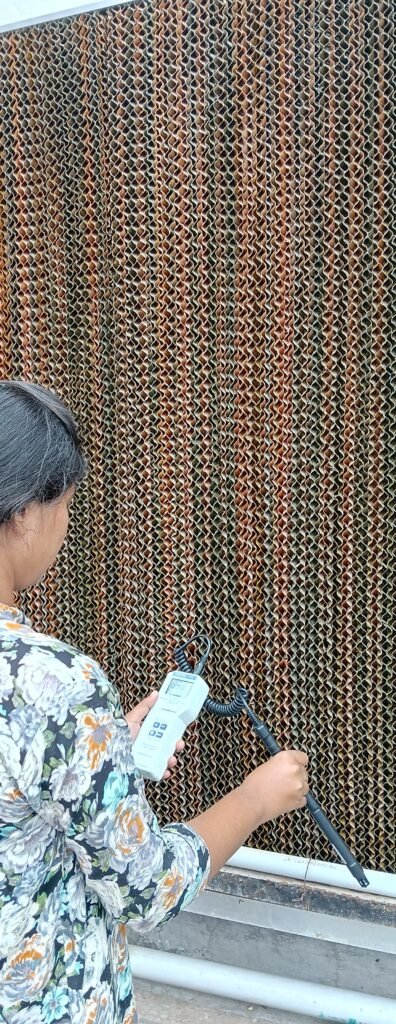
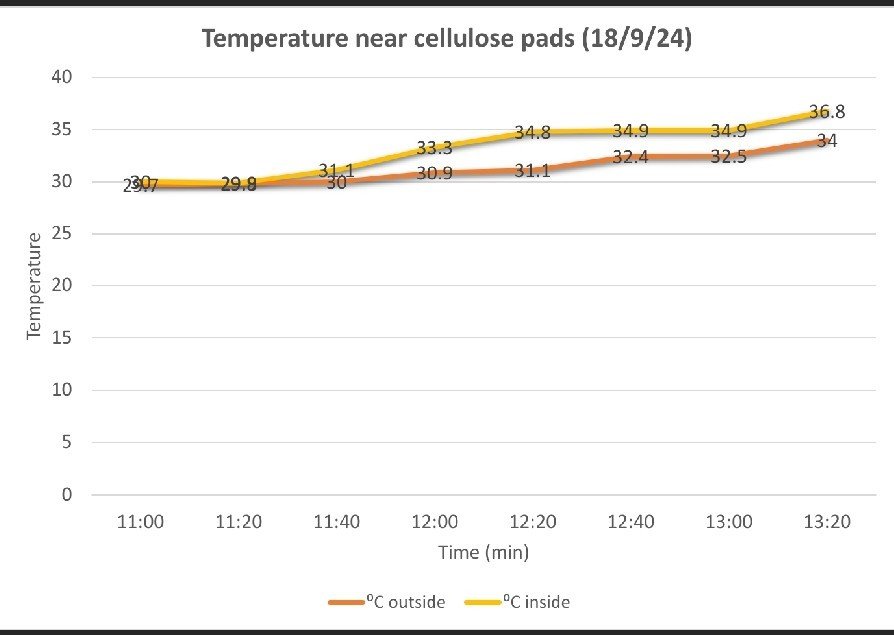
Fig.no. 1.1 Graphical representation of temperature near cellulose pad inside and outside polyhouse in condition when fan pad system and foggers were off.
The above graph represents temperature rise data with respect to time. The data was collected with the help of digital thermo-hygrometer. The above temperature data is of near cellulose pad inside and outside polyhouse in condition when fan pad systems and foggers were ‘OFF’. Overall, this condition was created to observe the temperature rise trend.
| Time | ⁰C outside | ⁰C inside |
| 11:00 | 29.7 | 30 |
| 11:20 | 29.8 | 29.9 |
| 11:40 | 31.1 | 30 |
| 12:00 | 30.9 | 33.3 |
| 12:20 | 31.1 | 34.8 |
| 12:40 | 32.4 | 34.9 |
| 13:00 | 32.5 | 34.9 |
| 13:20 | 34 | 36.8 |
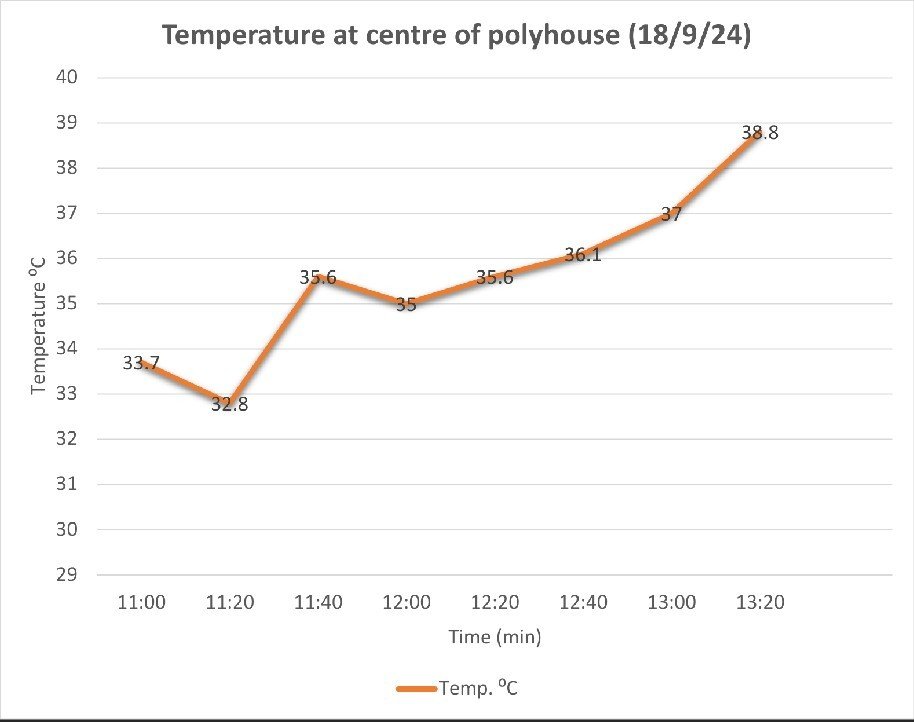
Fig.no. 1.2 Graphical representation of temperature at the center of polyhouse in condition when fan pad system and foggers were off
The above graph represents temperature rise data with respect to time. The data was collected with the help of digital thermo-hygrometer. The above graph represents the temperature rise at the center of poly-house in condition when fan pad systems and foggers were ‘OFF’. Overall, this condition was created to observe the temperature rise trend at the center.
| Time | Temp. ⁰C |
| 11:00 | 33.7 |
| 11:20 | 32.8 |
| 11:40 | 35.6 |
| 12:00 | 35 |
| 12:20 | 35.6 |
| 12:40 | 36.1 |
| 13:00 | 37 |
| 13:20 | 38.8 |
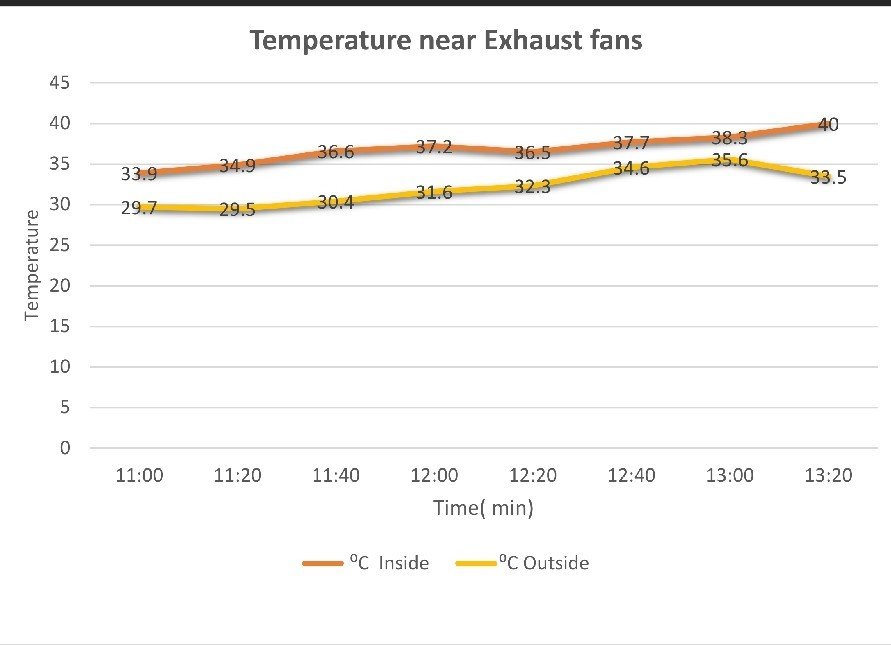
Fig. Graphical representation of Temperature near exhaust fans inside and outside polyhouse when only foggers were kept ‘ON’ within the above interval of time.
| Time | ⁰C Inside | ⁰C Outside |
| 11:00 | 33.9 | 29.7 |
| 11:20 | 34.9 | 29.5 |
| 11:40 | 36.6 | 30.4 |
| 12:00 | 37.2 | 31.6 |
| 12:20 | 36.5 | 32.3 |
| 12:40 | 37.7 | 34.6 |
| 13:00 | 38.3 | 35.6 |
| 13:20 | 40 | 33.5 |
Date: 19/09/24
Data was coll
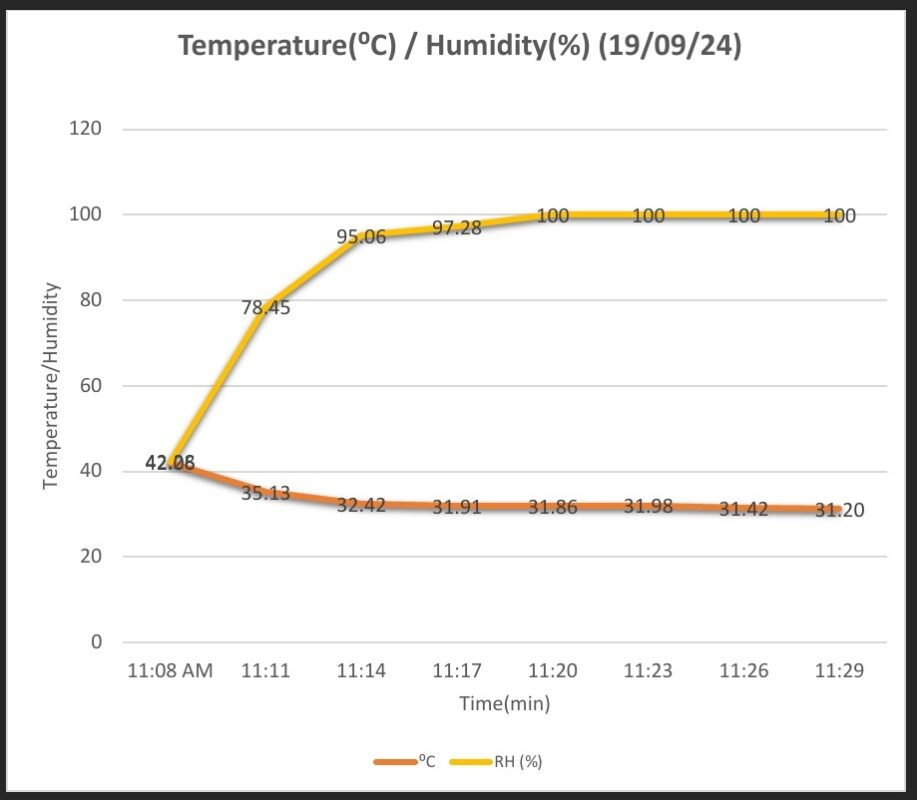
Fig. Graphical representation of Temperature and Humidity at centre location inside the polyhouse when only foggers were kept ‘ON’ within the above interval of time.
The graph represents temperature and humidity at the centre of polyhouse. Data was recorded with the help of data-logger located at the centre inside polyhouse, while the Fan-Pad System and Fogger system was ‘OFF’. Once, the temperature started increasing at it’s peak from 11:08 am the foggers were ‘ON’ and fast temperature decrease was observed till 11:11 am. It is observed between 11:14 am – 11:29 am the humidity was near 100 % or 100 % which stopped temperature drop, hence steady temperature can be seen.
| Time | ⁰C | RH (%) |
| 11:08 | 42.06 | 42.28 |
| 11:11 | 35.13 | 78.45 |
| 11:14 | 32.42 | 95.06 |
| 11:17 | 31.91 | 97.28 |
| 11:20 | 31.86 | 100 |
| 11:23 | 31.98 | 100 |
| 11:26 | 31.42 | 100 |
| 11:29 | 31.20 | 100 |
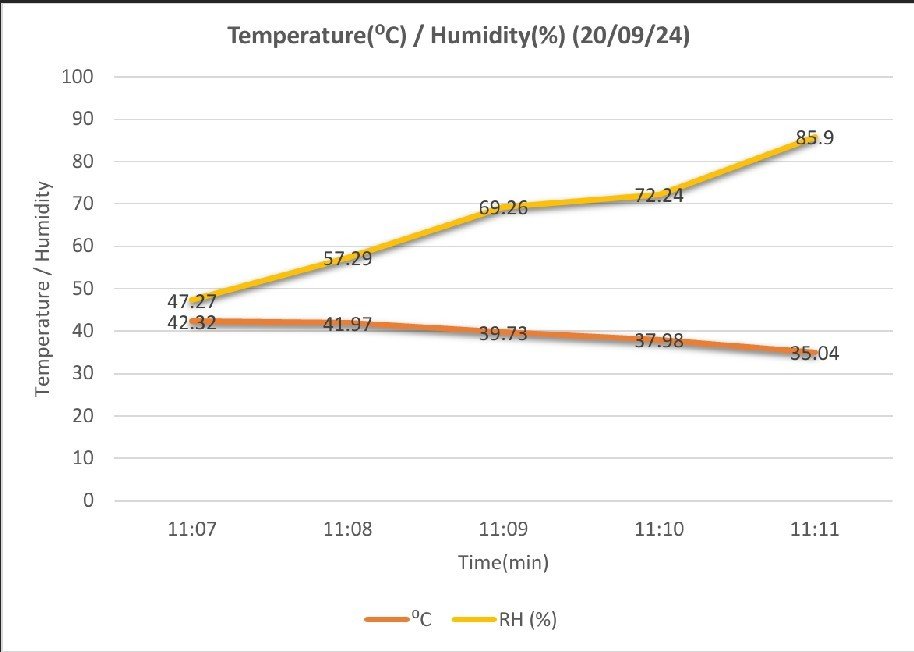
Fig. Graphical representation of Temperature and Humidity at centre location inside the polyhouse when only foggers were kept ‘ON’ within the above interval of time.
Temperature and humidity data were taken from data loggers located at the centre of the polyhouse. The above temperature and humidity data were recorded while fan-pad system was ‘OFF’ ,the pads were dry. At 11:00 in morning the temperature raised at it’s peak was observed, so from 11:07 am – 11:11 am the foggers were kept ‘ON’ to record the temperature drop and increase in humidity within the interval of time
Date: 20/9/24
| Time | ⁰C | RH (%) |
| 11:07 | 42.32 | 47.27 |
| 11:08 | 41.97 | 57.29 |
| 11:09 | 39.73 | 69.26 |
| 11:10 | 37.98 | 72.24 |
| 11:11 | 35.04 | 85.9 |
21/09/24-22/09/24
- Discussions on the above data by Dixit Sir and other members.
- Graph preparation on basis of data recorded.
- Blog writting.
- Common lecture for all.
1/10/24
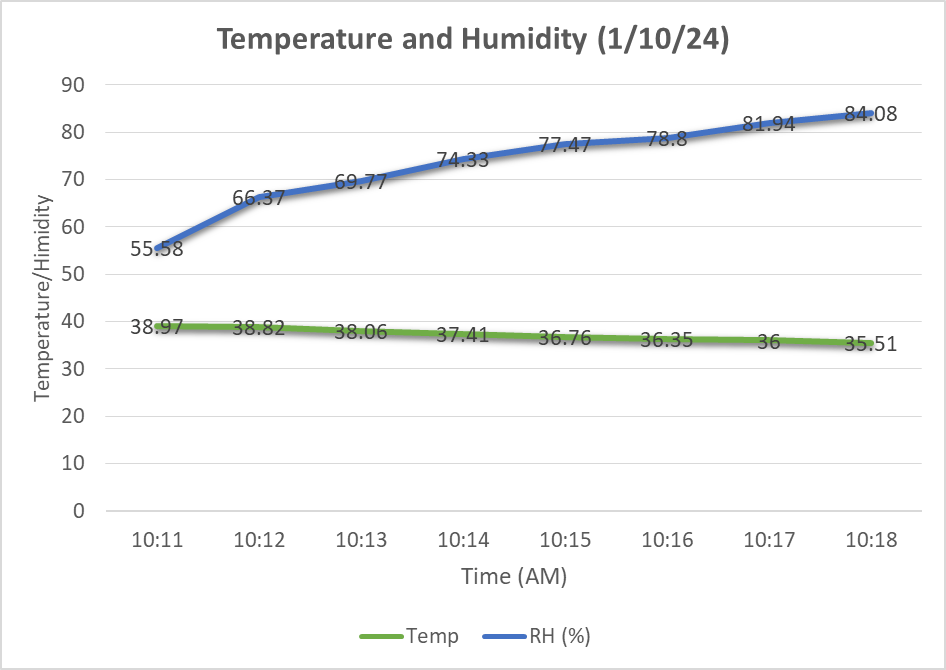
| Time | Temp(°C) | RH (%) |
| 10:11 | 38.97 | 55.58 |
| 10:12 | 38.82 | 66.37 |
| 10:13 | 38.06 | 69.77 |
| 10:14 | 37.41 | 74.33 |
| 10:15 | 36.76 | 77.47 |
| 10:16 | 36.35 | 78.8 |
| 10:17 | 36 | 81.94 |
| 10:18 | 35.51 | 84.08 |
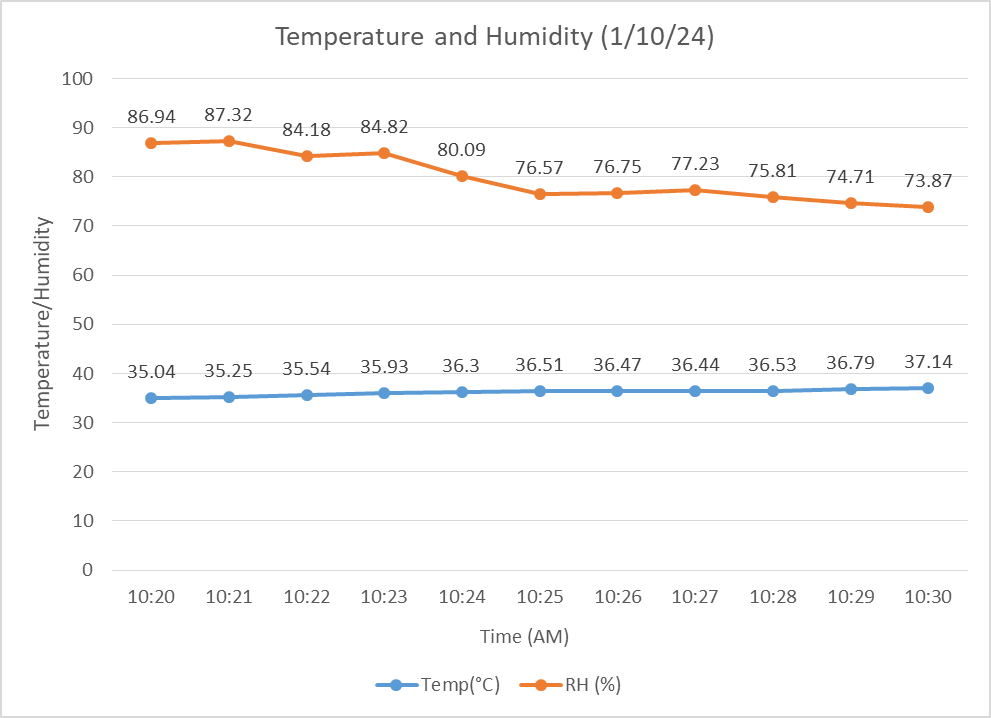
| Temperature rise as the foggers are off | ||
| Time(AM) | Temp(°C) | RH (%) |
| 10:20 | 35.04 | 86.94 |
| 10:21 | 35.25 | 87.32 |
| 10:22 | 35.54 | 84.18 |
| 10:23 | 35.93 | 84.82 |
| 10:24 | 36.3 | 80.09 |
| 10:25 | 36.51 | 76.57 |
| 10:26 | 36.47 | 76.75 |
| 10:27 | 36.44 | 77.23 |
| 10:28 | 36.53 | 75.81 |
| 10:29 | 36.79 | 74.71 |
| 10:30 | 37.14 | 73.87 |
Date: 2/10/24
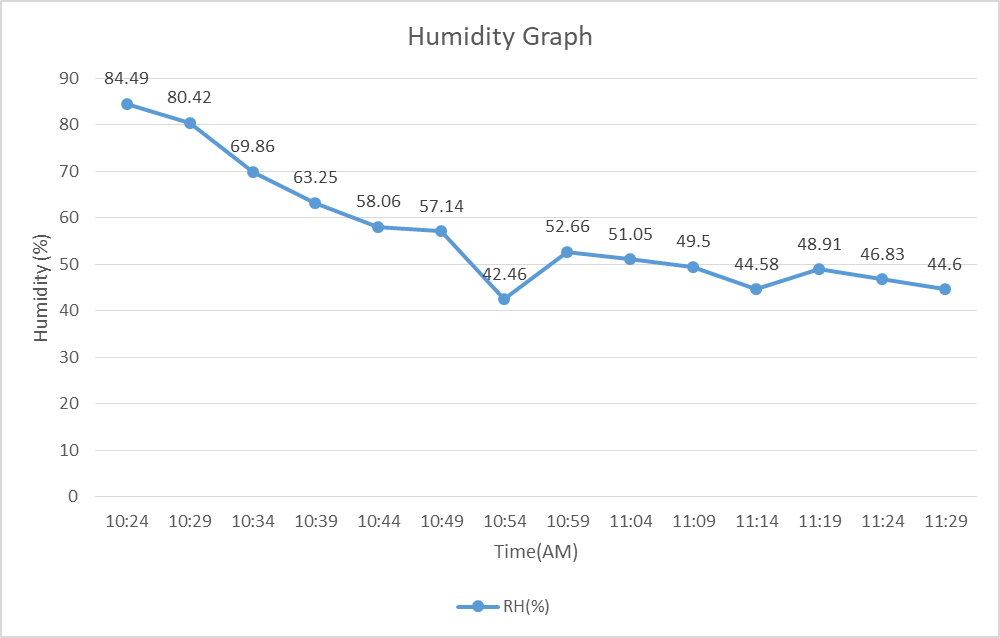
| Temperature rise analysis as soon as the foggers are off’ | ||
| Time | Temp (°C) | RH (%) |
| 10:24 | 35.9 | 84.49 |
| 10:29 | 37.12 | 80.42 |
| 10:34 | 38.99 | 69.86 |
| 10:39 | 40.2 | 63.25 |
| 10:44 | 41.03 | 58.06 |
| 10:49 | 41.8 | 57.14 |
| 10:54 | 42.46 | 42.46 |
| 10:59 | 43.05 | 52.66 |
| 11:04 | 43.63 | 51.05 |
| 11:09 | 44.26 | 49.5 |
| 11:14 | 44.58 | 44.58 |
| 11:19 | 44.86 | 48.91 |
| 11:24 | 45.45 | 46.83 |
| 11:29 | 45.72 | 44.6 |
8/10/24
Today, we discussed with Dixit sir about the calculations regarding volume of air to be exhausted by exhaust fans to get the assumed temperature. Below is the word file which provides details about the discussion.
9/10/24
Polyhouse data call was not taken due to poor weather conditions.
19/10/24
This calculations are done by considering absorption and emission of energy through polyhouse sheet i.e LDPE sheet, surface soil.
22/10/24

To determine the amount of heat emitted by LDPE sheet we measured the total LDPE cover over polyhouse GI skeleton.which was around 733.08 m^2.
12/11/24- 17/11/24
Recorded polyhouse data for doing calculations on water absorbed to remove heat raised by 1 degrees. Effective temperature drop was not getting due to blockages in foggers and only one exhaust fan was running
21/11/24
There were blockages in nozzles of foggers. With the help of DBRT students from agriculture section we removed foggers and did cleaning of nozzles. We connected all the foggers and checked there efficiency. All foggers were working efficiently and no blockages were seen.

After finishing this work I took session of students on foggers and it’s uses , Fan-Pad Polyhouse and Naturally Ventilated Polyhouse.

For taking reading I turned off the water on pads and exhaust fans. At 1:13 pm temperature inside polyhouse was 37 degree ,at that time outer temperature was 27 degree, and here I started recording temperature drop by turning on foggers and exhaust fans. I got 11 degree temperature drop in 10 minutes i.e from 1:13-1:23. At 1:23 when I stopped foggers and exhaust fans the temperature was 25 degree. Now, we will see the temperature rise by keeping pads and exhaust fans off and will do calculations of heat removal in each 1 degree rise in temperature.
https://docs.google.com/spreadsheets/d/1CQaZzVNRfbvlsNe6nhX3qRV2JdRjAg0LzXnZWouDmuo/edit?usp=drivesdk
30/11/24
Today, engineering students from JSPM college visited to Vigyan Ashram for educational visit. As a volunteer I took a tour to Vigyan Ashram campus, introduced them to different departments, projects undergoing in Vigyan Ashram.
In afternoon period I did calculations regarding water evaporated/sec on excel sheet on basis of collected data
3/12/24
Calculations which were done for finding out water to be evaporated were showed to sir. We observed the data which was calculated. Approx water to be evaporated we got 16 gms/sec to remove the temperature which has been increased. Further it was decided to calculate the air exhausted from polyhouse.
Link to data and calculations
4/12/24
To determine humid air exhaust while exhaust fans and foggers are on at same time.
Here I did calculations regarding air to be exhaust from polyhouse. But values were differing so this is not exact formula/calculations to determine air volume. Useful info or formula we got from this calculations is formula to calculate the absolute humidity
Heat measurements conducted in November
Experimental Procedure for Determining Heat Absorption and Required Evaporation Rate in a Polyhouse
To quantify the heat absorbed by the polyhouse and determine the amount of water required for evaporative cooling, a controlled experiment was conducted. The methodology follows these steps:
Setup:
The fan-pad cooling system was turned off to allow the polyhouse to reach a stabilized internal temperature.
The experiment was performed between 11:00 AM and 2:00 PM, when solar radiation is at its peak.
Cooling Phase:
The fogger system and exhaust fans were activated to induce a controlled temperature drop inside the polyhouse.
Cooling was maintained until the internal temperature reached equilibrium with the ambient external temperature.
Heat Gain Measurement:
Once equilibrium was achieved, the foggers and exhaust fans were deactivated.
The internal temperature rise was monitored over a 1-hour period to capture the heat gain rate.
Calculation of Evaporation Rate for Cooling:
From the 1-hour temperature rise data, the heat absorbed by the polyhouse was determined using the heat balance equation:
Q=m x cp x ΔT
Where
Q = Heat supplied to the system
m = mass of the system
cp = Specific heat capacity of the system and
ΔT = Change in temperature of the system.
The water evaporation rate required for cooling was derived using the latent heat of vaporization of water (~2260 kJ/kg).
Validation and Multiple Readings:
Multiple trials were conducted to ensure consistency in the measured evaporation rate.
The recorded values consistently indicated a requirement of 14-15 g/s of water evaporation per degree of temperature reduction.
This dataset provides a basis for optimizing the evaporative cooling system within the polyhouse environment.
Link to spreadsheet which contains heat measurement data:
https://docs.google.com/spreadsheets/d/1CQaZzVNRfbvlsNe6nhX3qRV2JdRjAg0LzXnZWouDmuo/edit?usp=sharing
Heat Measurement conducted in month of December
Water gain and airflow assessment in a polyhouse with a Fan-Pad cooling system
To quantify the actual water gain in the polyhouse during fan-pad system operation, temperature and humidity sensors were strategically positioned at key locations: outside the cooling pads, inside the cooling pads, and at the center of the pad wall. These sensors provided real-time temperature and humidity data, enabling the determination of water vapor flux entering the polyhouse through the wet pads.
An anemometer was utilized to measure the airflow velocity across the cooling pads, providing essential data for calculating the air mass flow rate. Based on these measurements, the following results were obtained:
Water gain by polyhouse: 49 g/s
Air mass flow rate entering polyhouse: 14.80 kg/s
The detailed calculations and sensor data are documented in the Google Sheet titled “Water Gained and Air Entering in Polyhouse”
https://docs.google.com/spreadsheets/d/1CQaZzVNRfbvlsNe6nhX3qRV2JdRjAg0LzXnZWouDmuo/edit?usp=sharing
Heat Absorption Analysis in the Polyhouse
The total heat absorbed by the polyhouse was determined considering two primary components:
Latent heat of vaporization – The thermal energy required to evaporate water through the wet pads, facilitating evaporative cooling.
Sensible heat – The heat absorbed due to the increase in temperature, as well as the heat required to vaporize water for heat dissipation.
The calculations, based on temperature and humidity readings, yielded the following results:
Total heat absorbed by the polyhouse: 87 kJ/s
Water required for evaporation to dissipate heat: 38.5 g/s
These computations were performed using sensor readings recorded in the Google Sheet titled “29 Dec, 24” (https://docs.google.com/spreadsheets/d/1CQaZzVNRfbvlsNe6nhX3qRV2JdRjAg0LzXnZWouDmuo/edit?usp=sharing)
Discussion and Implications
The results indicate that the water gained by the polyhouse (49 g/s) exceeds the amount required for effective evaporative cooling (38.5 g/s).
